 Multi-family
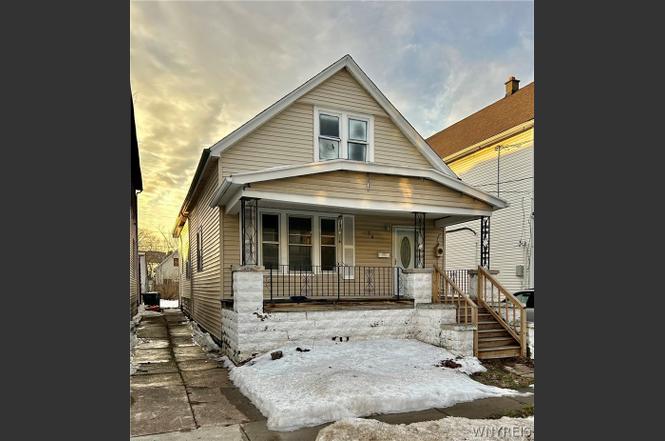
24 Matejko St · Buffalo, NY
Flood risk 2/10 · Minimal
- FEMA flood zone
- X (unshaded)
- Chance of flooding over 30 yrs
- 0.09%
- Est. flood insurance / yr
- $507 – $1,088
Fire risk 1/10 · Minimal
- Est. fire insurance / yr
- $691 – $1,283
Heat risk 3/10 · Minor
- Hot days now (above 92°F)
- 7 days/yr
- Hot days in 30 yrs
- 15 days/yr
Wind risk 1/10 · Minimal
- Chance of severe wind over 30 yrs
- —
Air-quality risk 3/10 · Minor
- Unhealthy air days now
- 2 days/yr
- Unhealthy air days in 30 yrs
- 3 days/yr
Risk factors via First Street. Map © Google.
Why this score? — see what drove the C- grade
The composite is a weighted blend of 9 inputs, each scored 0–100. Each bar is that input's sub-score; the figure is the points it added to the 100-point composite (weight × sub-score).
- Cash flow +14.9/30.0
- Appreciation +9.0/10.0
- ARV discount +8.5/15.0
- DSCR +4.5/10.0
- 1% rule +4.1/10.0
- Livability +3.9/5.0
- Schools +3.3/10.0
- Rent growth +2.5/5.0
- Condition / age +2.5/5.0
$180,000
🖨 Deal sheet 📄 Offer letter ✓ Due diligence
Multi-family units
County records classify this as Multi-Family (2-4 Unit). Listing-text estimate: 1 unit. estimate disagrees with records
Listing remarks
This spacious 6 bedroom, 2 full bath Colonial with off-street parking is full of character and ready for your finishing touches. Step onto the inviting front porch and into a generously sized living room featuring wall-to-wall carpeting and plumbing in place for a wood stove or fireplace. French doors lead to the formal dining room, which flows into a remodeled eat-in kitchen complete with wood cabinetry. The first floor also offers two bedrooms and a full bath with tub/shower and built-in linen storage. The second floor features three additional bedrooms, a second full bath with walk-in shower and double-sink vanity, plus two versatile bonus living areas perfect for a home office, family r
Key facts
- Double-sink vanity
- Bonus living areas
- Walk-in shower
Tags
Neighborhood map
What this means for you Summary
Snapshot
- This is a 4-bed/2.0-bath multifamily listed at $180k.
Deal economics
- At list price, monthly cash flow is $52 ($623/yr) — positive.
- The deal already cash-flows at list — no discount required.
- To meet the 1% rule (rent ≥ 1% of price), the offer needs to be $164k (8.9% below list).
- Recommended offer: $164k (8.9% below list) — sets the bar for 1% rule.
Location & tenants
- Location reads 77/100 on livability (#195 in NY, #3,011 nationally) — a middle-class / working-renter tenant base. Strengths: commute A+, housing A+, health & safety A+; Watch: crime F, employment D-.
- Buffalo City School District (urban): math 41% / reading 40% proficiency, ranked #535 of 590 in NY (top 91%) — families likely to look elsewhere, expect single-tenant / working-renter base with shorter leases; 75% free/reduced lunch — lower-income household profile, screen leases tightly.
- Market conditions: 169 active listings in the ZIP; 1 comparable units currently listed for rent nearby; 1,244 units permitted in Erie County in 2024 (563 in 5+ unit buildings).
- This rent runs 39% of the median local income ($50k/yr) — at the standard rent-burdened threshold; future hikes will face affordability resistance.
Forward outlook
- In year one you build about $16k of equity ($1k loan paydown + $15k appreciation (8.1% local appreciation)).
- At projected returns (8.1% appreciation + 3.0% rent growth), your $50k cash investment doubles in ~3 years — after that, you're playing with house money.
- By year 3, paydown + projected appreciation supports a ~$39k cash-out refi (75% LTV) — recoverable capital for the next deal without selling this one.
Negotiation context
- It's been on market 60 days — a 3% lower offer ($175k) is reasonable based on typical stale-listing flexibility.
- 5 sale attempts since 17y ago; this cycle's ask has dropped $20k (10%) from the opening price — seller is motivated, your offer sets the floor, not the list.
- Current owner paid $45k; list at $180k implies a 300% gain — meaningful room to come down on a strong offer.
Risks & watch-outs
- Watch-outs: built in 1930 — expect roof / HVAC / electrical / plumbing capex.
Questions for the listing agent
- It's been on market 60 days. Have you received any prior offers? Is the seller open to a 9% concession, seller financing, or rate buy-down credit?
- Built in 1930 — when were the roof, HVAC, electrical panel, plumbing, and water heater last replaced?
- Is there a deadline driving the sale (1031 exchange, divorce, estate, relocation)? That informs how much negotiation room exists.
- Crime grade is F in this area — have there been break-ins, vandalism, or insurance claims at this property in the last 3 years? What carrier currently insures it and at what premium?
- What's the average days-on-market for RENTAL listings here right now (not sales)? A rising rental-DOM trend means longer vacancies and softer asking-rent achievability than the comps imply.
- What's the recent tenant-quality profile in this submarket — average credit score on applications, eviction rate, late-payment / NSF rate, and stable-employment percentage? A property-management company in the area should have these aggregated.
- How much new apartment / multifamily construction is in the pipeline within 1–3 miles? Heavy new supply (>2% of stock underway) typically softens rents 12–24 months out; light construction supports rent growth.
Investment metrics
- 1% rule
- 0.91% ✗
- Cap rate
- 6.64%
- Cash-on-cash
- 1.24%
- DSCR
- 1.05
- GRM
- 9.1
CMA / ARV
- ARV (on-the-fly)
- $184,179
- Comps found
- 12
Show comp detail 12 sales within ~0.75 mi
| Address | Dist | Beds/Ba | Sqft | Sold | Price | $/sf | Match |
|---|---|---|---|---|---|---|---|
| 150 Weiss St | 0.19mi | 5/2.0 (+1) | 2,121 (+0%) | 8mo | $100,000 | $47 | 79 |
| 120 Weiss St | 0.23mi | 5/2.0 (+1) | 2,040 (-4%) | 2mo | $80,000 | $39 | 76 |
| 129 Gorski St | 0.20mi | 3/2.0 (-1) | 2,054 (-3%) | 7mo | $130,000 | $63 | 74 |
| 204 Cable St | 0.29mi | 5/2.0 (+1) | 2,047 (-3%) | 7mo | $190,000 | $93 | 70 |
| 323 Holly St | 0.43mi | 5/2.0 (+1) | 2,112 (-0%) | 8mo | $180,000 | $85 | 68 |
| 100 Shanley St | 0.68mi | 4/2.0 | 2,112 (-0%) | 7mo | $190,000 | $90 | 62 |
| 52 Fredro St | 0.25mi | 4/2.0 | 1,856 (-12%) | 7mo | $43,000 | $23 | 62 |
| 210 Weimar St | 0.26mi | 5/2.0 (+1) | 1,848 (-13%) | 4mo | $175,000 | $95 | 58 |
| 111 Roberts Ave | 0.22mi | 5/2.0 (+1) | 1,810 (-14%) | 5mo | $115,000 | $64 | 57 |
| 12 Hobart St | 0.67mi | 4/2.0 | 2,012 (-5%) | 8mo | $175,000 | $87 | 54 |
| 125 Shanley St | 0.72mi | 5/3.0 (+1) | 2,200 (+4%) | 8mo | $282,000 | $128 | 45 |
| 110 Armin Pl | 0.74mi | 5/2.0 (+1) | 2,366 (+12%) | 1mo | $235,000 | $99 | 40 |
Match score weights: distance 35% · size 25% · config 20% · recency 20%. Top-matched comps best support the ARV.
Projected returns pro-forma
8.06% appreciation · 3.0% rent growth · sell at horizon
- IRR
- 21.1%
- Equity multiple
- 2.55×
- Total profit
- $78,151
- Equity at exit
- $137,466
- IRR
- 19.4%
- Equity multiple
- 5.45×
- Total profit
- $224,367
- Equity at exit
- $273,554
Cash invested: $50,400 (down + closing). Projections, not guarantees.
Landlord ↔ Tenant lean methodology
- Overall (STATE)
- 15 Strongly Tenant-Friendly
- State New York
- 15 Strongly Tenant-Friendly · D+10
- County
- — inherits STATE
- City
- — inherits STATE
ZIP-level market 14206
- Home prices YoY
- 1.8%
- Active inventory
- 169
- Price-to-rent
- 9.1×
Monthly cashflow live
- Estimated rent
- $1,640 medium interval (Pro) →
- Mortgage (P&I)
- −$944
- Tax est. 1.5%
- −$225 /mo · $2,700/yr
- Insurance
- −$75
- HOA
- −$0
- Vacancy / Maint / Mgmt
- −$344
- Net cashflow
- $52
Break-even live
UW: 25.0% down · 7.5% · 30yr · 1.5% tax · 5.0% vac · 8.0% maint · 8.0% mgmt
Financing live
Cash to close
- Down payment
- $45,000
- Closing costs
- $5,400
- Reserves months
- —
- Total cash needed
- —
Loan-product check · same deal, 3 products live
Conventional
25% down · 7.5% · 30yr
- Down + closing
- —
- Monthly P&I
- —
- Monthly cashflow
- —
- DSCR
- —
- Eligible?
- —
Personal DTI + credit; lowest rate.
DSCR
20% down · 8.5% · 30yr
- Down + closing
- —
- Monthly P&I
- —
- Monthly cashflow
- —
- DSCR
- —
- Eligible?
- —
No personal income docs; deal must DSCR.
Hard money
10% down · 12.0% · 12mo
- Down + closing
- —
- Monthly P&I
- —
- Monthly cashflow
- —
- DSCR
- —
- Eligible?
- —
Short-term bridge; refi at stabilization.
Rent comps 1 comps
| Address | Beds | Baths | Sqft | Rent | $/sqft | DOM | Units | Dist |
|---|---|---|---|---|---|---|---|---|
| 181 Willett St Buffalo, NY | 3.0 | 1.0 | 2704 | $1,550 | $0.57 | 1d | 1 | 0.61mi |
Listing history 18 events
-
2026-04-24status Pending
-
2026-04-04price $180,000
-
2026-03-18price $125,000
-
2026-02-21$199,900 Active
-
2026-01-23historical
-
2025-11-11$225,000 Active
-
2024-04-04historical
-
2024-03-05price $104,900
-
2024-02-21price $109,900
-
2024-02-13price $119,900
-
2024-02-05$130,000 Active
-
2023-06-23soldstatus $45,000 Closed Sale or Rented
-
2023-05-19status Pending Sale
-
2023-05-09$45,000 Active
-
2010-07-15soldstatus $53,900
-
2009-12-18$49,900
-
1996-02-16soldstatus $38,000
-
1996-01-24soldstatus $25,000
ⓘ Source: listings_history table (triggers on properties + properties_extension) + one-shot
backfill from property_details.listing_events for pre-trigger history.
Climate risk First Street
- Flood 2/10 Low FEMA zone X (unshaded) · 9% chance over 30 yrs
- Wildfire 1/10 Low
- Heat 3/10 Moderate 7 d/yr ≥92°F today · 15 d/yr by 30 yrs out
- Wind 1/10 Low
- Air quality 3/10 Moderate 2 unhealthy d/yr today · 3 by 30 yrs out
Nearby sold comps map
Loading sold comps map…
Walkable amenities ~0.75 mi
Loading nearby amenities…
Taxation est. · year 1
- Rental income
- $19,683
- − Mortgage interest
- −$10,083
- − Property taxes
- −$2,700
- − Insurance
- −$900
- − Repairs & maintenance
- −$1,575
- − Management
- −$1,575
- − Depreciation
- −$5,236
- Taxable loss
- −$2,385
- Est. tax savings @ 24.0%
- +$572
- After-tax cash flow
- $1,195/yr
For passive investors: Depreciation is non-cash, so a rental often shows a tax loss while cash-flowing — sheltering income. Rental losses are passive: they offset passive income freely, and up to $25,000/yr can offset ordinary (W-2) income if you actively participate and your MAGI is under $100k (phasing out to $0 by $150k); unused losses carry forward. On sale, claimed depreciation is recaptured at up to 25%, and gains may owe capital-gains tax (a 1031 exchange can defer both). Figures are a year-1 estimate at your 24.0% rate — not tax advice; consult a CPA.
Schools (NCES district)
- District
- Buffalo City School District
- NCES district ID
- 3605850
- Math proficiency
- 41% ▲ 11.00%
- Reading proficiency
- 40% ▲ 7.00%
- Median HH income
- $31,665
- Composite
- 33.17/100
- National rank
- #5544
- State rank
- #535 of 590 in NY
Livability — Buffalo
- Score
- 77/100
- State rank
- #195
- US rank
- #3011
Category grades
Schools grade is shown separately in the Schools card above.
Census & demographics
- Census place
- Buffalo, NY
- County
- Erie County · 714,559 people
- City population
- 440,021
- Metro
- Buffalo-Cheektowaga, NY
- Population (ZIP)
- 21,631
- Household income
- $50,450
- Rent vs Own
- Severe rent burden
- 841.0
Population outlook (Erie County) Hauer SSP2
- Today (2025)
- 933,037 people
- By 2030
- 935,181 · +0.2%
- By 2040
- 928,531 · -0.5%
- By 2050
- 905,725 · -2.9%
- By 2075
- 834,037 · -10.6%
- By 2100
- 708,033 · -24.1%
Race, ethnicity, and origin ACS 2023
- Neighborhood character
- Majority White (65%)
- Race & ethnicity
- White 65% Hispanic / Latino 13% Black 12% Two or more races 8% Asian 4%
- Hispanic origin (detail)
- Mexican 2% Puerto Rican 10%
- Common ancestry
- Romanian 25% Lithuanian 1% Italian 1%
- Foreign-born
- 6% · Canada, China
- Languages at home
- 88% English-only · Spanish 5% Other Indo-European 3% Arabic 2%
Political lean MEDSL · Erie
- 2024 margin
- Lean D (+9.7) · D 54.8% · R 45.2%
- 2008→2024 swing
- -7.9pp toward R · 2008: 17.5pp · 2024: 9.7pp
- All cycles
- 2024: D+9.7 2020: D+14.7 2016: D+4.8 2012: D+15.6 2008: D+17.5
Not yet ingested
- Civics
- —
Market trends
- HPI YoY
- ▲ 8.06%
- Current HPI
- 457.3935
- Rent YoY
- —
- Metro
- Buffalo-Cheektowaga, NY
- State GDP YoY
- ▲ 2.60%
- F500 in state
- 92
Industry mix (Fortune 500 HQ in NY)
| Industry | F500 HQs | Revenue |
|---|---|---|
| Financial Services | 10 | $950B |
|
||
| Consumer Goods | 9 | $162B |
|
||
| Insurance | 4 | $225B |
|
||
| Telecommunications | 2 | $144B |
|
||
| Pharmaceuticals | 2 | $112B |
|
||
| Media / Entertainment | 2 | $69B |
|
||
Price history
+620.0% since first listed18 events — show timeline
- 2026-04-24 Pending — WNYREIS
- 2026-04-04 Price Changed $180,000 WNYREIS
- 2026-03-18 Price Changed $125,000 WNYREIS
- 2026-02-21 Listed $199,900 WNYREIS
- 2026-01-23 Listing Removed — WNYREIS
- 2025-11-11 Listed $225,000 WNYREIS
- 2024-04-04 Listing Removed — WNYREIS
- 2024-03-05 Price Changed $104,900 WNYREIS
- 2024-02-21 Price Changed $109,900 WNYREIS
- 2024-02-13 Price Changed $119,900 WNYREIS
- 2024-02-05 Listed $130,000 WNYREIS
- 2023-06-23 Sold (MLS) $45,000 WNYREIS
- 2023-05-19 Pending — WNYREIS
- 2023-05-09 Listed $45,000 WNYREIS
- 2010-07-15 Sold (MLS) $53,900 WNYREIS
- 2009-12-18 Listed $49,900 WNYREIS
- 1996-02-16 Sold (Public Records) $38,000 Public Records
- 1996-01-24 Sold (Public Records) $25,000 Public Records
Property tax history
+0.7%/yrLatest (2025): $342 · +0.0% YoY. Source: county tax records.
Cash-flow waterfall
monthlySold comps — $/sqft
last 12 mo · ≤1 miLoading sold comps…