 Duplex
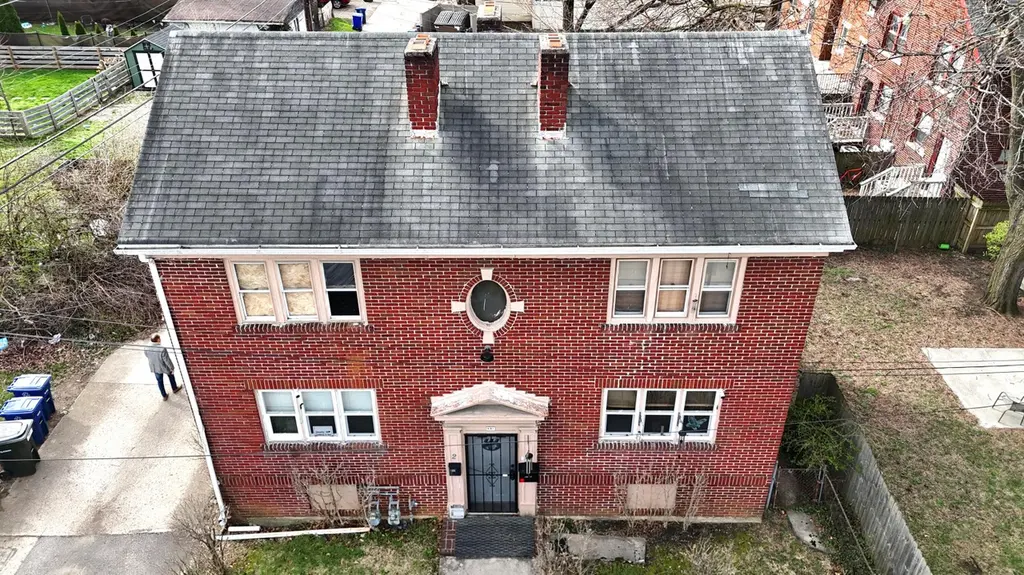
333 E 9th Ave · Columbus, OH
Flood risk 4/10 · Minor
- FEMA flood zone
- X (unshaded)
- Chance of flooding over 30 yrs
- 0.21%
- Est. flood insurance / yr
- $473 – $860
Fire risk 1/10 · Minimal
- Est. fire insurance / yr
- $713 – $1,323
Heat risk 4/10 · Minor
- Hot days now (above 100°F)
- 7 days/yr
- Hot days in 30 yrs
- 18 days/yr
Wind risk 2/10 · Minimal
- Chance of severe wind over 30 yrs
- 1.0%
Air-quality risk 3/10 · Minor
- Unhealthy air days now
- 2 days/yr
- Unhealthy air days in 30 yrs
- 4 days/yr
Risk factors via First Street. Map © Google.
Why this score? — see what drove the C grade
The composite is a weighted blend of 9 inputs, each scored 0–100. Each bar is that input's sub-score; the figure is the points it added to the 100-point composite (weight × sub-score).
- Cash flow +21.5/30.0
- ARV discount +15.0/15.0
- DSCR +6.9/10.0
- 1% rule +4.7/10.0
- Livability +4.0/5.0
- Rent growth +3.0/5.0
- Condition / age +2.5/5.0
- Schools +1.7/10.0
- Appreciation +0.0/10.0
$259,000
🖨 Deal sheet 📄 Offer letter ✓ Due diligence
Multi-family units
County records classify this as Multi-Family (2-4 Unit). Listing-text estimate: 2 units. confirmed
Listing remarks MLS
• Two Unit Apartment Building • Rents Way Below Market, For One Bedroom Units • ±1,540 Square Feet Total Across Entire The Building • Do Not Distrub Tenants • Close Proximity, and Within Walkable Distance, Not Only to The Ohio State University and The Historic Crew Stadium, but also The Ohio State Fairgrounds • ± 0.8 Miles From Interstate-71 Northbound and Southbound, Connecting to Downtown Columbus, I-270, and the Surrounding Area * Curb Offers Only, See A2A remarks.
Key facts
- 1,742 sq ft lot
- Built 1920
- Listed 98 days
Tags
Neighborhood map
What this means for you Summary
Snapshot
- This is a 2 × 1-bed/1-bath units multifamily listed at $259k.
Deal economics
- At list price, monthly cash flow is $391 ($5k/yr) — positive. Per door: $195/mo.
- The deal already cash-flows at list — no discount required.
- To meet the 1% rule (rent ≥ 1% of price), the offer needs to be $250k (3.4% below list).
- Recommended offer: $236k (9.0% below list) — sets the bar for market timing.
- Cap rate 8.1% vs local median 3.8% in Columbus — top-decile yield for the area; either an underpriced asset or a hidden risk that comps aren't pricing in. Stress-test before assuming the spread holds.
Location & tenants
- Location reads 81/100 on livability (#97 in OH, #1,491 nationally) — a professional / high-income tenant draw. Strengths: commute A+, cost of living A+, housing A+; Watch: employment C-, crime F.
- Columbus City School District (urban): math 15% / reading 26% proficiency, ranked #626 of 656 in OH (top 95%) — low school quality limits family demand, transient renter base, plan for 1-2y turnover; 72% free/reduced lunch — lower-income household profile, screen leases tightly.
- Market conditions: Rents rising (+2.1%/yr); 136 active listings in the ZIP; 40 comparable units currently listed for rent nearby; rentals at typical pace (median 17d on market — plan ~3-4 weeks tenant-placement turnaround); lower-income renter base — watch delinquency; 8,139 units permitted in Franklin County in 2024 (5,940 in 5+ unit buildings).
- At $2,502/mo this rent would consume 69% of the median local household income ($44k/yr) (locally 4913% of renters already pay >50% of income on rent) — very limited rent-growth headroom before tenants either downsize or default.
Forward outlook
- Local home prices are declining (-3.0%/yr); year-one equity from $2k of loan paydown is wiped out by about $8k of value loss. Plan a longer hold.
- Franklin County population projected at +34% by 2050 — long-run rental-demand tailwind backs the buy-and-hold thesis.
Negotiation context
- It's been on market 98 days — a 9% lower offer ($236k) is reasonable based on typical stale-listing flexibility.
- 3 sale attempts since 29y ago with the ask held roughly flat each time — persistent listings suggest the price (not the market) is what's stuck; bring a comps-based counter.
- Current owner paid $42k; list at $259k implies a 509% gain — meaningful room to come down on a strong offer.
Risks & watch-outs
- Watch-outs: built in 1920 — expect roof / HVAC / electrical / plumbing capex.
Questions for the listing agent
- It's been on market 98 days. Have you received any prior offers? Is the seller open to a 9% concession, seller financing, or rate buy-down credit?
- Can we see the unit-by-unit rent roll, current vacancy, and any below-market leases? What's the average tenancy length?
- What capital expenditures (roof, boiler, parking lot, exteriors) have been made in the last 5 years, and what's planned in the next 2?
- Built in 1920 — when were the roof, HVAC, electrical panel, plumbing, and water heater last replaced?
- Why hasn't it sold? Are there any deal-killer items the seller is aware of (foundation, flood, title, zoning, code violations)?
- Is there a deadline driving the sale (1031 exchange, divorce, estate, relocation)? That informs how much negotiation room exists.
- Crime grade is F in this area — have there been break-ins, vandalism, or insurance claims at this property in the last 3 years? What carrier currently insures it and at what premium?
- What's the average days-on-market for RENTAL listings here right now (not sales)? A rising rental-DOM trend means longer vacancies and softer asking-rent achievability than the comps imply.
- What's the recent tenant-quality profile in this submarket — average credit score on applications, eviction rate, late-payment / NSF rate, and stable-employment percentage? A property-management company in the area should have these aggregated.
- How much new apartment / multifamily construction is in the pipeline within 1–3 miles? Heavy new supply (>2% of stock underway) typically softens rents 12–24 months out; light construction supports rent growth.
Investment metrics
- 1% rule
- 0.97% ✗
- Cap rate
- 8.10%
- Cash-on-cash
- 6.46%
- DSCR
- 1.29
- GRM
- 8.6
CMA / ARV
- ARV (median comp)
- $494,796
- List price
- $259,000
- Delta
- -47.66%
- Verdict
- UNDERPRICED
- Comps
- 9 within 1.0 mi
Show comp detail 2 sales within ~0.75 mi
| Address | Dist | Beds/Ba | Sqft | Sold | Price | $/sf | Match |
|---|---|---|---|---|---|---|---|
| 423-425 E 14th Ave | 0.36mi | 3/— (+1) | 1,754 (+14%) | 21mo | $265,000 | $151 | 38 |
| 966 N 6th St | 0.70mi | 2/— | 1,710 (+11%) | 16mo | $399,900 | $234 | 36 |
Match score weights: distance 35% · size 25% · config 20% · recency 20%. Top-matched comps best support the ARV.
Projected returns pro-forma
-3.0% appreciation · 2.14% rent growth · sell at horizon
- IRR
- -7.3%
- Equity multiple
- 0.73×
- Total profit
- $-19,331
- Equity at exit
- $38,618
- IRR
- 1.3%
- Equity multiple
- 1.09×
- Total profit
- $6,182
- Equity at exit
- $22,394
Cash invested: $72,520 (down + closing). Projections, not guarantees.
Landlord ↔ Tenant lean methodology
- Overall (STATE)
- 73 Landlord-Friendly
- State Ohio
- 73 Landlord-Friendly · R+6
- County
- — inherits STATE
- City
- — inherits STATE
ZIP-level market 43201
- Rents YoY
- 2.1%
- Active inventory
- 136
- Price-to-rent
- 17.3×
Monthly cashflow live
- Estimated rent
- $2,502 high interval (Pro) →
- Mortgage (P&I)
- −$1,358
- Tax from tax record
- −$120 /mo · $1,439/yr
- Insurance
- −$108
- HOA
- −$0
- Vacancy / Maint / Mgmt
- −$525
- Net cashflow
- $391
Break-even live
2-unit breakdown (identical units grouped — click to expand)
| Units | Beds | Baths | Est. rent |
|---|---|---|---|
| 2× units | 1 | 1 | $2,502 |
| #1 | 1 | 1 | $1,251 |
| #2 | 1 | 1 | $1,251 |
| Total (2 units) | $2,502 | ||
UW: 25.0% down · 7.5% · 30yr · 1.5% tax · 5.0% vac · 8.0% maint · 8.0% mgmt
Financing live
Cash to close
- Down payment
- $64,750
- Closing costs
- $7,770
- Reserves months
- —
- Total cash needed
- —
Loan-product check · same deal, 3 products live
Conventional
25% down · 7.5% · 30yr
- Down + closing
- —
- Monthly P&I
- —
- Monthly cashflow
- —
- DSCR
- —
- Eligible?
- —
Personal DTI + credit; lowest rate.
DSCR
20% down · 8.5% · 30yr
- Down + closing
- —
- Monthly P&I
- —
- Monthly cashflow
- —
- DSCR
- —
- Eligible?
- —
No personal income docs; deal must DSCR.
Hard money
10% down · 12.0% · 12mo
- Down + closing
- —
- Monthly P&I
- —
- Monthly cashflow
- —
- DSCR
- —
- Eligible?
- —
Short-term bridge; refi at stabilization.
Rent comps 40 comps
| Address | Beds | Baths | Sqft | Rent | $/sqft | DOM | Units | Dist |
|---|---|---|---|---|---|---|---|---|
| 370 E 11th Ave Columbus, OH | 2.0–3.0 | 1.0–2.5 | 986 | $1,581 | $1.60 | 1d | 5 | 0.10mi |
| 1254 N Grant Ave Columbus, OH | 2.0 | 2.5 | 1600 | $2,299 | $1.44 | 23d | 1 | 0.30mi |
| 1522 Indianola Ave Unit C Columbus, OH | 3.0 | 1.5 | 1270 | $1,950 | $1.54 | 23d | 1 | 0.31mi |
| 127 E 8th Ave Columbus, OH | 3.0 | 3.0 | 2000 | $3,800 | $1.90 | 43d | 1 | 0.32mi |
| 303 E 6th Ave Columbus, OH | 2.0 | 1.0–2.0 | 900 | $3,180 | $3.53 | 2d | 173 | 0.36mi |
| 1206 N 4th St Columbus, OH | 3.0 | 1.0–3.0 | 971 | $2,563 | $2.64 | 2d | 44 | 0.38mi |
| 100 E 11th Ave Columbus, OH | 2.0 | 3.0 | 1440 | $2,500 | $1.74 | 43d | 1 | 0.40mi |
| 41 E 9th Ave Columbus, OH | 2.0 | 2.0 | 1189 | $2,450 | $2.06 | 43d | 2 | 0.42mi |
| 1237 Indianola Ave Unit A Columbus, OH | 2.0 | 1.0 | 1100 | $1,625 | $1.48 | 23d | 1 | 0.50mi |
| 1803 N 4th St Columbus, OH | 2.0 | 1.0 | 1300 | $1,250 | $0.96 | 43d | 1 | 0.50mi |
| 1268 Courtland Ave Columbus, OH | 3.0 | 1.5 | 1300 | $1,799 | $1.38 | 3d | 1 | 0.51mi |
| 115 E 5th Ave Columbus, OH | 2.0 | 1.0–2.0 | 840 | $1,915 | $2.28 | 7d | 9 | 0.52mi |
| 1251 Courtland Ave Columbus, OH | 1.0–2.0 | 1.0 | 951 | $1,850 | $1.95 | 10d | 11 | 0.55mi |
| 1254 N High St Columbus, OH | 2.0 | 1.0 | 1172 | $1,775 | $1.51 | 23d | 1 | 0.56mi |
| 1055 Lusso Ave Columbus, OH | 1.0–2.0 | 1.0–2.0 | 905 | $1,738 | $1.92 | 2d | 13 | 0.57mi |
| 54 W 8th Ave Columbus, OH | 3.0 | 2.0 | 1200 | $1,600 | $1.33 | 43d | 1 | 0.59mi |
| 1102 Summit St Columbus, OH | 3.0 | 2.5 | 1808 | $3,200 | $1.77 | 43d | 1 | 0.59mi |
| 1094 Say Ave Columbus, OH | 3.0 | 2.0 | 1400 | $2,995 | $2.14 | 43d | 1 | 0.62mi |
| 1063 Summit St Columbus, OH | 2.0 | 1.5 | 1300 | $1,875 | $1.44 | 43d | 1 | 0.65mi |
| 100 McMillen Ave Unit C Columbus, OH | 3.0 | 2.0 | 1200 | $1,649 | $1.37 | 14d | 1 | 0.66mi |
| 94 E 3rd Ave Columbus, OH | 2.0 | 2.0 | 1075 | $1,795 | $1.67 | 2d | 1 | 0.68mi |
| 121 W 9th Ave Columbus, OH | 2.0–3.0 | 1.0 | 1525 | $1,350 | $0.89 | 43d | 3 | 0.69mi |
| 153 Punta Aly Columbus, OH | 3.0 | 1.5 | 1358 | $2,100 | $1.55 | 43d | 1 | 0.72mi |
| 1282 Hunter Ave Columbus, OH | 1.0–3.0 | 1.0–2.0 | 1350 | $1,675 | $1.24 | 7d | 2 | 0.73mi |
| 1079 N High St Columbus, OH | 1.0–2.0 | 1.0–2.0 | 993 | $2,525 | $2.54 | 2d | 8 | 0.74mi |
| 40 W 3rd Ave Apt 305 Columbus, OH | 1.0 | 2.5 | 1335 | $2,109 | $1.58 | 43d | 1 | 0.77mi |
| 990 N 9th St Unit 990 Columbus, OH | 2.0 | 1.0 | 1264 | $1,345 | $1.06 | 17d | 1 | 0.78mi |
| 1020 N High St Columbus, OH | 1.0 | 1.0–1.5 | 894 | $1,535 | $1.72 | 1d | 7 | 0.78mi |
| 138 Sommerfeld Pl Columbus, OH | 1.0–3.0 | 1.0–2.5 | 1212 | $1,642 | $1.36 | 2d | 21 | 0.79mi |
| 898 E 13th Ave Columbus, OH | 3.0 | 1.0 | 1120 | $1,230 | $1.10 | 10d | 1 | 0.80mi |
| 898-900 E 13th Ave Unit 898 Columbus, OH | 3.0 | 1.0 | 1120 | $1,230 | $1.10 | 7d | 1 | 0.80mi |
| 210 W 5th Ave Columbus, OH | 2.0 | 1.0–2.0 | 894 | $2,810 | $3.14 | 3d | 13 | 0.80mi |
| 1174 Walters St Columbus, OH | 3.0 | 1.0 | 1200 | $1,549 | $1.29 | 43d | 1 | 0.81mi |
| 163 W 5th Ave Columbus, OH | 3.0 | 3.0 | 1400 | $1,895 | $1.35 | 23d | 1 | 0.81mi |
| 962 Mount Pleasant Ave Columbus, OH | 2.0 | 1.5 | 1626 | $2,650 | $1.63 | 43d | 1 | 0.82mi |
| 985 N High St Columbus, OH | 2.0 | 1.0–2.0 | 1113 | $3,895 | $3.50 | 1d | 8 | 0.84mi |
| 76 W Starr Ave Columbus, OH | 3.0 | 1.0 | 1500 | $3,400 | $2.27 | 43d | 1 | 0.86mi |
| 1235 Highland St Unit 1265655P Columbus, OH | 2.0 | 2.0 | 1582 | $3,554 | $2.25 | 12d | 1 | 0.86mi |
| 111 W 3rd Ave Columbus, OH | 1.0–2.0 | 1.0–2.0 | 1016 | $2,197 | $2.16 | 2d | 10 | 0.86mi |
| 283 E 1st Ave Columbus, OH | 1.0–2.0 | 1.0–2.5 | 1076 | $2,867 | $2.66 | 2d | 17 | 0.87mi |
Listing history 23 events
-
2026-06-18days on market $259,000 Active 98 DOM
-
2026-06-17days on market $259,000 Active 97 DOM
-
2026-06-16days on market $259,000 Active 96 DOM
-
2026-06-15days on market $259,000 Active 95 DOM
-
2026-06-13days on market $259,000 Active 93 DOM
-
2026-06-13days on market $259,000 Active 92 DOM
-
2026-06-09days on market $259,000 Active 89 DOM
-
2026-06-08days on market $259,000 Active 88 DOM
-
2026-06-07days on market $259,000 Active 87 DOM
-
2026-06-05days on market $259,000 Active 84 DOM
-
2026-06-03days on market $259,000 Active 83 DOM
-
2026-06-02days on market $259,000 Active 82 DOM
-
2026-06-01days on market $259,000 Active 81 DOM
-
2026-05-31days on market $259,000 Active 80 DOM
-
2026-03-12$259,000 Active 529-char remark
Show marketing remark (529 chars)
• Two Unit Apartment Building • Rents Way Below Market, For One Bedroom Units • ±1,540 Square Feet Total Across Entire The Building • Do Not Distrub Tenants • Close Proximity, and Within Walkable Distance, Not Only to The Ohio State University and The Historic Crew Stadium, but also The Ohio State Fairgrounds • ± 0.8 Miles From Interstate-71 Northbound and Southbound, Connecting to Downtown Columbus, I-270, and the Surrounding Area * Curb Offers Only, See A2A remarks.
-
2001-07-25soldstatus $42,500 20-char remark
Show marketing remark (20 chars)
BANK REPO SOLD AS IS
-
2001-06-29historical 20-char remark
Show marketing remark (20 chars)
BANK REPO SOLD AS IS
-
2001-06-21$42,500 20-char remark
Show marketing remark (20 chars)
BANK REPO SOLD AS IS
-
1998-03-02soldstatus $41,500
-
1998-02-27soldstatus $46,500
-
1997-09-10historical
-
1997-04-26$42,900
-
1979-04-01soldstatus $31,400
ⓘ Source: listings_history table (triggers on properties + properties_extension) + one-shot
backfill from property_details.listing_events for pre-trigger history.
Tax reassessment forecast OH · Partial reset (capped growth)
- Current annual tax
- $1,439 · $120/mo
- Projected year-2 tax
- $2,740 · $228/mo
- Expected delta
- +$1,301/yr (+$108/mo · 90.4%)
ⓘ Screening estimate from a state-policy table — verify with the county assessor before closing.
Climate risk First Street
- Flood 4/10 Moderate FEMA zone X (unshaded) · 21% chance over 30 yrs
- Wildfire 1/10 Low
- Heat 4/10 Moderate 7 d/yr ≥100°F today · 18 d/yr by 30 yrs out
- Wind 2/10 Low 100% chance of damaging wind over 30 yrs
- Air quality 3/10 Moderate 2 unhealthy d/yr today · 4 by 30 yrs out
Nearby sold comps map
Loading sold comps map…
Walkable amenities ~0.75 mi
Loading nearby amenities…
Taxation est. · year 1
- Rental income
- $30,024
- − Mortgage interest
- −$14,508
- − Property taxes
- −$1,439
- − Insurance
- −$1,295
- − Repairs & maintenance
- −$2,402
- − Management
- −$2,402
- − Depreciation
- −$7,535
- Taxable income
- $444
- Est. tax owed @ 24.0%
- −$106
- After-tax cash flow
- $4,580/yr
For passive investors: Depreciation is non-cash, so a rental often shows a tax loss while cash-flowing — sheltering income. Rental losses are passive: they offset passive income freely, and up to $25,000/yr can offset ordinary (W-2) income if you actively participate and your MAGI is under $100k (phasing out to $0 by $150k); unused losses carry forward. On sale, claimed depreciation is recaptured at up to 25%, and gains may owe capital-gains tax (a 1031 exchange can defer both). Figures are a year-1 estimate at your 24.0% rate — not tax advice; consult a CPA.
Schools (NCES district)
- District
- Columbus City School District
- NCES district ID
- 3904380
- Math proficiency
- 15% ▼ -17.00%
- Reading proficiency
- 26% ▼ -12.00%
- Median HH income
- $38,483
- Composite
- 17.19/100
- National rank
- #9105
- State rank
- #626 of 656 in OH
Livability — Columbus
- Score
- 81/100
- State rank
- #97
- US rank
- #1491
Category grades
Schools grade is shown separately in the Schools card above.
Census & demographics
- Census place
- Columbus, OH
- County
- Franklin County · 1,351,780 people
- City population
- 612,189
- Metro
- Columbus, OH
- Population (ZIP)
- 34,322
- Household income
- $43,731
- Rent vs Own
- Severe rent burden
- 4913.0
Population outlook (Franklin County) Hauer SSP2
- Today (2025)
- 1,456,139 people
- By 2030
- 1,556,890 · +6.9%
- By 2040
- 1,757,349 · +20.7%
- By 2050
- 1,950,539 · +34.0%
- By 2075
- 2,376,171 · +63.2%
- By 2100
- 2,636,796 · +81.1%
Race, ethnicity, and origin ACS 2023
- Neighborhood character
- Predominantly White (68%)
- Race & ethnicity
- White 68% Black 14% Two or more races 8% Asian 7% Hispanic / Latino 5%
- Hispanic origin (detail)
- Mexican 1% Puerto Rican 1%
- Common ancestry
- Romanian 4% Lithuanian 2% Italian 2%
- Foreign-born
- 8% · Canada, China, Jamaica
- Languages at home
- 90% English-only · Chinese 3% Spanish 2% Other Indo-European 2%
Political lean MEDSL · Franklin
- 2024 margin
- Strong D (+28.4) · D 63.7% · R 35.3% · Other 1.0%
- 2008→2024 swing
- +7.7pp toward D · 2008: 20.7pp · 2024: 28.4pp
- All cycles
- 2024: D+28.4 2020: D+31.4 2016: D+25.9 2012: D+21.7 2008: D+20.7
Not yet ingested
- Civics
- —
Market trends
- HPI YoY
- ▼ -207.90%
- Current HPI
- 321.7282
- Rent YoY
- ▲ 2.14%
- Metro
- Columbus, OH
- State GDP YoY
- ▲ 1.98%
- F500 in state
- 48
Industry mix (Fortune 500 HQ in OH)
| Industry | F500 HQs | Revenue |
|---|---|---|
| Insurance | 3 | $145B |
|
||
| Industrial Machinery | 3 | $49B |
|
||
| Financial Services | 3 | $24B |
|
||
| Consumer Goods | 2 | $93B |
|
||
| Aerospace / Defense | 2 | $47B |
|
||
| Utilities | 2 | $33B |
|
||
Price history
+724.8% since first listed9 events — show timeline
- 2026-03-12 Listed $259,000 CBRMLS
- 2001-07-25 Sold (MLS) $42,500 CBRMLS
- 2001-06-29 Listing Removed — CBRMLS
- 2001-06-21 Listed $42,500 CBRMLS
- 1998-03-02 Sold (Public Records) $41,500 Public Records
- 1998-02-27 Sold (MLS) $46,500 CBRMLS
- 1997-09-10 Listing Removed — CBRMLS
- 1997-04-26 Listed $42,900 CBRMLS
- 1979-04-01 Sold (Public Records) $31,400 Public Records
Property tax history
+7.2%/yrLatest (2024): $1,439 · +1.3% YoY. Source: county tax records.
Cash-flow waterfall
monthlySold comps — $/sqft
last 12 mo · ≤1 miLoading sold comps…