1005 E Jackson St · Muncie, IN
Flood risk 1/10 · Minimal
- FEMA flood zone
- X (unshaded)
- Chance of flooding over 30 yrs
- 0.0%
- Est. flood insurance / yr
- $507 – $1,088
Fire risk 1/10 · Minimal
- Est. fire insurance / yr
- $717 – $1,331
Heat risk 3/10 · Minor
- Hot days now (above 100°F)
- 7 days/yr
- Hot days in 30 yrs
- 18 days/yr
Wind risk 2/10 · Minimal
- Chance of severe wind over 30 yrs
- 0.0%
Air-quality risk 3/10 · Minor
- Unhealthy air days now
- 2 days/yr
- Unhealthy air days in 30 yrs
- 3 days/yr
Risk factors via First Street. Map © Google.
Why this score? — see what drove the C- grade
The composite is a weighted blend of 9 inputs, each scored 0–100. Each bar is that input's sub-score; the figure is the points it added to the 100-point composite (weight × sub-score).
- Cash flow +17.6/30.0
- Appreciation +7.6/10.0
- ARV discount +7.3/15.0
- DSCR +5.5/10.0
- Livability +4.0/5.0
- 1% rule +3.7/10.0
- Rent growth +3.3/5.0
- Condition / age +2.5/5.0
- Schools +1.7/10.0
$92,500
🖨 Deal sheet 📄 Offer letter ✓ Due diligence
Listing remarks
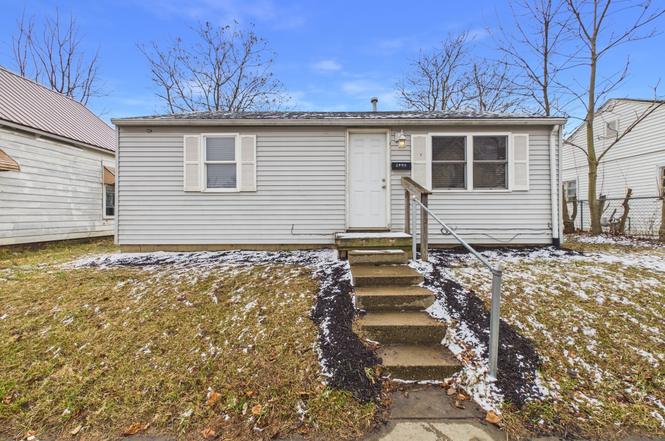
Situated at 1005 E Jackson ST, MUNCIE, IN, USA, a single family residence constructed in 1952 presents an opportunity for a unique living chapter. The interior living space, encompassing 720 square feet, provides an environment designed for comfortable daily routines and personal sanctuary. This thoughtfully proportioned area offers a foundation for creating a personalized and efficient home atmosphere. Extending beyond the residence, a generous lot area of 6000 square feet unfolds, presenting a substantial outdoor canvas. This expansive exterior domain offers abundant possibilities for cultivating a serene garden, engaging in leisurely outdoor pursuits, or simply enjoying moments of tranqu
Key facts
- Single story design
- Updated roof
- Generous lot area
Tags
Property features AI
Exterior
- Utilities: Public water; Municipal sewer connected; Solid waste service available
- Home design: Single-family residence; One story
- Construction: Wood siding; Block foundation
- Exterior features: Lot under 1/4 acre (approximately 0.14 acre)
Interior
- Kitchen: Electric oven; Refrigerator; Kitchen (approx. 9 x 12)
- Bedrooms: 2 bedrooms on the main level (one approx. 9 x 12)
- Bathrooms: 1 full bathroom on the main level
- Heating & cooling: Forced air heating; Central air conditioning
- Interior features: Attic access; Living room (approx. 16 x 12); Additional main-level room (approx. 13 x 9)
- Laundry & utility: Main-level laundry room (approx. 6 x 8)
Neighborhood map
What this means for you Summary
Snapshot
- This is a 2-bed/1.0-bath single-family listed at $92k.
Deal economics
- At list price, monthly cash flow is $73 ($875/yr) — positive.
- The deal already cash-flows at list — no discount required.
- To meet the 1% rule (rent ≥ 1% of price), the offer needs to be $80k (13.0% below list).
- Recommended offer: $80k (13.0% below list) — sets the bar for 1% rule.
- Cap rate 7.2% vs local median 6.0% in Muncie — meaningfully above typical; check what's discounted (condition, days-on-market, listing class) to confirm the premium yield is real.
Location & tenants
- Location reads 80/100 on livability (#18 in IN, #1,654 nationally) — a professional / high-income tenant draw. Strengths: amenities A+, commute A+, cost of living A+; Watch: schools D+, crime F, employment F.
- Muncie Community Schools (urban): math 18% / reading 25% proficiency, ranked #275 of 301 in IN (top 91%) — low school quality limits family demand, transient renter base, plan for 1-2y turnover; 68% free/reduced lunch — lower-income household profile, screen leases tightly.
- Market conditions: Rents rising (+3.3%/yr); 26 active listings in the ZIP; 21 comparable units currently listed for rent nearby; rentals lingering (median 44d on market — plan ~5-8 weeks vacancy on turnover, expect pricing pressure); 100% of comp listings sitting > 30 days — soft ceiling on asking rent; lower-income renter base — watch delinquency; 171 units permitted in Delaware County in 2024 (57 in 5+ unit buildings).
Forward outlook
- In year one you build about $6k of equity ($640 loan paydown + $5k appreciation (5.3% local appreciation)).
- Delaware County population projected at -11% by 2050 — secular population decline; favor cash flow + early exit over multi-decade hold.
- At projected returns (5.3% appreciation + 3.3% rent growth), your $26k cash investment doubles in ~4 years — after that, you're playing with house money.
- By year 7, paydown + projected appreciation supports a ~$36k cash-out refi (75% LTV) — recoverable capital for the next deal without selling this one.
Negotiation context
- It's been on market 59 days — a 3% lower offer ($90k) is reasonable based on typical stale-listing flexibility.
Risks & watch-outs
- Watch-outs: built in 1952 — expect roof / HVAC / electrical / plumbing capex.
Questions for the listing agent
- It's been on market 59 days. Have you received any prior offers? Is the seller open to a 13% concession, seller financing, or rate buy-down credit?
- Built in 1952 — when were the roof, HVAC, electrical panel, plumbing, and water heater last replaced?
- Is there a deadline driving the sale (1031 exchange, divorce, estate, relocation)? That informs how much negotiation room exists.
- Schools are D-rated, which usually means shorter tenancies and higher turnover. Who's the typical renter profile here, and what's been the actual vacancy rate?
- Crime grade is F in this area — have there been break-ins, vandalism, or insurance claims at this property in the last 3 years? What carrier currently insures it and at what premium?
- What's the average days-on-market for RENTAL listings here right now (not sales)? A rising rental-DOM trend means longer vacancies and softer asking-rent achievability than the comps imply.
- What's the recent tenant-quality profile in this submarket — average credit score on applications, eviction rate, late-payment / NSF rate, and stable-employment percentage? A property-management company in the area should have these aggregated.
- How much new for-sale + rental construction is in the pipeline within 1–3 miles? Heavy new supply typically softens prices + rents 12–24 months out; constrained supply supports both.
Investment metrics
- 1% rule
- 0.87% ✗
- Cap rate
- 7.24%
- Cash-on-cash
- 3.38%
- DSCR
- 1.15
- GRM
- 9.6
CMA / ARV
- ARV (on-the-fly)
- $92,160
- Comps found
- 2
Show comp detail 2 sales within ~0.75 mi
| Address | Dist | Beds/Ba | Sqft | Sold | Price | $/sf | Match |
|---|---|---|---|---|---|---|---|
| 1005 E Jackson St | 0.00mi | 2/1.0 | 720 (0%) | 1mo | $92,500 | $128 | 99 |
| 702 E Kirby Ave | 0.33mi | 2/1.0 | 820 (+14%) | 23mo | $70,000 | $85 | 42 |
Match score weights: distance 35% · size 25% · config 20% · recency 20%. Top-matched comps best support the ARV.
Projected returns pro-forma
5.27% appreciation · 3.27% rent growth · sell at horizon
- IRR
- 16.5%
- Equity multiple
- 2.07×
- Total profit
- $27,603
- Equity at exit
- $53,968
- IRR
- 16.8%
- Equity multiple
- 4.06×
- Total profit
- $79,155
- Equity at exit
- $94,447
Cash invested: $25,900 (down + closing). Projections, not guarantees.
Landlord ↔ Tenant lean methodology
- Overall (STATE)
- 90 Strongly Landlord-Friendly
- State Indiana
- 90 Strongly Landlord-Friendly · R+11
- County
- — inherits STATE
- City
- — inherits STATE
ZIP-level market 47305
- Home prices YoY
- 2.0%
- Rents YoY
- 3.3%
- Active inventory
- 26
- Price-to-rent
- 9.6×
Monthly cashflow live
- Estimated rent
- $804 high interval (Pro) →
- Mortgage (P&I)
- −$485
- Tax from tax record
- −$39 /mo · $468/yr
- Insurance
- −$39
- HOA
- −$0
- Vacancy / Maint / Mgmt
- −$169
- Net cashflow
- $73
Break-even live
UW: 25.0% down · 7.5% · 30yr · 1.5% tax · 5.0% vac · 8.0% maint · 8.0% mgmt
Financing live
Cash to close
- Down payment
- $23,125
- Closing costs
- $2,775
- Reserves months
- —
- Total cash needed
- —
Loan-product check · same deal, 3 products live
Conventional
25% down · 7.5% · 30yr
- Down + closing
- —
- Monthly P&I
- —
- Monthly cashflow
- —
- DSCR
- —
- Eligible?
- —
Personal DTI + credit; lowest rate.
DSCR
20% down · 8.5% · 30yr
- Down + closing
- —
- Monthly P&I
- —
- Monthly cashflow
- —
- DSCR
- —
- Eligible?
- —
No personal income docs; deal must DSCR.
Hard money
10% down · 12.0% · 12mo
- Down + closing
- —
- Monthly P&I
- —
- Monthly cashflow
- —
- DSCR
- —
- Eligible?
- —
Short-term bridge; refi at stabilization.
Rent comps 21 comps
| Address | Beds | Baths | Sqft | Rent | $/sqft | DOM | Units | Dist |
|---|---|---|---|---|---|---|---|---|
| 1521 E Kirby Ave Muncie, IN | 2.0–4.0 | 1.0–2.0 | 972 | $800 | $0.82 | 43d | 2 | 0.46mi |
| 1307 S Ebright St Unit 2 Muncie, IN | 1.0 | 1.0 | 630 | $695 | $1.10 | 43d | 1 | 0.64mi |
| 400 W Washington St Unit 101 Muncie, IN | 1.0 | 1.0 | 700 | $1,050 | $1.50 | 43d | 1 | 0.75mi |
| 401 N Wheeling Ave Muncie, IN | 1.0 | 1.0 | 450 | $650 | $1.44 | 43d | 1 | 0.81mi |
| 522 W Adams St Muncie, IN | 2.0 | 1.0 | 750 | $810 | $1.08 | 43d | 6 | 0.84mi |
| 626 W Main St Muncie, IN | 1.0 | 1.0 | 738 | $715 | $0.97 | 43d | 2 | 0.91mi |
| 520 N Alameda Ave Unit A Muncie, IN | 1.0 | 1.0 | 750 | $895 | $1.19 | 43d | 1 | 0.91mi |
| 1311 E 11th St Unit 2 Muncie, IN | 1.0 | 1.0 | 672 | $715 | $1.06 | 43d | 1 | 0.99mi |
| 907 W Main St Apt 1 Muncie, IN | 2.0 | 1.0 | 750 | $775 | $1.03 | 43d | 1 | 1.05mi |
| 906 W Main St Muncie, IN | 1.0–2.0 | 1.0 | 712 | $995 | $1.40 | 43d | 3 | 1.05mi |
| 415 W 9th St Muncie, IN | 2.0 | 1.0 | 705 | $925 | $1.31 | 43d | 1 | 1.13mi |
| 421 W 9th St Muncie, IN | 1.0 | 1.0 | 672 | $525 | $0.78 | 43d | 1 | 1.14mi |
| 219 W Memorial Dr Muncie, IN | 1.0 | 1.0 | 450 | $600 | $1.33 | 43d | 1 | 1.22mi |
| 824 W Wayne St Muncie, IN | 1.0 | 1.0 | 710 | $795 | $1.12 | 43d | 1 | 1.23mi |
| 920 N Linden St Muncie, IN | 2.0 | 1.0 | 745 | $925 | $1.24 | 43d | 1 | 1.25mi |
| 1609 S Gharkey St Muncie, IN | 2.0 | 1.0 | 744 | $750 | $1.01 | 43d | 1 | 1.27mi |
| 301 W 13th St Muncie, IN | 1.0–2.0 | 1.0 | 725 | $844 | $1.16 | 43d | 1 | 1.30mi |
| 1408 W White River Blvd Muncie, IN | 1.0 | 1.0 | 610 | $938 | $1.54 | 43d | 1 | 1.41mi |
| 1000 W Rex St Unit 1000 Muncie, IN | 1.0 | 1.0 | 480 | $790 | $1.65 | 43d | 1 | 1.44mi |
| 151 E Streeter Ave Unit 2 Bedroom Apartment Muncie, IN | 2.0 | 1.0 | 750 | $692 | $0.92 | 43d | 1 | 1.48mi |
| 1501 W University Ave Muncie, IN | 2.0–3.0 | 1.0 | 794 | $900 | $1.13 | 43d | 1 | 1.50mi |
Listing history 5 events
-
2026-05-01status Pending
-
2026-04-20price $92,500
-
2026-04-09price $95,000
-
2026-03-20price $97,900
-
2026-03-03$99,900 Active
ⓘ Source: listings_history table (triggers on properties + properties_extension) + one-shot
backfill from property_details.listing_events for pre-trigger history.
Tax reassessment forecast IN · Partial reset (capped growth)
- Current annual tax
- $468 · $39/mo
- Projected year-2 tax
- $627 · $52/mo
- Expected delta
- +$159/yr (+$13/mo · 34.0%)
ⓘ Screening estimate from a state-policy table — verify with the county assessor before closing.
Climate risk First Street
- Flood 1/10 Low FEMA zone X (unshaded) · 0% chance over 30 yrs
- Wildfire 1/10 Low
- Heat 3/10 Moderate 7 d/yr ≥100°F today · 18 d/yr by 30 yrs out
- Wind 2/10 Low 0% chance of damaging wind over 30 yrs
- Air quality 3/10 Moderate 2 unhealthy d/yr today · 3 by 30 yrs out
Nearby sold comps map
Loading sold comps map…
Walkable amenities ~0.75 mi
Loading nearby amenities…
Taxation est. · year 1
- Rental income
- $9,654
- − Mortgage interest
- −$5,181
- − Property taxes
- −$468
- − Insurance
- −$462
- − Repairs & maintenance
- −$772
- − Management
- −$772
- − Depreciation
- −$2,691
- Taxable loss
- −$694
- Est. tax savings @ 24.0%
- +$167
- After-tax cash flow
- $1,041/yr
For passive investors: Depreciation is non-cash, so a rental often shows a tax loss while cash-flowing — sheltering income. Rental losses are passive: they offset passive income freely, and up to $25,000/yr can offset ordinary (W-2) income if you actively participate and your MAGI is under $100k (phasing out to $0 by $150k); unused losses carry forward. On sale, claimed depreciation is recaptured at up to 25%, and gains may owe capital-gains tax (a 1031 exchange can defer both). Figures are a year-1 estimate at your 24.0% rate — not tax advice; consult a CPA.
Schools (NCES district)
- District
- Muncie Community Schools
- NCES district ID
- 1807320
- Math proficiency
- 18% ▼ -9.00%
- Reading proficiency
- 25% ▼ -4.00%
- Median HH income
- $30,052
- Composite
- 17.22/100
- National rank
- #9099
- State rank
- #275 of 301 in IN
Livability — Muncie
- Score
- 80/100
- State rank
- #18
- US rank
- #1654
Category grades
Schools grade is shown separately in the Schools card above.
Census & demographics
- Census place
- Muncie, IN
- County
- Delaware County · 84,658 people
- City population
- 84,658
- Metro
- Muncie, IN
- Population (ZIP)
- 3,556
- Household income
- $36,389
- Rent vs Own
- Severe rent burden
- 336.0
Population outlook (Delaware County) Hauer SSP2
- Today (2025)
- 113,036 people
- By 2030
- 111,313 · -1.5%
- By 2040
- 106,432 · -5.8%
- By 2050
- 100,747 · -10.9%
- By 2075
- 91,000 · -19.5%
- By 2100
- 80,687 · -28.6%
Race, ethnicity, and origin ACS 2023
- Neighborhood character
- Diverse neighborhood (Simpson 0.60)
- Race & ethnicity
- White 62% Two or more races 24% Black 8% Hispanic / Latino 7%
- Hispanic origin (detail)
- Mexican 6%
- Common ancestry
- Italian 4% Iranian 1% Lithuanian 1%
- Foreign-born
- 1%
- Languages at home
- 96% English-only · Spanish 2% Arabic 1% Other Asian/Pacific 1%
Political lean MEDSL · Delaware
- 2024 margin
- R (+15.8) · D 41.2% · R 57.0% · Other 1.8%
- 2008→2024 swing
- -30.8pp toward R · 2008: 15.0pp · 2024: -15.8pp
- All cycles
- 2024: R+15.8 2020: R+13.2 2016: R+13.7 2012: D+3.1 2008: D+15.0
Not yet ingested
- Civics
- —
Market trends
- HPI YoY
- ▲ 5.27%
- Current HPI
- 269.888
- Rent YoY
- ▲ 3.27%
- Metro
- Muncie, IN
- State GDP YoY
- ▲ 2.90%
- F500 in state
- 18
Industry mix (Fortune 500 HQ in IN)
| Industry | F500 HQs | Revenue |
|---|---|---|
| Industrial Machinery | 2 | $37B |
|
||
| Healthcare | 1 | $177B |
|
||
| Pharmaceuticals | 1 | $45B |
|
||
| Metals / Steel | 1 | $18B |
|
||
| Agriculture | 1 | $17B |
|
||
| Packaging | 1 | $12B |
|
||
Price history
-7.4% since first listed5 events — show timeline
- 2026-05-01 Pending — MIBOR as Distributed by MLS Grid
- 2026-04-20 Price Changed $92,500 MIBOR as Distributed by MLS Grid
- 2026-04-09 Price Changed $95,000 MIBOR as Distributed by MLS Grid
- 2026-03-20 Price Changed $97,900 MIBOR as Distributed by MLS Grid
- 2026-03-03 Listed $99,900 MIBOR as Distributed by MLS Grid
Property tax history
-8.2%/yrLatest (2024): $468 · +9.9% YoY. Source: county tax records.
Cash-flow waterfall
monthlySold comps — $/sqft
last 12 mo · ≤1 miLoading sold comps…