 🏗️ New Construction
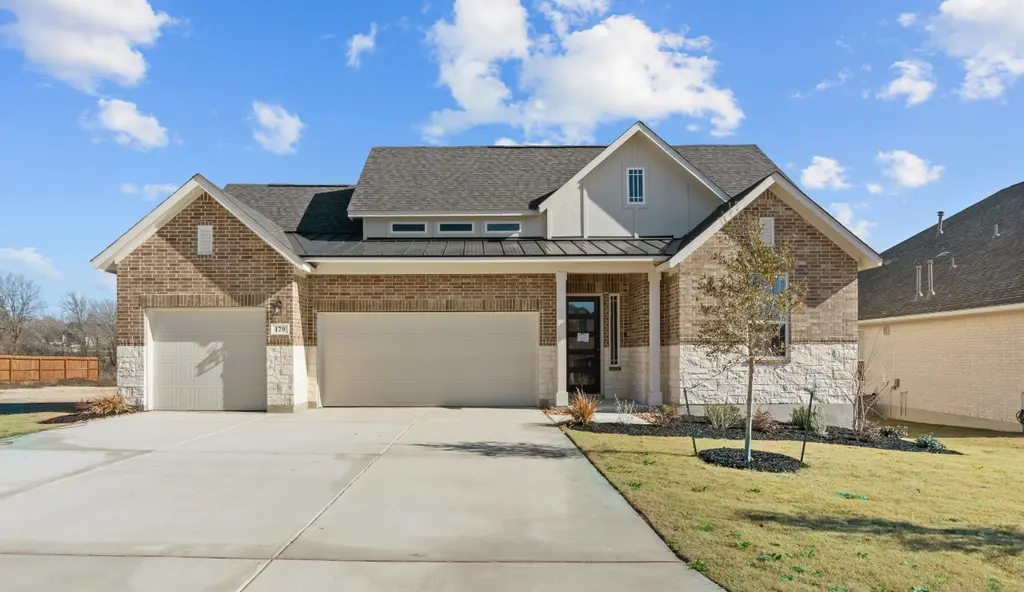
Silas Plan · Castroville, TX
Flood risk 1/10 · Minimal
- FEMA flood zone
- X (unshaded)
- Chance of flooding over 30 yrs
- 0.0%
- Est. flood insurance / yr
- $507 – $1,088
Fire risk 5/10 · Moderate
- Est. fire insurance / yr
- $1,222 – $2,270
Heat risk 7/10 · Major
- Hot days now (above 108°F)
- 6 days/yr
- Hot days in 30 yrs
- 19 days/yr
Wind risk 6/10 · Moderate
- Chance of severe wind over 30 yrs
- 70.0%
Air-quality risk 2/10 · Minimal
- Unhealthy air days now
- 0 days/yr
- Unhealthy air days in 30 yrs
- 1 days/yr
Risk factors via First Street. Map © Google.
Why this score? — see what drove the D+ grade
The composite is a weighted blend of 9 inputs, each scored 0–100. Each bar is that input's sub-score; the figure is the points it added to the 100-point composite (weight × sub-score).
- Cash flow +14.8/30.0
- ARV discount +7.5/15.0
- DSCR +4.5/10.0
- Schools +4.4/10.0
- 1% rule +4.1/10.0
- Condition / age +3.8/5.0
- Livability +3.7/5.0
- Rent growth +2.5/5.0
- Appreciation +0.0/10.0
$521,990
🖨 Deal sheet 📄 Offer letter ✓ Due diligence
Listing remarks
This elegant 4-bedroom, 3.5-bathroom home boasts an open floor plan with a spacious living area, perfect for gatherings. The gourmet kitchen and dedicated study blend style and functionality. Enjoy a luxurious primary suite with a Texas-sized walk-in closet, while a separate Suite Retreat offers its own private sanctuary. Outside, a generous outdoor living space is ideal for entertaining or relaxation.
Key facts
- Open floor plan
- Primary suite
- Gourmet kitchen
Tags
Property features AI
Finance
- Financial info: List price $541,990
Exterior
- Parking: 3 parking spaces
- Home design: New construction plan (Silas)
- Construction: Living area approximately 2986; Built as part of a 2026 plan
- Exterior features: Property located at 112 Grace Ave, Castroville, TX
Interior
- Bedrooms: 4 bedrooms
- Bathrooms: 3 full bathrooms, 1 half bathroom
- Interior features: Open living area (plan: Silas)
Neighborhood map
What this means for you Summary
Snapshot
- This is a 4-bed/3.5-bath single-family listed at $522k. Condition is rated good.
Deal economics
- At list price, monthly cash flow is $175 ($2k/yr) — positive.
- The deal already cash-flows at list — no discount required.
- Meets the 1% rule at list price ($6k rent vs $522k).
- Recommended offer: $506k (3.0% below list) — sets the bar for market timing.
- Cap rate 6.6% vs local median 2.7% in Castroville — top-decile yield for the area; either an underpriced asset or a hidden risk that comps aren't pricing in. Stress-test before assuming the spread holds.
Location & tenants
- Location reads 73/100 on livability (#212 in TX) — a middle-class / working-renter tenant base. Strengths: cost of living A+, housing A+, crime B; Watch: health & safety D+, amenities F, commute F.
- Medina Valley ISD (rural): math 48% / reading 53% proficiency, ranked #148 of 826 in TX (top 18%) — acceptable for families but not a draw, mixed tenant base, ~2y average lease.
- Market conditions: 441 active listings in the ZIP; 4 comparable units currently listed for rent nearby; rentals lingering (median 44d on market — plan ~5-8 weeks vacancy on turnover, expect pricing pressure); 50% of comp listings sitting > 30 days — soft ceiling on asking rent; 102 units permitted in Medina County in 2024 (0 in 5+ unit buildings).
Forward outlook
- Local home prices are declining (-3.0%/yr); year-one equity from $5k of loan paydown is wiped out by about $20k of value loss. Plan a longer hold.
- Medina County population projected at +24% by 2050 — long-run rental-demand tailwind backs the buy-and-hold thesis.
Negotiation context
- It's been on market 34 days — a 3% lower offer ($506k) is reasonable based on typical stale-listing flexibility.
Risks & watch-outs
- Climate carrying-cost: major wind risk, 70% chance of damaging wind over 30y; moderate wildfire risk; extreme-heat days projected 6→19/yr by 2055 (HVAC capex compounding) — expect insurance premiums to compound above CPI over the hold.
Questions for the listing agent
- It's been on market 34 days. Have you received any prior offers? Is the seller open to a 3% concession, seller financing, or rate buy-down credit?
- Is there a deadline driving the sale (1031 exchange, divorce, estate, relocation)? That informs how much negotiation room exists.
- The area grade is low — what's the realistic commute time and amenity access for the typical tenant pool here? Any planned neighborhood developments (good or bad) we should know about?
- What's the average days-on-market for RENTAL listings here right now (not sales)? A rising rental-DOM trend means longer vacancies and softer asking-rent achievability than the comps imply.
- What's the recent tenant-quality profile in this submarket — average credit score on applications, eviction rate, late-payment / NSF rate, and stable-employment percentage? A property-management company in the area should have these aggregated.
- How much new for-sale + rental construction is in the pipeline within 1–3 miles? Heavy new supply typically softens prices + rents 12–24 months out; constrained supply supports both.
Investment metrics
- 1% rule
- 0.91% ✗
- Cap rate
- 6.61%
- Cash-on-cash
- 1.15%
- DSCR
- 1.05
- GRM
- 9.2
CMA / ARV
- ARV (median comp)
- $655,459
- List price
- $521,990
- Delta
- -20.36%
- Verdict
- UNDERPRICED
- Comps
- 20 within 1.0 mi
Show comp detail 12 sales within ~0.75 mi
| Address | Dist | Beds/Ba | Sqft | Sold | Price | $/sf | Match |
|---|---|---|---|---|---|---|---|
| 165 Poe Pkwy | 0.40mi | 4/3.5 | 2,849 (-5%) | 4mo | $599,900 | $211 | 70 |
| 936 County Road 375 | 0.46mi | 3/3.0 (-1) | 3,023 (+1%) | 1mo | $768,000 | $254 | 69 |
| 235 Poe | 0.47mi | 4/3.5 | 3,101 (+4%) | 5mo | $599,900 | $193 | 67 |
| 280 Sittre Dr | 0.63mi | 4/3.5 | 3,003 (+1%) | 4mo | $545,000 | $181 | 66 |
| 117 Poe Pkwy | 0.35mi | 4/3.5 | 2,774 (-7%) | 8mo | $599,990 | $216 | 65 |
| 267 Sweet Rose | 0.71mi | 4/3.5 | 3,094 (+4%) | 1mo | $549,000 | $177 | 60 |
| 250 Matthew Path | 0.47mi | 4/3.5 | 3,325 (+11%) | 1mo | $699,900 | $210 | 58 |
| 172 Landon Path | 0.30mi | 3/2.5 (-1) | 2,730 (-9%) | 6mo | $519,990 | $190 | 58 |
| 229 Raven Rd | 0.64mi | 3/3.5 (-1) | 3,047 (+2%) | 6mo | $761,174 | $250 | 57 |
| 237 Bryant Park | 0.54mi | 4/3.5 | 2,774 (-7%) | 8mo | $569,990 | $205 | 56 |
| 145 Mary Ella Dr | 0.48mi | 4/3.0 | 2,613 (-12%) | 0mo | $625,000 | $239 | 55 |
| 239 Sittre Dr | 0.57mi | 4/3.0 | 3,324 (+11%) | 0mo | $635,000 | $191 | 52 |
Match score weights: distance 35% · size 25% · config 20% · recency 20%. Top-matched comps best support the ARV.
Projected returns pro-forma
-3.0% appreciation · 3.0% rent growth · sell at horizon
- IRR
- -14.5%
- Equity multiple
- 0.48×
- Total profit
- $-94,956
- Equity at exit
- $97,731
- IRR
- -5.7%
- Equity multiple
- 0.63×
- Total profit
- $-67,942
- Equity at exit
- $56,672
Cash invested: $183,529 (down + closing). Projections, not guarantees.
Landlord ↔ Tenant lean methodology
- Overall (STATE)
- 87 Strongly Landlord-Friendly
- State Texas
- 87 Strongly Landlord-Friendly · R+5
- County
- — inherits STATE
- City
- — inherits STATE
ZIP-level market 78009
- Home prices YoY
- -21.1%
- Active inventory
- 441
- Price-to-rent
- 7.3×
Monthly cashflow live
- Estimated rent
- $5,956 medium interval (Pro) →
- Mortgage (P&I)
- −$3,437
- Tax est. 1.5%
- −$819 /mo · $9,832/yr
- Insurance
- −$273
- HOA
- −$0
- Vacancy / Maint / Mgmt
- −$1,251
- Net cashflow
- $175
Break-even live
UW: 25.0% down · 7.5% · 30yr · 1.5% tax · 5.0% vac · 8.0% maint · 8.0% mgmt
Financing live
Cash to close
- Down payment
- $163,865
- Closing costs
- $19,664
- Reserves months
- —
- Total cash needed
- —
Loan-product check · same deal, 3 products live
Conventional
25% down · 7.5% · 30yr
- Down + closing
- —
- Monthly P&I
- —
- Monthly cashflow
- —
- DSCR
- —
- Eligible?
- —
Personal DTI + credit; lowest rate.
DSCR
20% down · 8.5% · 30yr
- Down + closing
- —
- Monthly P&I
- —
- Monthly cashflow
- —
- DSCR
- —
- Eligible?
- —
No personal income docs; deal must DSCR.
Hard money
10% down · 12.0% · 12mo
- Down + closing
- —
- Monthly P&I
- —
- Monthly cashflow
- —
- DSCR
- —
- Eligible?
- —
Short-term bridge; refi at stabilization.
Rent comps 4 comps
| Address | Beds | Baths | Sqft | Rent | $/sqft | DOM | Units | Dist |
|---|---|---|---|---|---|---|---|---|
| 268 Englewood Ln Castroville, TX | 5.0 | 4.5 | 4022 | $7,200 | $1.79 | 4d | 1 | 0.12mi |
| 270 Lilly Blf Castroville, TX | 4.0 | 3.0 | 2958 | $3,600 | $1.22 | 43d | 1 | 0.88mi |
| 252 Elisabeth Run San Antonio, TX | 5.0 | 2.5 | 2614 | $1,995 | $0.76 | 44d | 1 | 1.36mi |
| 206 Nesting Cyn San Antonio, TX | 4.0 | 2.5 | 2492 | $1,741 | $0.70 | 4d | 1 | 1.45mi |
Listing history 14 events
-
2026-06-18days on market $521,990 Active 34 DOM
-
2026-06-17days on market $521,990 Active 33 DOM
-
2026-06-16pricedays on market $521,990 Active 32 DOM
-
2026-06-15days on market $541,990 Active 31 DOM
-
2026-06-13days on market $541,990 Active 29 DOM
-
2026-06-09days on market $541,990 Active 25 DOM
-
2026-06-08days on market $541,990 Active 24 DOM
-
2026-06-07days on market $541,990 Active 23 DOM
-
2026-06-04days on market $541,990 Active 20 DOM
-
2026-06-03days on market $541,990 Active 19 DOM
-
2026-06-02days on market $541,990 Active 18 DOM
-
2026-06-02days on market $541,990 Active 17 DOM
-
2026-05-31days on market $541,990 Active 16 DOM
-
2026-05-15$541,990 Active 405-char remark
ⓘ Source: listings_history table (triggers on properties + properties_extension) + one-shot
backfill from property_details.listing_events for pre-trigger history.
Climate risk First Street
- Flood 1/10 Low FEMA zone X (unshaded) · 0% chance over 30 yrs
- Wildfire 5/10 Major
- Heat 7/10 Severe 6 d/yr ≥108°F today · 19 d/yr by 30 yrs out
- Wind 6/10 Major 70% chance of damaging wind over 30 yrs
- Air quality 2/10 Low 0 unhealthy d/yr today · 1 by 30 yrs out
Nearby sold comps map
Loading sold comps map…
Walkable amenities ~0.75 mi
Loading nearby amenities…
Taxation est. · year 1
- Rental income
- $71,469
- − Mortgage interest
- −$36,716
- − Property taxes
- −$9,832
- − Insurance
- −$3,277
- − Repairs & maintenance
- −$5,718
- − Management
- −$5,718
- − Depreciation
- −$19,068
- Taxable loss
- −$8,859
- Est. tax savings @ 24.0%
- +$2,126
- After-tax cash flow
- $4,230/yr
For passive investors: Depreciation is non-cash, so a rental often shows a tax loss while cash-flowing — sheltering income. Rental losses are passive: they offset passive income freely, and up to $25,000/yr can offset ordinary (W-2) income if you actively participate and your MAGI is under $100k (phasing out to $0 by $150k); unused losses carry forward. On sale, claimed depreciation is recaptured at up to 25%, and gains may owe capital-gains tax (a 1031 exchange can defer both). Figures are a year-1 estimate at your 24.0% rate — not tax advice; consult a CPA.
Condition & rehab AI · 2 photos
This well-maintained single-family home with 4 bedrooms and 3.5 bathrooms is in good condition with minimal repairs needed. Painting the exterior and trimming the landscaping would significantly enhance its curb appeal and value.
Value-add opportunities
- Both Paint exterior — Enhances curb appeal and value
- Both Trim landscaping — Improves curb appeal and enhances property value
Renovation cost estimate screening
Value-add ROI direction
- Both Paint exterior — Enhances curb appeal and value ↑
- Both Trim landscaping — Improves curb appeal and enhances property value ↑
ⓘ Cost ranges are severity-bucket heuristics (US national rule-of-thumb). Get contractor quotes + a written scope before underwriting a rehab budget.
Schools (NCES district)
- District
- Medina Valley ISD
- NCES district ID
- 4830060
- Math proficiency
- 48% ▼ -9.00%
- Reading proficiency
- 53% ▼ -2.00%
- Median HH income
- $60,596
- Composite
- 44.2/100
- National rank
- #2851
- State rank
- #148 of 826 in TX
Livability — Castroville
- Score
- 73/100
- State rank
- #212
- US rank
- #5267
Category grades
Schools grade is shown separately in the Schools card above.
Census & demographics
- Population (ZIP)
- 9,494
Population outlook (Medina County) Hauer SSP2
- Today (2025)
- 54,332 people
- By 2030
- 57,250 · +5.4%
- By 2040
- 62,563 · +15.1%
- By 2050
- 67,386 · +24.0%
- By 2075
- 79,538 · +46.4%
- By 2100
- 84,624 · +55.8%
Race, ethnicity, and origin ACS 2023
- Neighborhood character
- Diverse neighborhood (Simpson 0.60)
- Race & ethnicity
- Hispanic / Latino 52% White 37% Two or more races 29% Black 4% Asian 3% Native American 1%
- Hispanic origin (detail)
- Mexican 41% Puerto Rican 3%
- Common ancestry
- Albanian 6% Lithuanian 5% Slovak 2%
- Foreign-born
- 9% · Canada
- Languages at home
- 74% English-only · Spanish 24% Other Indo-European 1%
Political lean MEDSL · Medina
- 2024 margin
- Solid R (+42.8) · D 28.2% · R 71.0%
- 2008→2024 swing
- -8.9pp toward R · 2008: -33.9pp · 2024: -42.8pp
- All cycles
- 2024: R+42.8 2020: R+39.2 2016: R+43.2 2012: R+39.2 2008: R+33.9
Not yet ingested
- Civics
- —
Market trends
- HPI YoY
- ▼ -56.81%
- Current HPI
- 212.1813
- Rent YoY
- —
- Metro
- —
- State GDP YoY
- ▲ 3.95%
- F500 in state
- 110
Industry mix (Fortune 500 HQ in TX)
| Industry | F500 HQs | Revenue |
|---|---|---|
| Energy | 16 | $1,198B |
|
||
| Technology | 5 | $198B |
|
||
| Engineering / Construction | 4 | $72B |
|
||
| Energy Services | 3 | $60B |
|
||
| Utilities | 3 | $41B |
|
||
| Healthcare | 2 | $330B |
|
||
Cash-flow waterfall
monthlySold comps — $/sqft
last 12 mo · ≤1 miLoading sold comps…