 Multi-family
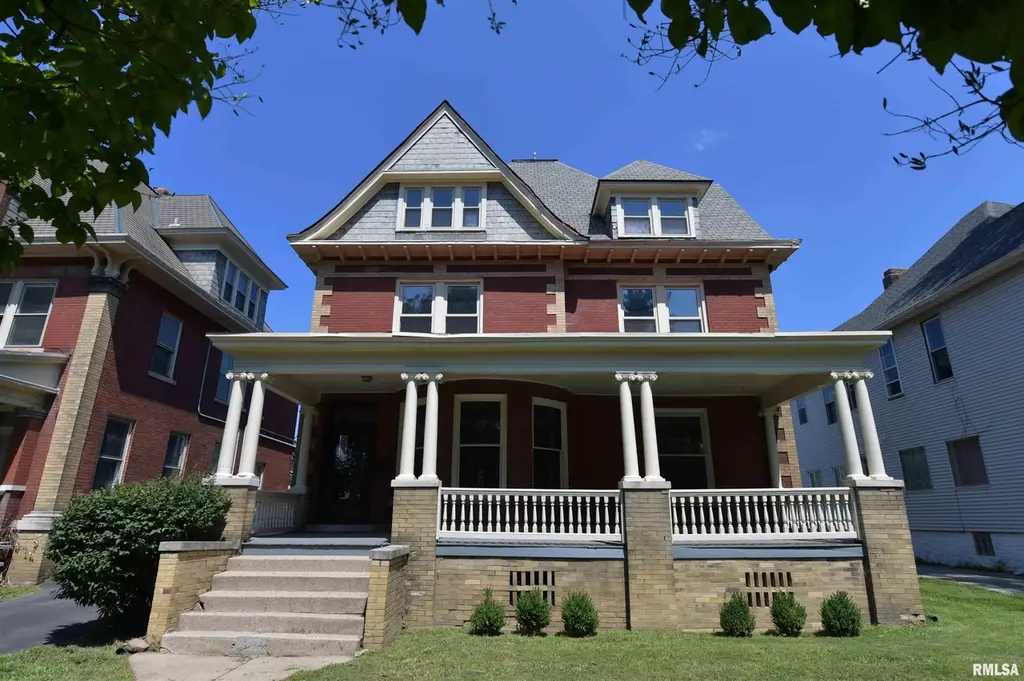
919 W Moss Ave · Peoria, IL
Flood risk 1/10 · Minimal
- FEMA flood zone
- X
- Chance of flooding over 30 yrs
- 0.0%
- Est. flood insurance / yr
- $473 – $860
Fire risk 1/10 · Minimal
- Est. fire insurance / yr
- $804 – $1,492
Heat risk 3/10 · Minor
- Hot days now (above 105°F)
- 7 days/yr
- Hot days in 30 yrs
- 18 days/yr
Wind risk 2/10 · Minimal
- Chance of severe wind over 30 yrs
- 1.0%
Air-quality risk 3/10 · Minor
- Unhealthy air days now
- 1 days/yr
- Unhealthy air days in 30 yrs
- 3 days/yr
Risk factors via First Street. Map © Google.
Why this score? — see what drove the F grade
The composite is a weighted blend of 9 inputs, each scored 0–100. Each bar is that input's sub-score; the figure is the points it added to the 100-point composite (weight × sub-score).
- Livability +3.7/5.0
- Cash flow +3.0/30.0
- Rent growth +2.5/5.0
- Condition / age +2.5/5.0
- Schools +1.1/10.0
- 1% rule +0.0/10.0
- DSCR +0.0/10.0
- ARV discount +0.0/15.0
- Appreciation +0.0/10.0
$349,900
🖨 Deal sheet 📄 Offer letter ✓ Due diligence
Multi-family units
County records classify this as Multi-Family (2-4 Unit). Listing-text estimate: 1 unit. estimate disagrees with records
Listing remarks MLS
Historic Gem in the heart of Moss Ave's mature tree lines street. This property has the option of being a single family with extra room on the 3rd floor, a single family with a 3rd floor entirely separate rental or investment property with 2 incomes. Historic woodwork and charm show from the moment you walk onto the covered front porch. Hardwood floors and woodwork are original with pocket doors and stained-glass windows! So much potential to make changes to suit your style or keep as-is. Entry way opens to a formal staircase, living room with fireplace and dining room. Kitchen and walk through pantry! 4 bedrooms with 2 baths on the 2nd floor. Exterior access to 3rd floor with 2 bed/2 bath apartment. Interior access could be returned as well. See also MLS PA1260509
Key facts
- 7,840 sq ft lot
- 2 garage spots
- Built 1900
Neighborhood map
What this means for you Summary
Snapshot
- This is a 4-bed/2.5-bath multifamily listed at $350k.
Deal economics
- At list price, monthly cash flow is $-1k ($-14k/yr) — negative.
- To cash-flow at today's rent, offer at most $150k (57.0% below list).
- To meet the 1% rule (rent ≥ 1% of price), the offer needs to be $149k (57.3% below list).
- Recommended offer: $149k (57.3% below list) — sets the bar for 1% rule.
- Cap rate 2.4% vs local median 5.6% in Peoria — below-typical yield; the buyer is paying a premium for something (appreciation thesis, condition, location) that the cap rate doesn't capture.
Location & tenants
- Location reads 73/100 on livability (#270 in IL) — a middle-class / working-renter tenant base. Strengths: commute A+, cost of living A+, housing A+; Watch: employment D+, schools F, crime F.
- Peoria SD 150 (urban): math 11% / reading 14% proficiency, ranked #554 of 620 in IL (top 89%) — low school quality limits family demand, transient renter base, plan for 1-2y turnover; 70% free/reduced lunch — lower-income household profile, screen leases tightly.
- Market conditions: 33 active listings in the ZIP; 1 comparable units currently listed for rent nearby; lower-income renter base — watch delinquency; 73 units permitted in Peoria County in 2024 (0 in 5+ unit buildings).
- At $1,494/mo this rent would consume 46% of the median local household income ($39k/yr) (locally 620% of renters already pay >50% of income on rent) — very limited rent-growth headroom before tenants either downsize or default.
Forward outlook
- Local home prices are declining (-3.0%/yr); year-one equity from $2k of loan paydown is wiped out by about $10k of value loss. Plan a longer hold.
- Peoria County population projected at -11% by 2050 — secular population decline; favor cash flow + early exit over multi-decade hold.
Negotiation context
- It's been on market 73 days — a 6% lower offer ($329k) is reasonable based on typical stale-listing flexibility.
- 8 sale attempts since 3y ago; this cycle's ask has dropped $25k (7%) from the opening price — seller is motivated, your offer sets the floor, not the list.
Risks & watch-outs
- Watch-outs: built in 1900 — expect roof / HVAC / electrical / plumbing capex.
Questions for the listing agent
- What do current leases actually rent for vs. the listed asking? Can we see a recent rent roll and the last 12 months of T-12 income?
- It's been on market 73 days. Have you received any prior offers? Is the seller open to a 57% concession, seller financing, or rate buy-down credit?
- Built in 1900 — when were the roof, HVAC, electrical panel, plumbing, and water heater last replaced?
- Why hasn't it sold? Are there any deal-killer items the seller is aware of (foundation, flood, title, zoning, code violations)?
- Is there a deadline driving the sale (1031 exchange, divorce, estate, relocation)? That informs how much negotiation room exists.
- Schools are F-rated, which usually means shorter tenancies and higher turnover. Who's the typical renter profile here, and what's been the actual vacancy rate?
- Crime grade is F in this area — have there been break-ins, vandalism, or insurance claims at this property in the last 3 years? What carrier currently insures it and at what premium?
- The area grade is low — what's the realistic commute time and amenity access for the typical tenant pool here? Any planned neighborhood developments (good or bad) we should know about?
- What's the average days-on-market for RENTAL listings here right now (not sales)? A rising rental-DOM trend means longer vacancies and softer asking-rent achievability than the comps imply.
- What's the recent tenant-quality profile in this submarket — average credit score on applications, eviction rate, late-payment / NSF rate, and stable-employment percentage? A property-management company in the area should have these aggregated.
- How much new apartment / multifamily construction is in the pipeline within 1–3 miles? Heavy new supply (>2% of stock underway) typically softens rents 12–24 months out; light construction supports rent growth.
Investment metrics
- 1% rule
- 0.43% ✗
- Cap rate
- 2.42%
- Cash-on-cash
- -13.84%
- DSCR
- 0.38
- GRM
- 19.5
CMA / ARV
- ARV (median comp)
- $269,427
- List price
- $349,900
- Delta
- 29.87%
- Verdict
- OVERPRICED
- Comps
- 20 within 1.0 mi
Show comp detail 5 sales within ~0.75 mi
| Address | Dist | Beds/Ba | Sqft | Sold | Price | $/sf | Match |
|---|---|---|---|---|---|---|---|
| 1001 W Moss Ave | 0.01mi | 5/5.0 (+1) | 3,250 (+1%) | 10mo | $380,000 | $117 | 75 |
| 417 Columbia Ter | 0.69mi | 5/3.0 (+1) | 3,204 (-1%) | 11mo | $85,000 | $27 | 51 |
| 1104-1106 N Ellis St | 0.50mi | 4/2.0 | 2,767 (-14%) | 9mo | $150,000 | $54 | 43 |
| 616 N Cooper St | 0.59mi | 4/2.0 | 2,916 (-10%) | 18mo | $160,000 | $55 | 39 |
| 1311 N Flora Ave | 0.67mi | 4/4.0 | 3,668 (+14%) | 18mo | $170,000 | $46 | 25 |
Match score weights: distance 35% · size 25% · config 20% · recency 20%. Top-matched comps best support the ARV.
Projected returns pro-forma
-3.0% appreciation · 3.0% rent growth · sell at horizon
- IRR
- -42.5%
- Equity multiple
- -0.31×
- Total profit
- $-128,698
- Equity at exit
- $52,171
- IRR
- -73.1%
- Equity multiple
- -1.09×
- Total profit
- $-204,901
- Equity at exit
- $30,253
Cash invested: $97,972 (down + closing). Projections, not guarantees.
Landlord ↔ Tenant lean methodology
- Overall (STATE)
- 43 Moderately Tenant-Leaning
- State Illinois
- 43 Moderately Tenant-Leaning · D+7
- County
- — inherits STATE
- City
- — inherits STATE
ZIP-level market 61606
- Home prices YoY
- -34.0%
- Active inventory
- 33
- Price-to-rent
- 19.5×
Monthly cashflow live
- Estimated rent
- $1,494 medium interval (Pro) →
- Mortgage (P&I)
- −$1,835
- Tax from tax record
- −$329 /mo · $3,948/yr
- Insurance
- −$146
- HOA
- −$0
- Vacancy / Maint / Mgmt
- −$314
- Net cashflow
- $-1,130
Break-even live
UW: 25.0% down · 7.5% · 30yr · 1.5% tax · 5.0% vac · 8.0% maint · 8.0% mgmt
Financing live
Cash to close
- Down payment
- $87,475
- Closing costs
- $10,497
- Reserves months
- —
- Total cash needed
- —
Loan-product check · same deal, 3 products live
Conventional
25% down · 7.5% · 30yr
- Down + closing
- —
- Monthly P&I
- —
- Monthly cashflow
- —
- DSCR
- —
- Eligible?
- —
Personal DTI + credit; lowest rate.
DSCR
20% down · 8.5% · 30yr
- Down + closing
- —
- Monthly P&I
- —
- Monthly cashflow
- —
- DSCR
- —
- Eligible?
- —
No personal income docs; deal must DSCR.
Hard money
10% down · 12.0% · 12mo
- Down + closing
- —
- Monthly P&I
- —
- Monthly cashflow
- —
- DSCR
- —
- Eligible?
- —
Short-term bridge; refi at stabilization.
Rent comps 1 comps
| Address | Beds | Baths | Sqft | Rent | $/sqft | DOM | Units | Dist |
|---|---|---|---|---|---|---|---|---|
| 1613 W Kettelle St Peoria, IL | 3.0 | 1.0 | 4404 | $800 | $0.18 | 13d | 1 | 0.91mi |
Listing history 34 events
-
2026-06-19days on market $349,900 Active 73 DOM
-
2026-06-18days on market $349,900 Active 72 DOM
-
2026-06-17days on market $349,900 Active 71 DOM
-
2026-06-16days on market $349,900 Active 70 DOM
-
2026-06-15days on market $349,900 Active 69 DOM
-
2026-06-14days on market $349,900 Active 67 DOM
-
2026-06-13days on market $349,900 Active 66 DOM
-
2026-06-10days on market $349,900 Active 64 DOM
-
2026-06-09days on market $349,900 Active 63 DOM
-
2026-06-08days on market $349,900 Active 62 DOM
-
2026-06-07days on market $349,900 Active 61 DOM
-
2026-06-03days on market $349,900 Active 57 DOM
-
2026-06-02days on market $349,900 Active 56 DOM
-
2026-06-01days on market $349,900 Active 55 DOM
-
2026-05-31days on market $349,900 Active 54 DOM
-
2026-05-30days on market $349,900 Active 53 DOM
-
2026-05-04price $349,900 784-char remark
Show marketing remark (784 chars)
Historic Gem in the heart of Moss Ave's mature tree lines street. This property has the option of being a single family with extra room on the 3rd floor, a single family with a 3rd floor entirely separate rental or investment property with 2 incomes. Historic woodwork and charm show from the moment you walk onto the covered front porch. Hardwood floors and woodwork are original with pocket doors and stained-glass windows! So much potential to make changes to suit your style or keep as-is. Entry way opens to a formal staircase, living room with fireplace and dining room. Kitchen and walk through pantry! 4 bedrooms with 2 baths on the 2nd floor. Exterior access to 3rd floor with 2 bed/2 bath apartment. Interior access could be returned as well. See also MLS PA1260509
-
2026-04-07$374,900 Active 784-char remark
Show marketing remark (784 chars)
Historic Gem in the heart of Moss Ave's mature tree lines street. This property has the option of being a single family with extra room on the 3rd floor, a single family with a 3rd floor entirely separate rental or investment property with 2 incomes. Historic woodwork and charm show from the moment you walk onto the covered front porch. Hardwood floors and woodwork are original with pocket doors and stained-glass windows! So much potential to make changes to suit your style or keep as-is. Entry way opens to a formal staircase, living room with fireplace and dining room. Kitchen and walk through pantry! 4 bedrooms with 2 baths on the 2nd floor. Exterior access to 3rd floor with 2 bed/2 bath apartment. Interior access could be returned as well. See also MLS PA1260509
-
2026-04-06historical
-
2026-04-06historical
-
2026-02-03price
-
2026-02-03price
-
2025-08-27Active
-
2025-08-05Active
-
2025-07-02historical
-
2025-01-31Active
-
2025-01-15historical
-
2024-10-11Active
-
2024-10-03historical
-
2024-07-02Active
-
2024-06-29historical
-
2024-04-02historical
-
2024-04-02Active
-
2023-12-07Active
ⓘ Source: listings_history table (triggers on properties + properties_extension) + one-shot
backfill from property_details.listing_events for pre-trigger history.
Tax reassessment forecast IL · Partial reset (capped growth)
- Current annual tax
- $3,948 · $329/mo
- Projected year-2 tax
- $5,945 · $495/mo
- Expected delta
- +$1,997/yr (+$166/mo · 50.6%)
ⓘ Screening estimate from a state-policy table — verify with the county assessor before closing.
Climate risk First Street
- Flood 1/10 Low FEMA zone X · 0% chance over 30 yrs
- Wildfire 1/10 Low
- Heat 3/10 Moderate 7 d/yr ≥105°F today · 18 d/yr by 30 yrs out
- Wind 2/10 Low 100% chance of damaging wind over 30 yrs
- Air quality 3/10 Moderate 1 unhealthy d/yr today · 3 by 30 yrs out
Nearby sold comps map
Loading sold comps map…
Walkable amenities ~0.75 mi
Loading nearby amenities…
Taxation est. · year 1
- Rental income
- $17,923
- − Mortgage interest
- −$19,600
- − Property taxes
- −$3,948
- − Insurance
- −$1,750
- − Repairs & maintenance
- −$1,434
- − Management
- −$1,434
- − Depreciation
- −$10,179
- Taxable loss
- −$20,421
- Est. tax savings @ 24.0%
- +$4,901
- After-tax cash flow
- $-8,656/yr
For passive investors: Depreciation is non-cash, so a rental often shows a tax loss while cash-flowing — sheltering income. Rental losses are passive: they offset passive income freely, and up to $25,000/yr can offset ordinary (W-2) income if you actively participate and your MAGI is under $100k (phasing out to $0 by $150k); unused losses carry forward. On sale, claimed depreciation is recaptured at up to 25%, and gains may owe capital-gains tax (a 1031 exchange can defer both). Figures are a year-1 estimate at your 24.0% rate — not tax advice; consult a CPA.
Schools (NCES district)
- District
- Peoria SD 150
- NCES district ID
- 1731230
- Math proficiency
- 11% ▼ -5.00%
- Reading proficiency
- 14% ▼ -4.00%
- Median HH income
- $41,951
- Composite
- 10.92/100
- National rank
- #9751
- State rank
- #554 of 620 in IL
Livability — Peoria
- Score
- 73/100
- State rank
- #270
- US rank
- #5096
Category grades
Schools grade is shown separately in the Schools card above.
Census & demographics
- Census place
- Peoria, IL
- County
- Peoria County · 120,495 people
- City population
- 114,670
- Metro
- Peoria, IL
- Population (ZIP)
- 6,684
- Household income
- $39,196
- Rent vs Own
- Severe rent burden
- 620.0
Population outlook (Peoria County) Hauer SSP2
- Today (2025)
- 183,007 people
- By 2030
- 179,643 · -1.8%
- By 2040
- 171,782 · -6.1%
- By 2050
- 163,508 · -10.7%
- By 2075
- 140,178 · -23.4%
- By 2100
- 114,493 · -37.4%
Race, ethnicity, and origin ACS 2023
- Neighborhood character
- Predominantly White (66%)
- Race & ethnicity
- White 66% Black 17% Two or more races 9% Hispanic / Latino 8% Asian 3%
- Hispanic origin (detail)
- Mexican 6%
- Common ancestry
- Romanian 4% Slovak 2% Lithuanian 2%
- Foreign-born
- 4% · Vietnam, Canada
- Languages at home
- 94% English-only · Spanish 3% Other Indo-European 1% Chinese 1%
Political lean MEDSL · Peoria
- 2024 margin
- Toss-up / Even · D 51.5% · R 46.9% · Other 1.6%
- 2008→2024 swing
- -9.2pp toward R · 2008: 13.9pp · 2024: 4.7pp
- All cycles
- 2024: D+4.7 2020: D+6.3 2016: D+2.8 2012: D+4.4 2008: D+13.9
Not yet ingested
- Civics
- —
Market trends
- HPI YoY
- ▼ -85.67%
- Current HPI
- 166.329
- Rent YoY
- —
- Metro
- Peoria, IL
- State GDP YoY
- ▲ 1.59%
- F500 in state
- 60
Industry mix (Fortune 500 HQ in IL)
| Industry | F500 HQs | Revenue |
|---|---|---|
| Insurance | 4 | $201B |
|
||
| Consumer Goods | 4 | $87B |
|
||
| Industrial Machinery | 3 | $64B |
|
||
| Healthcare | 2 | $55B |
|
||
| Retail / Pharmacy | 1 | $148B |
|
||
| Agriculture / Food | 1 | $86B |
|
||
Price history
-6.7% since first listed18 events — show timeline
- 2026-05-04 Price Changed $349,900 RMLSA as Distributed by MLS Grid
- 2026-04-07 Listed $374,900 RMLSA as Distributed by MLS Grid
- 2026-04-06 Listing Removed — RMLSA as Distributed by MLS Grid
- 2026-04-06 Listing Removed — RMLSA as Distributed by MLS Grid
- 2026-02-03 Price Changed — RMLSA as Distributed by MLS Grid
- 2026-02-03 Price Changed — RMLSA as Distributed by MLS Grid
- 2025-08-27 Listed — RMLSA as Distributed by MLS Grid
- 2025-08-05 Listed — RMLSA as Distributed by MLS Grid
- 2025-07-02 Listing Removed — RMLSA as Distributed by MLS Grid
- 2025-01-31 Listed — RMLSA as Distributed by MLS Grid
- 2025-01-15 Listing Removed — RMLSA as Distributed by MLS Grid
- 2024-10-11 Listed — RMLSA as Distributed by MLS Grid
- 2024-10-03 Listing Removed — RMLSA as Distributed by MLS Grid
- 2024-07-02 Listed — RMLSA as Distributed by MLS Grid
- 2024-06-29 Listing Removed — RMLSA as Distributed by MLS Grid
- 2024-04-02 Listing Removed — RMLSA as Distributed by MLS Grid
- 2024-04-02 Listed — RMLSA as Distributed by MLS Grid
- 2023-12-07 Listed — RMLSA as Distributed by MLS Grid
Property tax history
+1.6%/yrLatest (2024): $3,948 · +4.8% YoY. Source: county tax records.
Cash-flow waterfall
monthlySold comps — $/sqft
last 12 mo · ≤1 miLoading sold comps…