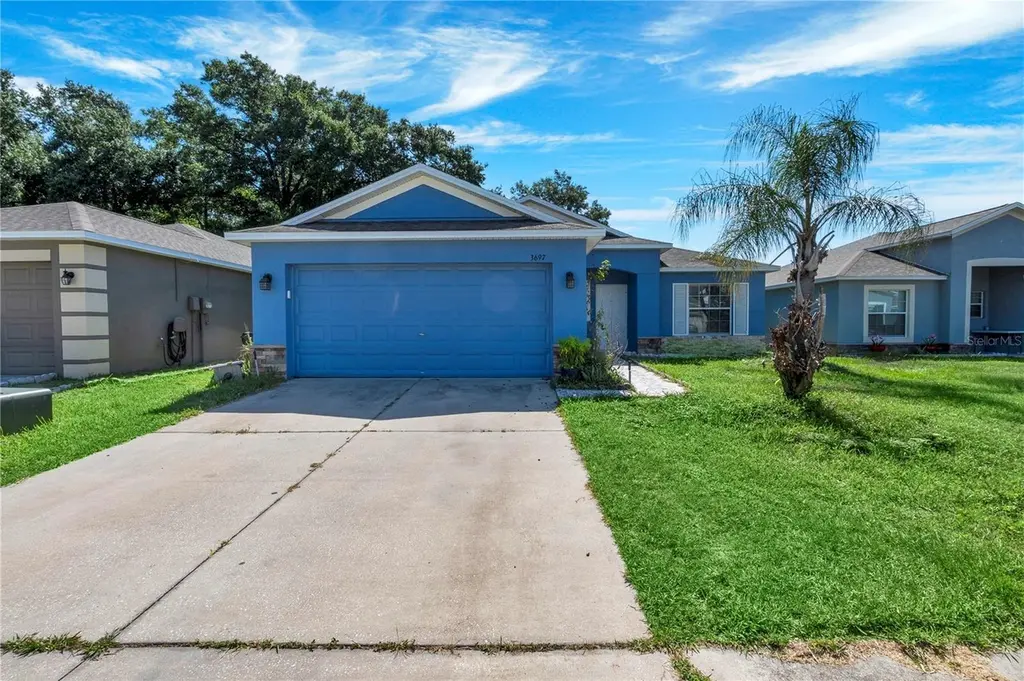
3697 Madbury Cir · Lakeland, FL
Flood risk No data
- FEMA flood zone
- —
- Chance of flooding over 30 yrs
- %
- Est. flood insurance / yr
- —
Fire risk No data
- Est. fire insurance / yr
- —
Heat risk No data
- Hot days now (above °F)
- days/yr
- Hot days in 30 yrs
- days/yr
Wind risk No data
- Chance of severe wind over 30 yrs
- %
Air-quality risk No data
- Unhealthy air days now
- days/yr
- Unhealthy air days in 30 yrs
- days/yr
Risk factors via First Street. Map © Google.
Why this score? — see what drove the D grade
The composite is a weighted blend of 9 inputs, each scored 0–100. Each bar is that input's sub-score; the figure is the points it added to the 100-point composite (weight × sub-score).
- Cash flow +12.2/30.0
- ARV discount +7.5/15.0
- 1% rule +3.9/10.0
- Livability +3.9/5.0
- DSCR +3.6/10.0
- Schools +3.5/10.0
- Rent growth +3.2/5.0
- Condition / age +2.5/5.0
- Appreciation +0.0/10.0
$250,000
🖨 Deal sheet 📄 Offer letter ✓ Due diligence
Listing remarks
Welcome to this 4-bedroom, 2-bath home located in the desirable Hampton Hills community of North Lakeland. Offering a spacious and functional layout, this home is designed for both comfortable everyday living and effortless entertaining. The open-concept floor plan features generous living and dining spaces that flow seamlessly into the kitchen, creating the perfect gathering place for family and friends. The split-bedroom design provides added privacy, with a spacious primary suite offering a relaxing retreat at the end of the day. The additional bedrooms are well-sized and versatile, making them ideal for family members, guests, a home office, or hobby space. Step outside to enjoy the scr
Key facts
- Screened lanai
- Backyard
- Nearby lakes
Tags
Neighborhood map
What this means for you Summary
Snapshot
- This is a 4-bed/2.0-bath single-family listed at $250k.
Deal economics
- At list price, monthly cash flow is $-49 ($-584/yr) — negative.
- To cash-flow at today's rent, offer at most $243k (2.8% below list).
- To meet the 1% rule (rent ≥ 1% of price), the offer needs to be $223k (10.8% below list).
- Recommended offer: $223k (10.8% below list) — sets the bar for 1% rule.
Location & tenants
- Location reads 77/100 on livability (#206 in FL, #3,179 nationally) — a middle-class / working-renter tenant base. Strengths: cost of living A+, housing A+, health & safety A+; Watch: employment D+, amenities F, commute F.
- Polk (suburban): math 39% / reading 43% proficiency, ranked #62 of 73 in FL (top 85%) — families likely to look elsewhere, expect single-tenant / working-renter base with shorter leases.
- Market conditions: Rents rising (+2.8%/yr); 504 active listings in the ZIP; 17 comparable units currently listed for rent nearby; rentals at typical pace (median 14d on market — plan ~3-4 weeks tenant-placement turnaround); 10,384 units permitted in Polk County in 2024 (1,716 in 5+ unit buildings).
- This rent runs 38% of the median local income ($70k/yr) — at the standard rent-burdened threshold; future hikes will face affordability resistance.
Forward outlook
- Local home prices are declining (-3.0%/yr); year-one equity from $2k of loan paydown is wiped out by about $8k of value loss. Plan a longer hold.
- Polk County population projected at +33% by 2050 — long-run rental-demand tailwind backs the buy-and-hold thesis.
Negotiation context
- Only 1 days on market — expect competitive offers; lowballing is unlikely to land.
Questions for the listing agent
- What do current leases actually rent for vs. the listed asking? Can we see a recent rent roll and the last 12 months of T-12 income?
- What does the HOA fee cover, when was the last increase, and are there any pending special assessments or reserve-fund shortfalls?
- Is there a deadline driving the sale (1031 exchange, divorce, estate, relocation)? That informs how much negotiation room exists.
- The area grade is low — what's the realistic commute time and amenity access for the typical tenant pool here? Any planned neighborhood developments (good or bad) we should know about?
- What's the average days-on-market for RENTAL listings here right now (not sales)? A rising rental-DOM trend means longer vacancies and softer asking-rent achievability than the comps imply.
- What's the recent tenant-quality profile in this submarket — average credit score on applications, eviction rate, late-payment / NSF rate, and stable-employment percentage? A property-management company in the area should have these aggregated.
- How much new for-sale + rental construction is in the pipeline within 1–3 miles? Heavy new supply typically softens prices + rents 12–24 months out; constrained supply supports both.
Investment metrics
- 1% rule
- 0.89% ✗
- Cap rate
- 6.06%
- Cash-on-cash
- -0.83%
- DSCR
- 0.96
- GRM
- 9.3
CMA / ARV
No comps found within radius.
Projected returns pro-forma
-3.0% appreciation · 2.78% rent growth · sell at horizon
- IRR
- -17.9%
- Equity multiple
- 0.37×
- Total profit
- $-44,018
- Equity at exit
- $37,276
- IRR
- -10.4%
- Equity multiple
- 0.37×
- Total profit
- $-43,989
- Equity at exit
- $21,615
Cash invested: $70,000 (down + closing). Projections, not guarantees.
Landlord ↔ Tenant lean methodology
- Overall (STATE)
- 87 Strongly Landlord-Friendly
- State Florida
- 87 Strongly Landlord-Friendly · R+3
- County
- — inherits STATE
- City
- — inherits STATE
ZIP-level market 33810
- Rents YoY
- 2.8%
- Active inventory
- 504
- Price-to-rent
- 9.3×
Monthly cashflow live
- Estimated rent
- $2,230 high interval (Pro) →
- Mortgage (P&I)
- −$1,311
- Tax est. 1.5%
- −$312 /mo · $3,750/yr
- Insurance
- −$104
- HOA
- −$83
- Vacancy / Maint / Mgmt
- −$468
- Net cashflow
- $-49
Break-even live
UW: 25.0% down · 7.5% · 30yr · 1.5% tax · 5.0% vac · 8.0% maint · 8.0% mgmt
Financing live
Cash to close
- Down payment
- $62,500
- Closing costs
- $7,500
- Reserves months
- —
- Total cash needed
- —
Loan-product check · same deal, 3 products live
Conventional
25% down · 7.5% · 30yr
- Down + closing
- —
- Monthly P&I
- —
- Monthly cashflow
- —
- DSCR
- —
- Eligible?
- —
Personal DTI + credit; lowest rate.
DSCR
20% down · 8.5% · 30yr
- Down + closing
- —
- Monthly P&I
- —
- Monthly cashflow
- —
- DSCR
- —
- Eligible?
- —
No personal income docs; deal must DSCR.
Hard money
10% down · 12.0% · 12mo
- Down + closing
- —
- Monthly P&I
- —
- Monthly cashflow
- —
- DSCR
- —
- Eligible?
- —
Short-term bridge; refi at stabilization.
Rent comps 17 comps
| Address | Beds | Baths | Sqft | Rent | $/sqft | DOM | Units | Dist |
|---|---|---|---|---|---|---|---|---|
| 3852 Hampton Hills Dr Lakeland, FL | 3.0 | 2.0 | 1861 | $1,950 | $1.05 | 10d | 1 | 0.21mi |
| 1845 Holton Rd Lakeland, FL | 4.0 | 2.5 | 1811 | $1,983 | $1.09 | 21d | 1 | 0.30mi |
| 3697 Hampton Hills Dr Lakeland, FL | 4.0 | 2.0 | 1746 | $2,150 | $1.23 | 23d | 1 | 0.42mi |
| 1906 Griffin Rd Lakeland, FL | 1.0–3.0 | 1.0–2.0 | 1148 | $2,339 | $2.04 | 3d | 11 | 0.44mi |
| 4111 Solamor St Lakeland, FL | 3.0 | 2.0 | 1619 | $2,400 | $1.48 | 14d | 1 | 0.53mi |
| 3842 Hampstead Ln Lakeland, FL | 3.0 | 2.5 | 1633 | $1,800 | $1.10 | 13d | 1 | 0.54mi |
| 3824 Exeter Ln Lakeland, FL | 3.0 | 2.5 | 1771 | $1,795 | $1.01 | 2d | 1 | 0.57mi |
| 3867 Hampstead Ln Lakeland, FL | 3.0 | 2.5 | 1633 | $1,795 | $1.10 | 3d | 1 | 0.58mi |
| 3805 Exeter Ln Lakeland, FL | 3.0 | 2.5 | 1771 | $1,900 | $1.07 | 14d | 1 | 0.60mi |
| 4083 Dover Terrace Dr Unit 4083 Lakeland, FL | 3.0 | 2.5 | 1771 | $1,975 | $1.12 | 23d | 1 | 0.70mi |
| 1754 Altavista Cir Lakeland, FL | 3.0 | 2.0 | 2082 | $2,450 | $1.18 | 13d | 1 | 0.79mi |
| 4240 Summer Landing Dr Lakeland, FL | 2.0–3.0 | 2.0 | 1083 | $1,700 | $1.57 | 13d | 2 | 0.93mi |
| 1545 Kennedy Blvd Lakeland, FL | 1.0–3.0 | 1.0–2.0 | 997 | $1,992 | $2.00 | 2d | 24 | 0.95mi |
| 4500 Williamstown Blvd Lakeland, FL | 3.0 | 1.0–2.0 | 1062 | $1,833 | $1.73 | 23d | 1 | 1.06mi |
| 3987 Sunset Lake Dr Lakeland, FL | 4.0 | 3.0 | 2223 | $4,500 | $2.02 | 14d | 1 | 1.10mi |
| 1510 Galloway Oaks Dr Lakeland, FL | 2.0–3.0 | 2.0 | 1066 | $1,699 | $1.59 | 21d | 8 | 1.15mi |
| 1211 Robert King High Dr Lakeland, FL | 3.0 | 1.5 | 1050 | $1,625 | $1.55 | 23d | 1 | 1.32mi |
HOA detail
- Monthly dues
- $83 · $996/yr
Listing history 2 events
-
2026-06-18remarks 699-char remark
-
2026-06-18$250,000 Active 1 DOM
ⓘ Source: listings_history table (triggers on properties + properties_extension) + one-shot
backfill from property_details.listing_events for pre-trigger history.
Nearby sold comps map
Loading sold comps map…
Walkable amenities ~0.75 mi
Loading nearby amenities…
Taxation est. · year 1
- Rental income
- $26,765
- − Mortgage interest
- −$14,004
- − Property taxes
- −$3,750
- − Insurance
- −$1,250
- − Repairs & maintenance
- −$2,141
- − Management
- −$2,141
- − HOA
- −$996
- − Depreciation
- −$7,273
- Taxable loss
- −$4,790
- Est. tax savings @ 24.0%
- +$1,150
- After-tax cash flow
- $566/yr
For passive investors: Depreciation is non-cash, so a rental often shows a tax loss while cash-flowing — sheltering income. Rental losses are passive: they offset passive income freely, and up to $25,000/yr can offset ordinary (W-2) income if you actively participate and your MAGI is under $100k (phasing out to $0 by $150k); unused losses carry forward. On sale, claimed depreciation is recaptured at up to 25%, and gains may owe capital-gains tax (a 1031 exchange can defer both). Figures are a year-1 estimate at your 24.0% rate — not tax advice; consult a CPA.
Schools (NCES district)
- District
- Polk
- NCES district ID
- 1201590
- Math proficiency
- 39% ▼ -11.00%
- Reading proficiency
- 43% ▼ -4.00%
- Median HH income
- $43,979
- Composite
- 34.74/100
- National rank
- #5132
- State rank
- #62 of 73 in FL
Livability — Lakeland
- Score
- 77/100
- State rank
- #206
- US rank
- #3179
Category grades
Schools grade is shown separately in the Schools card above.
Census & demographics
- Census place
- Lakeland, FL
- County
- Polk County · 740,051 people
- City population
- 277,690
- Metro
- Lakeland-Winter Haven, FL
- Population (ZIP)
- 55,137
- Household income
- $69,986
- Rent vs Own
- Severe rent burden
- 1208.0
Population outlook (Polk County) Hauer SSP2
- Today (2025)
- 752,975 people
- By 2030
- 804,621 · +6.9%
- By 2040
- 906,117 · +20.3%
- By 2050
- 1,000,476 · +32.9%
- By 2075
- 1,197,520 · +59.0%
- By 2100
- 1,271,518 · +68.9%
Race, ethnicity, and origin ACS 2023
- Neighborhood character
- Diverse neighborhood (Simpson 0.58)
- Race & ethnicity
- White 59% Hispanic / Latino 23% Black 12% Two or more races 10% Asian 2%
- Hispanic origin (detail)
- Mexican 5% Puerto Rican 9% Cuban 5%
- Common ancestry
- Italian 2% Lithuanian 2% Slovak 1%
- Foreign-born
- 9% · Canada, Jamaica
- Languages at home
- 79% English-only · Spanish 17% French/Haitian/Cajun 1% Tagalog/Filipino 1%
Political lean MEDSL · Polk
- 2024 margin
- Strong R (+20.7) · D 39.2% · R 59.9%
- 2008→2024 swing
- -14.6pp toward R · 2008: -6.1pp · 2024: -20.7pp
- All cycles
- 2024: R+20.7 2020: R+14.4 2016: R+14.1 2012: R+6.8 2008: R+6.1
Not yet ingested
- Civics
- —
Market trends
- HPI YoY
- ▼ -194.94%
- Current HPI
- 320.7366
- Rent YoY
- ▲ 2.78%
- Metro
- Lakeland-Winter Haven, FL
- State GDP YoY
- ▲ 3.28%
- F500 in state
- 36
Industry mix (Fortune 500 HQ in FL)
| Industry | F500 HQs | Revenue |
|---|---|---|
| Industrial Technology | 2 | $29B |
|
||
| Insurance | 2 | $17B |
|
||
| Retail | 1 | $60B |
|
||
| Technology Distribution | 1 | $58B |
|
||
| Homebuilding | 1 | $35B |
|
||
| Technology Manufacturing | 1 | $35B |
|
||
Cash-flow waterfall
monthlySold comps — $/sqft
last 12 mo · ≤1 miLoading sold comps…