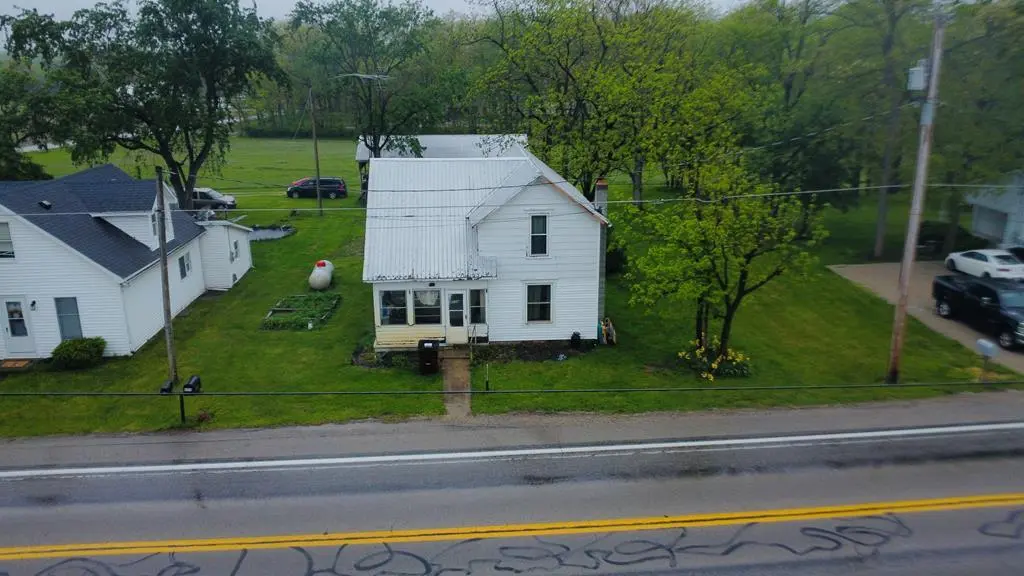
9036 St. Rt. 49 · Ansonia, OH
Flood risk 1/10 · Minimal
- FEMA flood zone
- X (unshaded)
- Chance of flooding over 30 yrs
- 0.0%
- Est. flood insurance / yr
- $507 – $1,088
Fire risk 1/10 · Minimal
- Est. fire insurance / yr
- $713 – $1,323
Heat risk 3/10 · Minor
- Hot days now (above 100°F)
- 7 days/yr
- Hot days in 30 yrs
- 18 days/yr
Wind risk 2/10 · Minimal
- Chance of severe wind over 30 yrs
- 1.0%
Air-quality risk 3/10 · Minor
- Unhealthy air days now
- 2 days/yr
- Unhealthy air days in 30 yrs
- 3 days/yr
Risk factors via First Street. Map © Google.
Why this score? — see what drove the B grade
The composite is a weighted blend of 9 inputs, each scored 0–100. Each bar is that input's sub-score; the figure is the points it added to the 100-point composite (weight × sub-score).
- Cash flow +27.5/30.0
- ARV discount +15.0/15.0
- DSCR +9.6/10.0
- 1% rule +6.7/10.0
- Schools +5.8/10.0
- Livability +3.6/5.0
- Rent growth +2.5/5.0
- Condition / age +2.5/5.0
- Appreciation +0.0/10.0
$99,900
🖨 Deal sheet 📄 Offer letter ✓ Due diligence
Listing remarks
This 3-bedroom, 1-bath home offers 1,202 sq ft of opportunity, charm and functional space with room to grow. Furnace is new, New vinyl siding, some carpet was replaced and Kitchen and bathroom floors was replaced! Perfect for a buyer looking to add their own finishing touches, this property has solid potential and just needs a few updates to truly shine. Inside you'll find a comfortable layout with spacious living areas and an additional loft space that could easily serve as a 4th bedroom, home office, playroom or bonus hangout area. Outside is a nice detached garage plus a large carport area with plenty of room for vehicles, storage, hobbies or entertaining. Whether you're an investor, fir
Key facts
- 7,405 sq ft lot
- Garage
- Built 1900
Property features AI
Exterior
- Parking: Has garage; About 1.5 parking spaces (covered)
- Utilities: Private well water; Septic tank sewer; 200+ amp electric service
- Home design: Single-family residence; One story
- Construction: Vinyl siding
- Exterior features: Metal roof; Lot approximately 0.17 acres
Interior
- Bedrooms: One main-level bedroom
- Flooring: Carpet; Vinyl; Linoleum; Wood
- Bathrooms: One full bathroom (main level)
- Heating & cooling: Forced air heating (propane); No central cooling listed
- Interior features: Double-pane windows; Partial basement
- Laundry & utility: Dedicated laundry room
Neighborhood map
What this means for you Summary
Snapshot
- This is a 3-bed/1.0-bath single-family listed at $100k.
Deal economics
- At list price, monthly cash flow is $294 ($4k/yr) — positive.
- The deal already cash-flows at list — no discount required.
- Meets the 1% rule at list price ($1k rent vs $100k).
- Recommended offer: $97k (3.0% below list) — sets the bar for market timing.
Location & tenants
- Location reads 71/100 on livability (#416 in OH) — a middle-class / working-renter tenant base. Strengths: schools A+, crime A+, cost of living A+; Watch: health & safety C-, employment D, amenities F.
- Ansonia Local (rural): math 69% / reading 69% proficiency, ranked #170 of 656 in OH (top 26%) — acceptable for families but not a draw, mixed tenant base, ~2y average lease.
- Market conditions: 73 active listings in the ZIP; 43 units permitted in Darke County in 2024 (0 in 5+ unit buildings).
Forward outlook
- Local home prices are declining (-3.0%/yr); year-one equity from $691 of loan paydown is wiped out by about $3k of value loss. Plan a longer hold.
- Darke County population projected at -20% by 2050 — secular population decline; favor cash flow + early exit over multi-decade hold.
- At projected returns (-3.0% appreciation + 3.0% rent growth), your $28k cash investment doubles in ~10 years — after that, you're playing with house money.
Negotiation context
- It's been on market 38 days — a 3% lower offer ($97k) is reasonable based on typical stale-listing flexibility.
- 3 sale attempts; this cycle's ask has dropped $15k (13%) from the opening price — seller is motivated, your offer sets the floor, not the list.
- Current owner paid $60k; list at $100k implies a 66% gain — meaningful room to come down on a strong offer.
Risks & watch-outs
- Watch-outs: built in 1900 — expect roof / HVAC / electrical / plumbing capex.
Questions for the listing agent
- It's been on market 38 days. Have you received any prior offers? Is the seller open to a 3% concession, seller financing, or rate buy-down credit?
- Built in 1900 — when were the roof, HVAC, electrical panel, plumbing, and water heater last replaced?
- Is there a deadline driving the sale (1031 exchange, divorce, estate, relocation)? That informs how much negotiation room exists.
- Schools are A-rated — typically a magnet for longer-tenancy family renters. What's the average tenant stay here, and is there a school-zone premium baked into asking?
- What's the average days-on-market for RENTAL listings here right now (not sales)? A rising rental-DOM trend means longer vacancies and softer asking-rent achievability than the comps imply.
- What's the recent tenant-quality profile in this submarket — average credit score on applications, eviction rate, late-payment / NSF rate, and stable-employment percentage? A property-management company in the area should have these aggregated.
- How much new for-sale + rental construction is in the pipeline within 1–3 miles? Heavy new supply typically softens prices + rents 12–24 months out; constrained supply supports both.
Investment metrics
- 1% rule
- 1.17% ✓
- Cap rate
- 9.82%
- Cash-on-cash
- 12.61%
- DSCR
- 1.56
- GRM
- 7.1
CMA / ARV
- ARV (median comp)
- $178,663
- List price
- $99,900
- Delta
- -44.08%
- Verdict
- UNDERPRICED
- Comps
- 8 within 1.0 mi
Show comp detail 1 sale within ~0.75 mi
| Address | Dist | Beds/Ba | Sqft | Sold | Price | $/sf | Match |
|---|---|---|---|---|---|---|---|
| 3117 Hillgrove Woodington Rd | 0.27mi | 3/1.0 | 1,040 (-12%) | 18mo | $112,000 | $108 | 52 |
Match score weights: distance 35% · size 25% · config 20% · recency 20%. Top-matched comps best support the ARV.
Projected returns pro-forma
-3.0% appreciation · 3.0% rent growth · sell at horizon
- IRR
- 2.3%
- Equity multiple
- 1.09×
- Total profit
- $2,515
- Equity at exit
- $14,895
- IRR
- 11.9%
- Equity multiple
- 1.94×
- Total profit
- $26,216
- Equity at exit
- $8,638
Cash invested: $27,972 (down + closing). Projections, not guarantees.
Landlord ↔ Tenant lean methodology
- Overall (STATE)
- 73 Landlord-Friendly
- State Ohio
- 73 Landlord-Friendly · R+6
- County
- — inherits STATE
- City
- — inherits STATE
ZIP-level market 45331
- Active inventory
- 73
- Price-to-rent
- 7.1×
Monthly cashflow live
- Estimated rent
- $1,168 medium interval (Pro) →
- Mortgage (P&I)
- −$524
- Tax from tax record
- −$63 /mo · $760/yr
- Insurance
- −$42
- HOA
- −$0
- Vacancy / Maint / Mgmt
- −$245
- Net cashflow
- $294
Break-even live
UW: 25.0% down · 7.5% · 30yr · 1.5% tax · 5.0% vac · 8.0% maint · 8.0% mgmt
Financing live
Cash to close
- Down payment
- $24,975
- Closing costs
- $2,997
- Reserves months
- —
- Total cash needed
- —
Loan-product check · same deal, 3 products live
Conventional
25% down · 7.5% · 30yr
- Down + closing
- —
- Monthly P&I
- —
- Monthly cashflow
- —
- DSCR
- —
- Eligible?
- —
Personal DTI + credit; lowest rate.
DSCR
20% down · 8.5% · 30yr
- Down + closing
- —
- Monthly P&I
- —
- Monthly cashflow
- —
- DSCR
- —
- Eligible?
- —
No personal income docs; deal must DSCR.
Hard money
10% down · 12.0% · 12mo
- Down + closing
- —
- Monthly P&I
- —
- Monthly cashflow
- —
- DSCR
- —
- Eligible?
- —
Short-term bridge; refi at stabilization.
Listing history 16 events
-
2026-06-13days on market $99,900 Active 38 DOM
-
2026-06-12days on market $99,900 Active 37 DOM
-
2026-06-09days on market $99,900 Active 34 DOM
-
2026-06-08days on market $99,900 Active 33 DOM
-
2026-06-07pricedays on market $99,900 Active 32 DOM
-
2026-06-05days on market $110,000 Active 30 DOM
-
2026-06-04days on market $110,000 Active 28 DOM
-
2026-06-02days on market $110,000 Active 27 DOM
-
2026-06-01days on market $110,000 Active 26 DOM
-
2026-05-31days on market $110,000 Active 25 DOM
-
2026-05-06$115,000 Active 938-char remark
-
2026-05-06$115,000 Active
-
2026-05-06$115,000 Active
-
2025-12-22soldstatus $60,000
-
2006-09-19soldstatus $33,000
-
2000-04-21soldstatus $57,500
ⓘ Source: listings_history table (triggers on properties + properties_extension) + one-shot
backfill from property_details.listing_events for pre-trigger history.
Tax reassessment forecast OH · Partial reset (capped growth)
- Current annual tax
- $760 · $63/mo
- Projected year-2 tax
- $1,159 · $97/mo
- Expected delta
- +$399/yr (+$33/mo · 52.6%)
ⓘ Screening estimate from a state-policy table — verify with the county assessor before closing.
Climate risk First Street
- Flood 1/10 Low FEMA zone X (unshaded) · 0% chance over 30 yrs
- Wildfire 1/10 Low
- Heat 3/10 Moderate 7 d/yr ≥100°F today · 18 d/yr by 30 yrs out
- Wind 2/10 Low 100% chance of damaging wind over 30 yrs
- Air quality 3/10 Moderate 2 unhealthy d/yr today · 3 by 30 yrs out
Nearby sold comps map
Loading sold comps map…
Walkable amenities ~0.75 mi
Loading nearby amenities…
Taxation est. · year 1
- Rental income
- $14,017
- − Mortgage interest
- −$5,596
- − Property taxes
- −$760
- − Insurance
- −$500
- − Repairs & maintenance
- −$1,121
- − Management
- −$1,121
- − Depreciation
- −$2,906
- Taxable income
- $2,013
- Est. tax owed @ 24.0%
- −$483
- After-tax cash flow
- $3,045/yr
For passive investors: Depreciation is non-cash, so a rental often shows a tax loss while cash-flowing — sheltering income. Rental losses are passive: they offset passive income freely, and up to $25,000/yr can offset ordinary (W-2) income if you actively participate and your MAGI is under $100k (phasing out to $0 by $150k); unused losses carry forward. On sale, claimed depreciation is recaptured at up to 25%, and gains may owe capital-gains tax (a 1031 exchange can defer both). Figures are a year-1 estimate at your 24.0% rate — not tax advice; consult a CPA.
Schools (NCES district)
- District
- Ansonia Local
- NCES district ID
- 3904662
- Math proficiency
- 69% ▼ -15.00%
- Reading proficiency
- 69% ▼ -8.00%
- Median HH income
- $44,736
- Composite
- 58.04/100
- National rank
- #1034
- State rank
- #170 of 656 in OH
Livability — Ansonia
- Score
- 71/100
- State rank
- #416
- US rank
- #6854
Category grades
Schools grade is shown separately in the Schools card above.
Census & demographics
- County
- Darke · 50,606 people
- Population (ZIP)
- 22,298
- Household income
- $53,797
- Rent vs Own
- Severe rent burden
- 13.3
Population outlook (Darke County) Hauer SSP2
- Today (2025)
- 49,377 people
- By 2030
- 47,494 · -3.8%
- By 2040
- 43,553 · -11.8%
- By 2050
- 39,320 · -20.4%
- By 2075
- 30,091 · -39.1%
- By 2100
- 21,110 · -57.2%
Race, ethnicity, and origin ACS 2023
- Neighborhood character
- Predominantly White (95%)
- Race & ethnicity
- White 95% Two or more races 3% Hispanic / Latino 2%
- Common ancestry
- Lithuanian 2% Italian 1% Iranian 1%
- Foreign-born
- 1% · Canada
- Languages at home
- 98% English-only · Spanish 1%
Political lean MEDSL · Darke
- 2024 margin
- Solid R (+65.4) · D 17.0% · R 82.3%
- 2008→2024 swing
- -29.2pp toward R · 2008: -36.1pp · 2024: -65.4pp
- All cycles
- 2024: R+65.4 2020: R+63.6 2016: R+61.2 2012: R+44.9 2008: R+36.1
Not yet ingested
- Civics
- —
Market trends
- HPI YoY
- ▼ -110.47%
- Current HPI
- 201.8715
- Rent YoY
- —
- Metro
- —
- State GDP YoY
- ▲ 1.98%
- F500 in state
- 48
Industry mix (Fortune 500 HQ in OH)
| Industry | F500 HQs | Revenue |
|---|---|---|
| Insurance | 3 | $145B |
|
||
| Industrial Machinery | 3 | $49B |
|
||
| Financial Services | 3 | $24B |
|
||
| Consumer Goods | 2 | $93B |
|
||
| Aerospace / Defense | 2 | $47B |
|
||
| Utilities | 2 | $33B |
|
||
Price history
+73.7% since first listed13 events — show timeline
- 2026-06-14 Listing Removed — CBRMLS
- 2026-06-14 Listing Removed — Cincy MLS
- 2026-06-05 Price Changed $99,900 SVAR
- 2026-06-05 Price Changed $99,900 CBRMLS
- 2026-06-05 Price Changed $99,900 Cincy MLS
- 2026-05-29 Price Changed $110,000 SVAR
- 2026-05-29 Price Changed $110,000 CBRMLS
- 2026-05-06 Listed $115,000 SVAR
- 2026-05-06 Listed $115,000 CBRMLS
- 2026-05-06 Listed $115,000 Cincy MLS
- 2025-12-22 Sold (Public Records) $60,000 Public Records
- 2006-09-19 Sold (Public Records) $33,000 Public Records
- 2000-04-21 Sold (Public Records) $57,500 Public Records
Property tax history
+4.0%/yrLatest (2025): $760 · -0.1% YoY. Source: county tax records.
Cash-flow waterfall
monthlySold comps — $/sqft
last 12 mo · ≤1 miLoading sold comps…