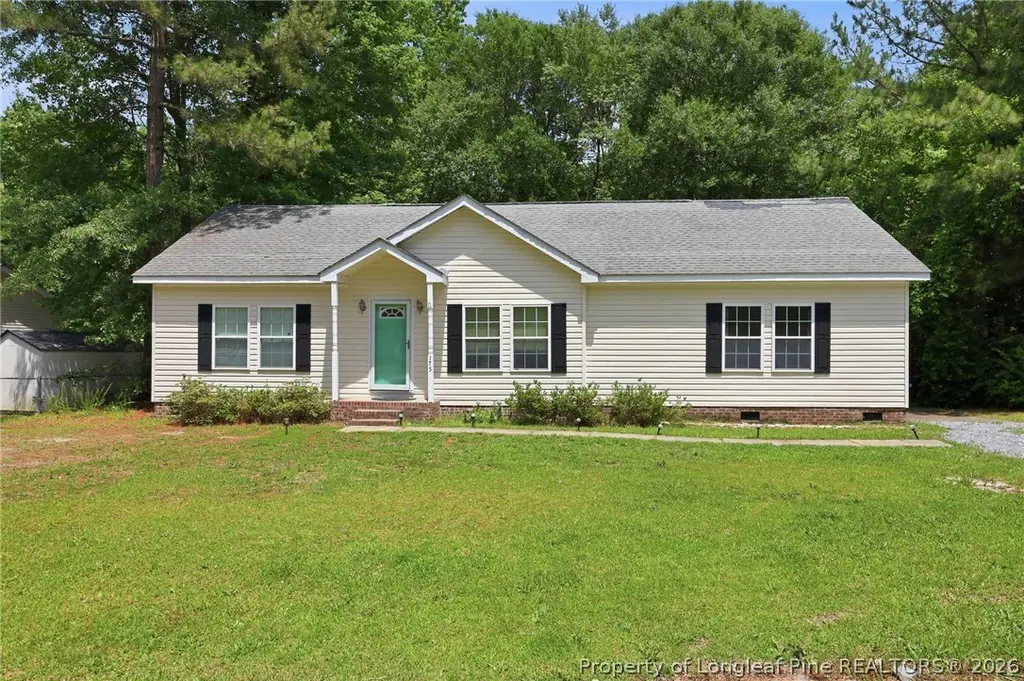
175 Country Walk Ln · Sanford, NC
Flood risk 6/10 · Moderate
- FEMA flood zone
- X (unshaded)
- Chance of flooding over 30 yrs
- 0.71%
- Est. flood insurance / yr
- $507 – $1,088
Fire risk 6/10 · Moderate
- Est. fire insurance / yr
- $906 – $1,684
Heat risk 6/10 · Moderate
- Hot days now (above 107°F)
- 7 days/yr
- Hot days in 30 yrs
- 17 days/yr
Wind risk 6/10 · Moderate
- Chance of severe wind over 30 yrs
- 67.0%
Air-quality risk 1/10 · Minimal
- Unhealthy air days now
- 0 days/yr
- Unhealthy air days in 30 yrs
- 0 days/yr
Risk factors via First Street. Map © Google.
Why this score? — see what drove the C- grade
The composite is a weighted blend of 9 inputs, each scored 0–100. Each bar is that input's sub-score; the figure is the points it added to the 100-point composite (weight × sub-score).
- Cash flow +15.2/30.0
- ARV discount +15.0/15.0
- DSCR +4.7/10.0
- Rent growth +3.7/5.0
- Livability +3.6/5.0
- 1% rule +3.1/10.0
- Schools +3.0/10.0
- Condition / age +2.5/5.0
- Appreciation +0.0/10.0
$225,000
🖨 Deal sheet (PDF) 📄 Offer letter ✓ Due diligence
Listing remarks MLS
Welcome to 175 Country Walk Lane — a charming ranch-style home tucked away on a quiet cul-de-sac in Sanford. This 3-bedroom, 2-bath home offers a bright, functional layout with spacious bedrooms, walk-in closets, and comfortable everyday living. The kitchen features abundant cabinet storage and opens to a separate dining area, perfect for entertaining. Enjoy the privacy of a large backyard backing to a peaceful creek, plus a covered front porch ideal for relaxing mornings and evenings. A storage shed provides additional space for tools, hobbies, or outdoor equipment. Conveniently located with easy access to local amenities while offering the feel of country living. Seller is offering $10,000 back at closing with an acceptable offer.
Key facts
- Covered front porch
- Quiet cul-de-sac
- Large backyard
Tags
Property features AI
Exterior
- Parking: Unpaved parking
- Utilities: No utilities specified; Paved road access; City street and state road frontage; Zoned RA
- Home design: Single-family residence; One level; Entry level 1
- Construction: Aluminum siding and frame construction; Shingle roof; Built on crawl space
- Exterior features: Front porch; Porch; Has a view
Interior
- Kitchen: Refrigerator; Dishwasher; Electric range
- Flooring: Carpet; Vinyl
- Bathrooms: 2 full bathrooms
- Heating & cooling: Heat pump heating; Electric heating; Central air conditioning
- Interior features: Window coverings; Crawl space basement; 7 total rooms
- Laundry & utility: Electric water heater
Neighborhood map
What this means for you Summary
Snapshot
- This is a 3-bed/2.0-bath single-family listed at $225k.
Deal economics
- At list price, monthly cash flow is $77 ($923/yr) — positive.
- The deal already cash-flows at list — no discount required.
- To meet the 1% rule (rent ≥ 1% of price), the offer needs to be $181k (19.4% below list).
- Recommended offer: $181k (19.4% below list) — sets the bar for 1% rule.
- Cap rate 6.7% vs local median 3.6% in Sanford — top-decile yield for the area; either an underpriced asset or a hidden risk that comps aren't pricing in. Stress-test before assuming the spread holds.
Location & tenants
- Location reads 72/100 on livability (#92 in NC) — a middle-class / working-renter tenant base. Strengths: cost of living A+, housing A+, health & safety A+; Watch: employment D, crime D-, commute F.
- Harnett County Schools (rural): math 31% / reading 39% proficiency, ranked #130 of 178 in NC (top 73%) — families likely to look elsewhere, expect single-tenant / working-renter base with shorter leases.
- Zoned schools: Benhaven Elementary (math 50% / reading 48%, grade D, #459 of 1,410 statewide, top 33%, 1,030 students, 45% FRL); Harnett Central Middle (math 25% / reading 38%, grade F, #323 of 475 statewide, top 68%, 1,024 students, 63% FRL); Harnett Central High (math 43% / reading 51%, grade D-, #334 of 535 statewide, top 64%, 1,474 students, 56% FRL) — zoned schools at 55% FRL track the district average.
- Market conditions: Rents rising fast (+4.9%/yr); 462 active listings in the ZIP; 1 comparable units currently listed for rent nearby; solid renter incomes; 2,080 units permitted in Harnett County in 2024 (12 in 5+ unit buildings).
Forward outlook
- Local home prices are declining (-3.0%/yr); year-one equity from $2k of loan paydown is wiped out by about $7k of value loss. Plan a longer hold.
- Harnett County population projected at +42% by 2050 — long-run rental-demand tailwind backs the buy-and-hold thesis.
Negotiation context
- It's been on market 23 days — a 2% lower offer ($222k) is reasonable based on typical stale-listing flexibility.
- 7 sale attempts since 11y ago with the ask held roughly flat each time — persistent listings suggest the price (not the market) is what's stuck; bring a comps-based counter.
- Current owner paid $120k; list at $225k implies a 88% gain — meaningful room to come down on a strong offer.
Risks & watch-outs
- Climate carrying-cost: major flood risk; major wind risk, 67% chance of damaging wind over 30y; major wildfire risk; extreme-heat days projected 7→17/yr by 2055 (HVAC capex compounding) — expect insurance premiums to compound above CPI over the hold.
Questions for the listing agent
- Is there a deadline driving the sale (1031 exchange, divorce, estate, relocation)? That informs how much negotiation room exists.
- Schools are F-rated, which usually means shorter tenancies and higher turnover. Who's the typical renter profile here, and what's been the actual vacancy rate?
- Crime grade is D in this area — have there been break-ins, vandalism, or insurance claims at this property in the last 3 years? What carrier currently insures it and at what premium?
- What's the average days-on-market for RENTAL listings here right now (not sales)? A rising rental-DOM trend means longer vacancies and softer asking-rent achievability than the comps imply.
- What's the recent tenant-quality profile in this submarket — average credit score on applications, eviction rate, late-payment / NSF rate, and stable-employment percentage? A property-management company in the area should have these aggregated.
- How much new for-sale + rental construction is in the pipeline within 1–3 miles? Heavy new supply typically softens prices + rents 12–24 months out; constrained supply supports both.
Investment metrics
- 1% rule
- 0.81% ✗
- Cap rate
- 6.70%
- Cash-on-cash
- 1.46%
- DSCR
- 1.07
- GRM
- 10.3
CMA / ARV
- ARV (on-the-fly)
- $276,696
- Comps found
- 9
Show comp detail 9 sales within ~0.75 mi
| Address | Dist | Beds/Ba | Sqft | Sold | Price | $/sf | Match |
|---|---|---|---|---|---|---|---|
| 85 Country Walk Ln | 0.08mi | 3/2.0 | 1,541 (+2%) | 2mo | $229,000 | $149 | 92 |
| 41 Andrea Ct | 0.61mi | 3/2.0 | 1,497 (-1%) | 1mo | $255,000 | $170 | 69 |
| 20 W Park Ln | 0.32mi | 3/2.5 | 1,405 (-7%) | 12mo | $270,000 | $192 | 61 |
| 206 Westpark Ln | 0.39mi | 3/2.5 | 1,453 (-4%) | 15mo | $283,900 | $195 | 61 |
| 188 West Park Ln | 0.37mi | 3/2.5 | 1,615 (+7%) | 10mo | $295,000 | $183 | 61 |
| 212 Westpark Ln | 0.40mi | 3/2.0 | 1,350 (-11%) | 8mo | $282,000 | $209 | 56 |
| 128 W Park Ln | 0.34mi | 3/2.5 | 1,409 (-7%) | 21mo | $278,000 | $197 | 54 |
| 599 Nicole Dr | 0.68mi | 3/2.0 | 1,348 (-11%) | 4mo | $215,000 | $159 | 47 |
| 72 Edgedale Ln | 0.67mi | 3/2.5 | 1,448 (-4%) | 17mo | $260,000 | $180 | 46 |
Match score weights: distance 35% · size 25% · config 20% · recency 20%. Top-matched comps best support the ARV.
Projected returns pro-forma
-3.0% appreciation · 4.87% rent growth · sell at horizon
- IRR
- -12.2%
- Equity multiple
- 0.55×
- Total profit
- $-28,182
- Equity at exit
- $33,548
- IRR
- -0.8%
- Equity multiple
- 0.94×
- Total profit
- $-3,798
- Equity at exit
- $19,454
Cash invested: $63,000 (down + closing). Projections, not guarantees.
Landlord ↔ Tenant lean methodology
- Overall (STATE)
- 85 Strongly Landlord-Friendly
- State North Carolina
- 85 Strongly Landlord-Friendly · R+3
- County
- — inherits STATE
- City
- — inherits STATE
ZIP-level market 27332
- Home prices YoY
- -17.8%
- Rents YoY
- 4.9%
- Active inventory
- 462
- Price-to-rent
- 10.3×
Monthly cashflow live
- Estimated rent
- $1,814 medium interval (Pro) →
- Mortgage (P&I)
- −$1,180
- Tax from tax record
- −$82 /mo · $990/yr
- Insurance
- −$94
- HOA
- −$0
- Vacancy / Maint / Mgmt
- −$381
- Net cashflow
- $77
Break-even live
Sensitivity live
| Price | -10% $204 | -5% $141 | +0% $77 | +5% $13 | +10% $-50 |
|---|---|---|---|---|---|
| Rent | -10% $-66 | -5% $5 | +0% $77 | +5% $149 | +10% $220 |
| Rate | -1.0pp $190 | -0.5pp $134 | base $77 | +0.5pp $19 | +1.0pp $-41 |
UW: 25.0% down · 7.5% · 30yr · 1.5% tax · 5.0% vac · 8.0% maint · 8.0% mgmt
Financing live
Cash to close
- Down payment
- $56,250
- Closing costs
- $6,750
- Reserves months
- —
- Total cash needed
- —
Loan-product check · same deal, 3 products live
Conventional
25% down · 7.5% · 30yr
- Down + closing
- —
- Monthly P&I
- —
- Monthly cashflow
- —
- DSCR
- —
- Eligible?
- —
Personal DTI + credit; lowest rate.
DSCR
20% down · 8.5% · 30yr
- Down + closing
- —
- Monthly P&I
- —
- Monthly cashflow
- —
- DSCR
- —
- Eligible?
- —
No personal income docs; deal must DSCR.
Hard money
10% down · 12.0% · 12mo
- Down + closing
- —
- Monthly P&I
- —
- Monthly cashflow
- —
- DSCR
- —
- Eligible?
- —
Short-term bridge; refi at stabilization.
Rent comps 1 comps
| Address | Beds | Baths | Sqft | Rent | $/sqft | DOM | Units | Dist |
|---|---|---|---|---|---|---|---|---|
| 114 Kathleen Ter Sanford, NC | 3.0 | 2.0 | 1056 | $1,499 | $1.42 | 15d | 1 | 0.42mi |
Listing history 17 events
-
2026-06-21days on market $225,000 Active 23 DOM
-
2026-06-18days on market $225,000 Active 20 DOM
-
2026-06-17days on market $225,000 Active 19 DOM
-
2026-06-16days on market $225,000 Active 18 DOM
-
2026-06-15days on market $225,000 Active 17 DOM
-
2026-06-14pricedays on market $225,000 Active 15 DOM
-
2026-06-10days on market $235,000 Active 12 DOM
-
2026-06-09days on market $235,000 Active 11 DOM
-
2026-06-08days on market $235,000 Active 10 DOM
-
2026-06-07days on market $235,000 Active 9 DOM
-
2026-06-05days on market $235,000 Active 6 DOM
-
2026-06-03days on market $235,000 Active 5 DOM
-
2026-06-02days on market $235,000 Active 4 DOM
-
2026-06-01days on market $235,000 Active 3 DOM
-
2026-05-31days on market $235,000 Active 2 DOM
-
2026-05-30remarks 699-char remark
-
2026-05-30$235,000 Active 1 DOM
ⓘ Source: listings_history table (triggers on properties + properties_extension) + one-shot
backfill from property_details.listing_events for pre-trigger history.
Tax reassessment forecast NC · Resets to sale price
- Current annual tax
- $990 · $82/mo
- Projected year-2 tax
- $1,845 · $154/mo
- Expected delta
- +$855/yr (+$71/mo · 86.4%)
ⓘ Screening estimate from a state-policy table — verify with the county assessor before closing.
Climate risk First Street
- Flood 6/10 Major FEMA zone X (unshaded) · 71% chance over 30 yrs
- Wildfire 6/10 Major
- Heat 6/10 Major 7 d/yr ≥107°F today · 17 d/yr by 30 yrs out
- Wind 6/10 Major 67% chance of damaging wind over 30 yrs
- Air quality 1/10 Low 0 unhealthy d/yr today · 0 by 30 yrs out
Nearby sold comps map
Loading sold comps map…
Walkable amenities ~0.75 mi
Loading nearby amenities…
Taxation est. · year 1
- Rental income
- $21,768
- − Mortgage interest
- −$12,603
- − Property taxes
- −$990
- − Insurance
- −$1,125
- − Repairs & maintenance
- −$1,741
- − Management
- −$1,741
- − Depreciation
- −$6,545
- Taxable loss
- −$2,979
- Est. tax savings @ 24.0%
- +$715
- After-tax cash flow
- $1,637/yr
For passive investors: Depreciation is non-cash, so a rental often shows a tax loss while cash-flowing — sheltering income. Rental losses are passive: they offset passive income freely, and up to $25,000/yr can offset ordinary (W-2) income if you actively participate and your MAGI is under $100k (phasing out to $0 by $150k); unused losses carry forward. On sale, claimed depreciation is recaptured at up to 25%, and gains may owe capital-gains tax (a 1031 exchange can defer both). Figures are a year-1 estimate at your 24.0% rate — not tax advice; consult a CPA.
Schools (NCES district)
- District
- Harnett County Schools
- NCES district ID
- 3702010
- Math proficiency
- 31% ▼ -2.00%
- Reading proficiency
- 39% ▼ -1.00%
- Median HH income
- $45,400
- Composite
- 29.88/100
- National rank
- #6397
- State rank
- #130 of 178 in NC
Livability — Sanford
- Score
- 72/100
- State rank
- #92
- US rank
- #6134
Category grades
Schools grade is shown separately in the Schools card above.
Census & demographics
- County
- Lee County · 76,725 people
- City population
- 76,725
- Metro
- Sanford, NC
- Population (ZIP)
- 36,947
- Household income
- $78,447
- Rent vs Own
- Severe rent burden
- 632.0
Population outlook (Harnett County) Hauer SSP2
- Today (2025)
- 153,758 people
- By 2030
- 166,581 · +8.3%
- By 2040
- 192,741 · +25.4%
- By 2050
- 218,332 · +42.0%
- By 2075
- 275,422 · +79.1%
- By 2100
- 313,511 · +103.9%
Race, ethnicity, and origin ACS 2023
- Neighborhood character
- Diverse neighborhood (Simpson 0.59)
- Race & ethnicity
- White 59% Hispanic / Latino 19% Black 16% Two or more races 11% Asian 1%
- Hispanic origin (detail)
- Mexican 9% Puerto Rican 4% Cuban 2%
- Common ancestry
- Serbian 2% Italian 2% Slovak 2%
- Foreign-born
- 8% · Canada, South Korea
- Languages at home
- 82% English-only · Spanish 15%
Political lean MEDSL · Harnett
- 2024 margin
- Strong R (+25.1) · D 36.9% · R 62.0% · Other 1.1%
- 2008→2024 swing
- -8.4pp toward R · 2008: -16.7pp · 2024: -25.1pp
- All cycles
- 2024: R+25.1 2020: R+22.4 2016: R+24.1 2012: R+19.4 2008: R+16.7
Not yet ingested
- Civics
- —
Market trends
- HPI YoY
- ▼ -54.61%
- Current HPI
- 252.2719
- Rent YoY
- ▲ 4.87%
- Metro
- Sanford, NC
- State GDP YoY
- ▲ 3.28%
- F500 in state
- 26
Industry mix (Fortune 500 HQ in NC)
| Industry | F500 HQs | Revenue |
|---|---|---|
| Financial Services | 2 | $213B |
|
||
| Retail | 2 | $95B |
|
||
| Industrial Conglomerate | 1 | $38B |
|
||
| Metals / Steel | 1 | $35B |
|
||
| Utilities | 1 | $30B |
|
||
| Industrial Machinery | 1 | $19B |
|
||
Price history
+566.7% since first listed15 events — show timeline
- 2026-05-29 Listed $235,000 Hive MLS
- 2026-05-29 Listed $235,000 LPRMLS
- 2020-06-19 Sold (Public Records) $120,000 Public Records
- 2020-06-19 Sold (MLS) $120,000 AMLSNC
- 2020-06-12 Sold (MLS) $120,000 TMLS
- 2020-05-07 Contingent — TMLS
- 2020-05-07 Price Changed $124,000 TMLS
- 2020-05-06 Relisted — TMLS
- 2020-04-05 Contingent — TMLS
- 2020-04-02 Listed $124,000 AMLSNC
- 2020-04-02 Listed $105,000 TMLS
- 2016-08-01 Sold (MLS) — LPRMLS
- 2016-03-22 Listed $84,900 LPRMLS
- 2015-12-28 Sold (MLS) $36,601 LPRMLS
- 2015-10-28 Listed $35,250 LPRMLS
Property tax history
+0.5%/yrLatest (2025): $990 · +0.0% YoY. Source: county tax records.
Cash-flow waterfall
monthlySold comps — $/sqft
last 12 mo · ≤1 miLoading sold comps…