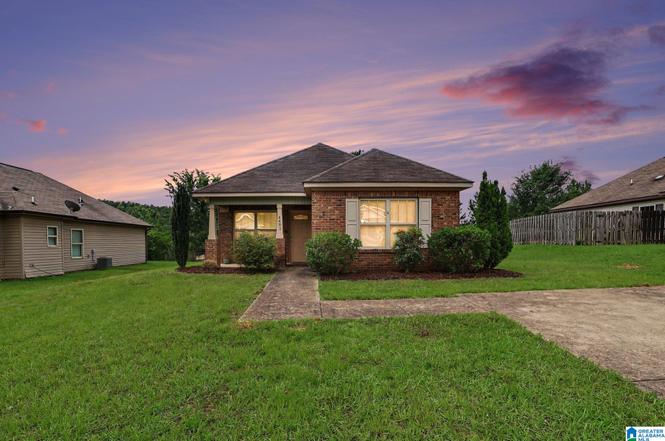
4481 Winchester Hills Way · Clay, AL
Flood risk 1/10 · Minimal
- FEMA flood zone
- X (unshaded)
- Chance of flooding over 30 yrs
- 0.0%
- Est. flood insurance / yr
- $507 – $1,088
Fire risk 4/10 · Minor
- Est. fire insurance / yr
- $916 – $1,700
Heat risk 6/10 · Moderate
- Hot days now (above 105°F)
- 7 days/yr
- Hot days in 30 yrs
- 20 days/yr
Wind risk 6/10 · Moderate
- Chance of severe wind over 30 yrs
- 27.0%
Air-quality risk 5/10 · Moderate
- Unhealthy air days now
- 6 days/yr
- Unhealthy air days in 30 yrs
- 11 days/yr
Risk factors via First Street. Map © Google.
Why this score? — see what drove the D+ grade
The composite is a weighted blend of 9 inputs, each scored 0–100. Each bar is that input's sub-score; the figure is the points it added to the 100-point composite (weight × sub-score).
- Cash flow +18.7/30.0
- ARV discount +6.4/15.0
- DSCR +5.9/10.0
- 1% rule +4.0/10.0
- Livability +3.8/5.0
- Rent growth +3.3/5.0
- Condition / age +2.5/5.0
- Schools +1.8/10.0
- Appreciation +0.0/10.0
$175,000
🖨 Deal sheet (PDF) 📄 Offer letter ✓ Due diligence
Listing remarks
Welcome home to this charming 3-bedroom, 2-bath residence in Winchester Hills. Fresh interior paint and a recently serviced HVAC system provide added peace of mind. This home offers a functional layout, comfortable living spaces, and a low-maintenance yard. Enjoy relaxing or entertaining on the rear patio overlooking a backyard framed by mature pine trees and natural greenery, creating a peaceful outdoor setting. Conveniently located just minutes from Publix, shopping, dining, and I-59, this home offers easy access to Birmingham and surrounding areas while maintaining a neighborhood feel. Priced to provide an excellent opportunity for buyers seeking value and the ability to add their own pe
Key facts
- Low-maintenance yard
- Rear patio
- 9,147 sq ft lot
Tags
Property features AI
Finance
- Other: Lot size about 0.21 acres; Located in the Winchester Hills subdivision
Exterior
- Parking: Driveway parking; Off-street parking; Uncovered parking
- Utilities: Public water; Connected sewer; Electric water heater; Underground utilities; Internet available (Spectrum)
- Home design: Existing (previously built) home; 1-side brick and vinyl siding construction; Slab foundation; Not waterfront; No pool
- Construction: 1-side brick with vinyl siding
- Exterior features: Open patio; Porch; Garden/Patio
Interior
- Kitchen: Laminate and solid-surface countertops; Electric cooktop; Built-in dishwasher; Built-in freezer and ice maker; Electric oven (self-cleaning); Refrigerator; Some stainless appliances
- Bedrooms: Master bedroom on main level; Additional bedrooms on main level
- Flooring: Hardwood floors; Tile flooring
- Bathrooms: Two full bathrooms; Tub/shower combo; Linen closet
- Heating & cooling: Central heating; Central electric cooling
- Interior features: Trey ceilings; Split bedroom floor plan; Pull-down attic; Living area reported as 1,163 (per tax report)
- Laundry & utility: Laundry room on main level; Washer hookup; Electric dryer hookup
Neighborhood map
What this means for you Summary
Snapshot
- This is a 3-bed/2.0-bath single-family listed at $175k.
Deal economics
- At list price, monthly cash flow is $172 ($2k/yr) — positive.
- The deal already cash-flows at list — no discount required.
- To meet the 1% rule (rent ≥ 1% of price), the offer needs to be $158k (9.9% below list).
- Recommended offer: $158k (9.9% below list) — sets the bar for 1% rule.
- Cap rate 7.5% vs local median 4.7% in Clay — top-decile yield for the area; either an underpriced asset or a hidden risk that comps aren't pricing in. Stress-test before assuming the spread holds.
Location & tenants
- Location reads 75/100 on livability (#16 in AL, #3,849 nationally) — a middle-class / working-renter tenant base. Strengths: cost of living A+, housing A+, employment A-; Watch: amenities F, commute F.
- Jefferson County (suburban): math 9% / reading 32% proficiency, ranked #104 of 129 in AL (top 81%) — low school quality limits family demand, transient renter base, plan for 1-2y turnover.
- Zoned schools: Chalkville Elementary School (math 6% / reading 16%, grade F, #560 of 627 statewide, top 90%, 854 students, 79% FRL); Claychalkville Middle School (math 2% / reading 26%, grade F, #209 of 257 statewide, top 82%, 1,032 students, 64% FRL); Claychalkville High School (math 6% / reading 9%, grade F, #261 of 305 statewide, top 87%, 1,361 students, 56% FRL) — zoned schools average 66% FRL vs 49% district-wide (18 pts higher); higher-poverty schools than district average — tighter screening recommended.
- Market conditions: Rents rising (+3.0%/yr); 336 active listings in the ZIP; 19 comparable units currently listed for rent nearby; rentals at typical pace (median 26d on market — plan ~3-4 weeks tenant-placement turnaround); 2,114 units permitted in Jefferson County in 2024 (556 in 5+ unit buildings).
- This rent runs 36% of the median local income ($53k/yr) — at the standard rent-burdened threshold; future hikes will face affordability resistance.
Forward outlook
- Local home prices are declining (-3.0%/yr); year-one equity from $1k of loan paydown is wiped out by about $5k of value loss. Plan a longer hold.
- Jefferson County population projected to shrink 4% by 2050 — rents likely to lag national; underwrite the cash flow, not the appreciation.
Negotiation context
- Only 1 days on market — expect competitive offers; lowballing is unlikely to land.
Risks & watch-outs
- Climate carrying-cost: major wind risk, 27% chance of damaging wind over 30y; extreme-heat days projected 7→20/yr by 2055 (HVAC capex compounding) — expect insurance premiums to compound above CPI over the hold.
Questions for the listing agent
- Is there a deadline driving the sale (1031 exchange, divorce, estate, relocation)? That informs how much negotiation room exists.
- The area grade is low — what's the realistic commute time and amenity access for the typical tenant pool here? Any planned neighborhood developments (good or bad) we should know about?
- What's the average days-on-market for RENTAL listings here right now (not sales)? A rising rental-DOM trend means longer vacancies and softer asking-rent achievability than the comps imply.
- What's the recent tenant-quality profile in this submarket — average credit score on applications, eviction rate, late-payment / NSF rate, and stable-employment percentage? A property-management company in the area should have these aggregated.
- How much new for-sale + rental construction is in the pipeline within 1–3 miles? Heavy new supply typically softens prices + rents 12–24 months out; constrained supply supports both.
Investment metrics
- 1% rule
- 0.90% ✗
- Cap rate
- 7.47%
- Cash-on-cash
- 4.20%
- DSCR
- 1.19
- GRM
- 9.2
CMA / ARV
- ARV (on-the-fly)
- $170,961
- Comps found
- 12
Show comp detail 12 sales within ~0.75 mi
| Address | Dist | Beds/Ba | Sqft | Sold | Price | $/sf | Match |
|---|---|---|---|---|---|---|---|
| 4488 Winchester Hills Way | 0.03mi | 3/2.0 | 1,165 (+0%) | 10mo | $225,000 | $193 | 90 |
| 1117 Oak Creek Trl NE | 0.19mi | 3/2.0 | 1,226 (+5%) | 11mo | $162,500 | $133 | 73 |
| 4445 Winchester Hills Way | 0.10mi | 4/2.0 (+1) | 1,330 (+14%) | 9mo | $195,000 | $147 | 59 |
| 5370 Tyler Loop Rd | 0.61mi | 3/1.5 | 1,125 (-3%) | 8mo | $146,000 | $130 | 57 |
| 4956 Kerri Ln | 0.47mi | 3/2.0 | 1,300 (+12%) | 2mo | $219,267 | $169 | 57 |
| 2835 Creek Ln NE | 0.52mi | 3/1.0 | 1,080 (-7%) | 4mo | $104,900 | $97 | 56 |
| 5150 Amberwood Ln | 0.74mi | 3/1.0 | 1,128 (-3%) | 2mo | $155,000 | $137 | 55 |
| 5135 Amberwood Ln | 0.70mi | 3/2.0 | 1,135 (-2%) | 11mo | $162,000 | $143 | 54 |
| 4961 Kerri Ln | 0.52mi | 3/2.0 | 1,302 (+12%) | 10mo | $247,900 | $190 | 48 |
| 5290 Baggett Dr | 0.67mi | 3/1.5 | 1,278 (+10%) | 5mo | $170,000 | $133 | 46 |
| 4989 Kerri Ln | 0.54mi | 3/2.0 | 1,302 (+12%) | 12mo | $249,900 | $192 | 45 |
| 5079 Darlene Dr | 0.61mi | 4/1.5 (+1) | 1,296 (+11%) | 3mo | $198,000 | $153 | 43 |
Match score weights: distance 35% · size 25% · config 20% · recency 20%. Top-matched comps best support the ARV.
Projected returns pro-forma
-3.0% appreciation · 3.04% rent growth · sell at horizon
- IRR
- -9.7%
- Equity multiple
- 0.64×
- Total profit
- $-17,428
- Equity at exit
- $26,093
- IRR
- -0.3%
- Equity multiple
- 0.98×
- Total profit
- $-1,088
- Equity at exit
- $15,131
Cash invested: $49,000 (down + closing). Projections, not guarantees.
Landlord ↔ Tenant lean methodology
- Overall (STATE)
- 90 Strongly Landlord-Friendly
- State Alabama
- 90 Strongly Landlord-Friendly · R+15
- County
- — inherits STATE
- City
- — inherits STATE
ZIP-level market 35215
- Home prices YoY
- -34.4%
- Rents YoY
- 3.0%
- Active inventory
- 336
- Price-to-rent
- 9.2×
Monthly cashflow live
- Estimated rent
- $1,577 high interval (Pro) →
- Mortgage (P&I)
- −$918
- Tax from tax record
- −$84 /mo · $1,006/yr
- Insurance
- −$73
- HOA
- −$0
- Vacancy / Maint / Mgmt
- −$331
- Net cashflow
- $172
Break-even live
Sensitivity live
| Price | -10% $271 | -5% $221 | +0% $172 | +5% $122 | +10% $72 |
|---|---|---|---|---|---|
| Rent | -10% $47 | -5% $109 | +0% $172 | +5% $234 | +10% $296 |
| Rate | -1.0pp $260 | -0.5pp $216 | base $172 | +0.5pp $126 | +1.0pp $80 |
UW: 25.0% down · 7.5% · 30yr · 1.5% tax · 5.0% vac · 8.0% maint · 8.0% mgmt
Financing live
Cash to close
- Down payment
- $43,750
- Closing costs
- $5,250
- Reserves months
- —
- Total cash needed
- —
Loan-product check · same deal, 3 products live
Conventional
25% down · 7.5% · 30yr
- Down + closing
- —
- Monthly P&I
- —
- Monthly cashflow
- —
- DSCR
- —
- Eligible?
- —
Personal DTI + credit; lowest rate.
DSCR
20% down · 8.5% · 30yr
- Down + closing
- —
- Monthly P&I
- —
- Monthly cashflow
- —
- DSCR
- —
- Eligible?
- —
No personal income docs; deal must DSCR.
Hard money
10% down · 12.0% · 12mo
- Down + closing
- —
- Monthly P&I
- —
- Monthly cashflow
- —
- DSCR
- —
- Eligible?
- —
Short-term bridge; refi at stabilization.
Rent comps 19 comps
| Address | Beds | Baths | Sqft | Rent | $/sqft | DOM | Units | Dist |
|---|---|---|---|---|---|---|---|---|
| 4464 Winchester Hills Way Birmingham, AL | 3.0 | 2.0 | 1178 | $1,750 | $1.49 | 45d | 1 | 0.08mi |
| 4464 Winchester Hills Ln Pinson, AL | 3.0 | 2.0 | 1500 | $1,750 | $1.17 | 13d | 1 | 0.08mi |
| 1104 Oak Creek Trl NE Birmingham, AL | 3.0 | 2.0 | 1233 | $1,543 | $1.25 | 3d | 1 | 0.30mi |
| 5764 Desoto Dr Pinson, AL | 3.0 | 1.5 | 1104 | $1,225 | $1.11 | 3d | 1 | 0.73mi |
| 2708 7th St NE Center Point, AL | 3.0 | 1.0 | 1451 | $1,150 | $0.79 | 45d | 1 | 0.86mi |
| 2415 Ormond Dr Center Point, AL | 3.0 | 1.5 | 1194 | $1,295 | $1.08 | 45d | 1 | 0.91mi |
| 2504 Beechwood Trl Pinson, AL | 3.0 | 2.0 | 1359 | $1,435 | $1.06 | 23d | 1 | 0.93mi |
| 5944 Tyler Loop Rd Pinson, AL | 3.0 | 2.0 | 1247 | $1,485 | $1.19 | 25d | 1 | 1.03mi |
| 3309 Chase Ln Unit 3309 Birmingham, AL | 2.0 | 2.0 | 1068 | $1,000 | $0.94 | 45d | 1 | 1.11mi |
| 4246 Centerwood Dr Birmingham, AL | 3.0 | 2.0 | 1336 | $1,450 | $1.09 | 17d | 1 | 1.12mi |
| 3073 Panorama E Birmingham, AL | 1.0–3.0 | 1.0–2.0 | 975 | $1,275 | $1.31 | 3d | 20 | 1.16mi |
| 2537 3rd St NE Center Point, AL | 3.0 | 2.0 | 1040 | $1,350 | $1.30 | 25d | 1 | 1.19mi |
| 2629 Wood Dr NE Center Point, AL | 3.0 | 1.0 | 1203 | $1,250 | $1.04 | 45d | 1 | 1.26mi |
| 149 Martin Dr Birmingham, AL | 3.0 | 2.0 | 1164 | $1,485 | $1.28 | 25d | 1 | 1.28mi |
| 2249 4th Place Cir NE Center Point, AL | 3.0 | 1.5 | 1400 | $1,400 | $1.00 | 45d | 1 | 1.43mi |
| 2561 Gaylon St Birmingham, AL | 3.0 | 1.5 | 1318 | $1,345 | $1.02 | 23d | 1 | 1.46mi |
| 332 23rd Ave NE Center Point, AL | 3.0 | 1.0 | 1100 | $1,350 | $1.23 | 4d | 1 | 1.46mi |
| 2358 Grayson Valley Cir Birmingham, AL | 3.0 | 3.0 | 1320 | $1,503 | $1.14 | 13d | 1 | 1.47mi |
| 2350 Grayson Valley Cir Birmingham, AL | 3.0 | 2.5 | 1380 | $1,595 | $1.16 | 45d | 1 | 1.49mi |
Listing history 2 events
-
2026-06-22remarks 699-char remark
-
2026-06-22$175,000 Active 1 DOM
ⓘ Source: listings_history table (triggers on properties + properties_extension) + one-shot
backfill from property_details.listing_events for pre-trigger history.
Tax reassessment forecast AL · Resets to sale price
- Current annual tax
- $1,006 · $84/mo
- Projected year-2 tax
- $1,006 · $84/mo
- Expected delta
- $0/yr ($0/mo · -0.0%)
ⓘ Screening estimate from a state-policy table — verify with the county assessor before closing.
Climate risk First Street
- Flood 1/10 Low FEMA zone X (unshaded) · 0% chance over 30 yrs
- Wildfire 4/10 Moderate
- Heat 6/10 Major 7 d/yr ≥105°F today · 20 d/yr by 30 yrs out
- Wind 6/10 Major 27% chance of damaging wind over 30 yrs
- Air quality 5/10 Major 6 unhealthy d/yr today · 11 by 30 yrs out
Nearby sold comps map
Loading sold comps map…
Walkable amenities ~0.75 mi
Loading nearby amenities…
Taxation est. · year 1
- Rental income
- $18,927
- − Mortgage interest
- −$9,803
- − Property taxes
- −$1,006
- − Insurance
- −$875
- − Repairs & maintenance
- −$1,514
- − Management
- −$1,514
- − Depreciation
- −$5,091
- Taxable loss
- −$876
- Est. tax savings @ 24.0%
- +$210
- After-tax cash flow
- $2,269/yr
For passive investors: Depreciation is non-cash, so a rental often shows a tax loss while cash-flowing — sheltering income. Rental losses are passive: they offset passive income freely, and up to $25,000/yr can offset ordinary (W-2) income if you actively participate and your MAGI is under $100k (phasing out to $0 by $150k); unused losses carry forward. On sale, claimed depreciation is recaptured at up to 25%, and gains may owe capital-gains tax (a 1031 exchange can defer both). Figures are a year-1 estimate at your 24.0% rate — not tax advice; consult a CPA.
Schools (NCES district)
- District
- Jefferson County
- NCES district ID
- 0101920
- Math proficiency
- 9% ▼ -24.00%
- Reading proficiency
- 32% ▼ -5.00%
- Median HH income
- $51,712
- Composite
- 18.4/100
- National rank
- #8937
- State rank
- #104 of 129 in AL
Livability — Clay
- Score
- 75/100
- State rank
- #16
- US rank
- #3849
Category grades
Schools grade is shown separately in the Schools card above.
Census & demographics
- Census place
- Clay, AL
- County
- Jefferson County · 527,445 people
- Metro
- Birmingham-Hoover, AL
- Population (ZIP)
- 43,903
- Household income
- $52,793
- Rent vs Own
- Severe rent burden
- 1729.0
Population outlook (Jefferson County) Hauer SSP2
- Today (2025)
- 669,185 people
- By 2030
- 669,694 · +0.1%
- By 2040
- 661,388 · -1.2%
- By 2050
- 643,086 · -3.9%
- By 2075
- 577,267 · -13.7%
- By 2100
- 474,758 · -29.1%
Race, ethnicity, and origin ACS 2023
- Neighborhood character
- Predominantly Black (75%)
- Race & ethnicity
- Black 75% White 15% Hispanic / Latino 7% Two or more races 3%
- Hispanic origin (detail)
- Mexican 4%
- Common ancestry
- Lithuanian 1% Italian 1% Slovak 1%
- Foreign-born
- 4% · Canada
- Languages at home
- 92% English-only · Spanish 7%
Political lean MEDSL · Jefferson
- 2024 margin
- D (+10.4) · D 54.6% · R 44.2% · Other 1.2%
- 2008→2024 swing
- +5.4pp toward D · 2008: 5.1pp · 2024: 10.4pp
- All cycles
- 2024: D+10.4 2020: D+13.2 2016: D+7.2 2012: D+6.0 2008: D+5.1
Not yet ingested
- Civics
- —
Market trends
- HPI YoY
- ▼ -112.97%
- Current HPI
- 215.0607
- Rent YoY
- ▲ 3.04%
- Metro
- Birmingham-Hoover, AL
- State GDP YoY
- ▲ 2.94%
- F500 in state
- 4
Industry mix (Fortune 500 HQ in AL)
| Industry | F500 HQs | Revenue |
|---|---|---|
| Financial Services | 1 | $8B |
|
||
| Healthcare | 1 | $5B |
|
||
Price history
-77.2% since first listed2 events — show timeline
- 2026-06-20 Listed $175,000 Greater Alabama MLS
- 2013-02-13 Sold (Public Records) $768,839 Public Records
Property tax history
+16.0%/yrLatest (2025): $1,006 · +2.2% YoY. Source: county tax records.
Cash-flow waterfall
monthlySold comps — $/sqft
last 12 mo · ≤1 miLoading sold comps…