45514 Ohio St · Lake Kathryn, FL
Flood risk 1/10 · Minimal
- FEMA flood zone
- X (shaded)
- Chance of flooding over 30 yrs
- 0.0%
- Est. flood insurance / yr
- $507 – $1,088
Fire risk 6/10 · Moderate
- Est. fire insurance / yr
- $947 – $1,759
Heat risk 8/10 · Major
- Hot days now (above 107°F)
- 7 days/yr
- Hot days in 30 yrs
- 20 days/yr
Wind risk 9/10 · Severe
- Chance of severe wind over 30 yrs
- 99.0%
Air-quality risk 2/10 · Minimal
- Unhealthy air days now
- 1 days/yr
- Unhealthy air days in 30 yrs
- 1 days/yr
Risk factors via First Street. Map © Google.
Why this score? — see what drove the B+ grade
The composite is a weighted blend of 9 inputs, each scored 0–100. Each bar is that input's sub-score; the figure is the points it added to the 100-point composite (weight × sub-score).
- Cash flow +30.0/30.0
- 1% rule +10.0/10.0
- DSCR +10.0/10.0
- Appreciation +10.0/10.0
- ARV discount +7.5/15.0
- Schools +4.2/10.0
- Rent growth +2.5/5.0
- Condition / age +2.5/5.0
- Livability +2.3/5.0
$59,000
🖨 Deal sheet 📄 Offer letter ✓ Due diligence
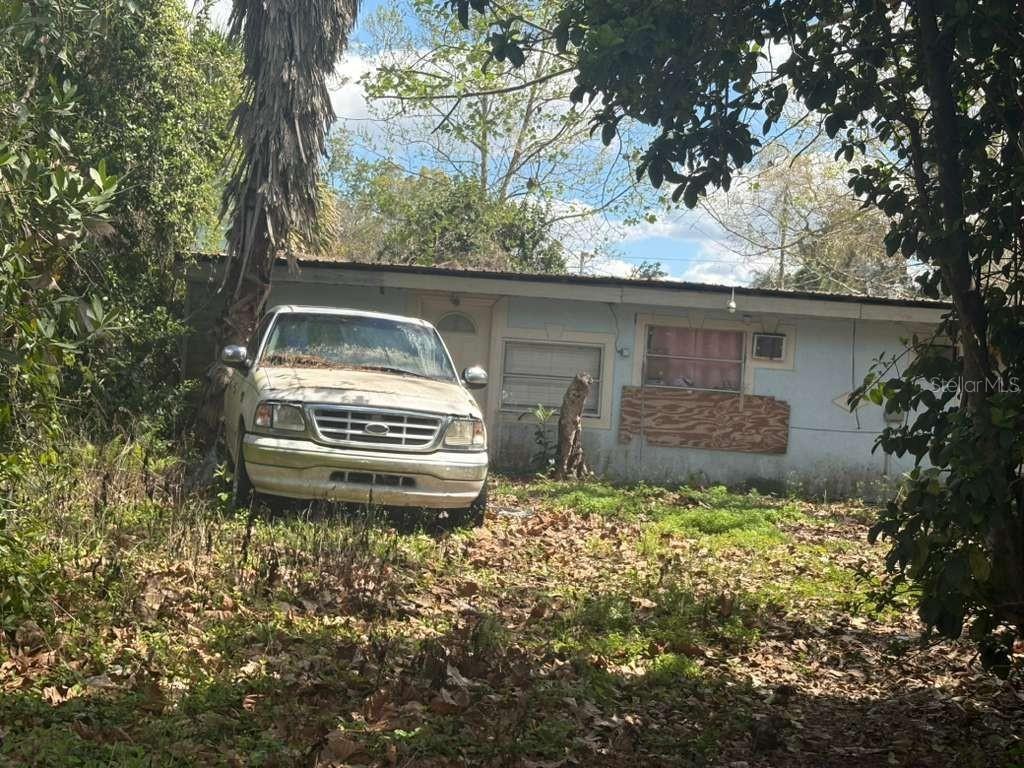
Listing remarks
Handyman Special / Investment Opportunity in Lake County. Located in the growing Lake Kathryn Heights subdivision, this 1958 custom home offers a fantastic opportunity for investors or renovators, whether you choose to repair, remodel, or pursue a full teardown, this is your opportunity to own a piece of Florida, surrounded by natural beauty, lakes, natural springs, and abundant outdoor recreation. Just minutes from the Ocala National Forest, this location provides the perfect balance between tranquility and convenience. Competitively priced to sell fast
Key facts
- Outdoor recreation
- Lake kathryn heights
- 0.25 acre lot
Tags
Property features AI
Finance
- Other: Zoning: R-7; Direction faces: South
- Financial info: No lease restrictions; Unfurnished
- HOA & community: No HOA/association
Exterior
- Parking: No parking details provided
- Security: No security features listed
- Utilities: Public utilities; Septic tank for sewer; No water source listed
- Home design: Residential mobile home (single wide); One story; South-facing
- Construction: Frame construction; Membrane roof; Crawlspace foundation; Built area about 800 sq ft
- Exterior features: Asphalt road access; Lot approximately 0.25 acre
Interior
- Kitchen: No appliances listed
- Bedrooms: 2 bedrooms
- Flooring: Other flooring
- Bathrooms: 1 full bathroom
- Heating & cooling: No central heating; Wall/Window unit(s) for cooling
- Interior features: Other interior features
- Laundry & utility: No laundry facilities
Neighborhood map
What this means for you Summary
Snapshot
- This is a 2-bed/1.0-bath single-family listed at $59k.
Deal economics
- At list price, monthly cash flow is $401 ($5k/yr) — positive.
- The deal already cash-flows at list — no discount required.
- Meets the 1% rule at list price ($1k rent vs $59k).
- Recommended offer: $55k (6.0% below list) — sets the bar for market timing.
Location & tenants
- Location reads 46/100 on livability (#896 in FL) — a working-class tenant base; expect higher turnover. Strengths: crime A, cost of living B; Watch: schools F, amenities F, commute F.
- Lake (suburban): math 49% / reading 50% proficiency, ranked #37 of 73 in FL (top 51%) — families likely to look elsewhere, expect single-tenant / working-renter base with shorter leases.
- Market conditions: 81 active listings in the ZIP; 4,799 units permitted in Lake County in 2024 (814 in 5+ unit buildings).
Forward outlook
- In year one you build about $6k of equity ($408 loan paydown + $6k appreciation (10.0% local appreciation)).
- Lake County population projected at +37% by 2050 — long-run rental-demand tailwind backs the buy-and-hold thesis.
- At projected returns (10.0% appreciation + 3.0% rent growth), your $17k cash investment doubles in ~2 years — after that, you're playing with house money.
- By year 6, paydown + projected appreciation supports a ~$37k cash-out refi (75% LTV) — recoverable capital for the next deal without selling this one.
Negotiation context
- It's been on market 61 days — a 6% lower offer ($55k) is reasonable based on typical stale-listing flexibility.
- Current owner paid $20k; list at $59k implies a 195% gain — meaningful room to come down on a strong offer.
Risks & watch-outs
- Watch-outs: built in 1958 — expect roof / HVAC / electrical / plumbing capex.
- Climate carrying-cost: severe wind risk, 99% chance of damaging wind over 30y; major wildfire risk; extreme-heat days projected 7→20/yr by 2055 (HVAC capex compounding) — expect insurance premiums to compound above CPI over the hold.
Questions for the listing agent
- It's been on market 61 days. Have you received any prior offers? Is the seller open to a 6% concession, seller financing, or rate buy-down credit?
- Built in 1958 — when were the roof, HVAC, electrical panel, plumbing, and water heater last replaced?
- Why hasn't it sold? Are there any deal-killer items the seller is aware of (foundation, flood, title, zoning, code violations)?
- Is there a deadline driving the sale (1031 exchange, divorce, estate, relocation)? That informs how much negotiation room exists.
- Schools are F-rated, which usually means shorter tenancies and higher turnover. Who's the typical renter profile here, and what's been the actual vacancy rate?
- What's the average days-on-market for RENTAL listings here right now (not sales)? A rising rental-DOM trend means longer vacancies and softer asking-rent achievability than the comps imply.
- What's the recent tenant-quality profile in this submarket — average credit score on applications, eviction rate, late-payment / NSF rate, and stable-employment percentage? A property-management company in the area should have these aggregated.
- How much new for-sale + rental construction is in the pipeline within 1–3 miles? Heavy new supply typically softens prices + rents 12–24 months out; constrained supply supports both.
Investment metrics
- 1% rule
- 1.83% ✓
- Cap rate
- 14.45%
- Cash-on-cash
- 29.15%
- DSCR
- 2.30
- GRM
- 4.5
CMA / ARV
- ARV (on-the-fly)
- $238,896
- Comps found
- 2
Show comp detail 2 sales within ~0.75 mi
| Address | Dist | Beds/Ba | Sqft | Sold | Price | $/sf | Match |
|---|---|---|---|---|---|---|---|
| 27535 Corrine Ave | 0.46mi | 2/2.0 | 784 (+4%) | 14mo | $50,000 | $64 | 57 |
| 27830 Kathryn Cir | 0.23mi | 2/2.0 | 852 (+13%) | 24mo | $269,383 | $316 | 44 |
Match score weights: distance 35% · size 25% · config 20% · recency 20%. Top-matched comps best support the ARV.
Projected returns pro-forma
10.0% appreciation · 3.0% rent growth · sell at horizon
- IRR
- 46.4%
- Equity multiple
- 4.49×
- Total profit
- $57,733
- Equity at exit
- $53,152
- IRR
- 40.3%
- Equity multiple
- 10.08×
- Total profit
- $150,007
- Equity at exit
- $114,624
Cash invested: $16,520 (down + closing). Projections, not guarantees.
Landlord ↔ Tenant lean methodology
- Overall (STATE)
- 87 Strongly Landlord-Friendly
- State Florida
- 87 Strongly Landlord-Friendly · R+3
- County
- — inherits STATE
- City
- — inherits STATE
ZIP-level market 32767
- Home prices YoY
- 3.0%
- Active inventory
- 81
- Price-to-rent
- 4.5×
Monthly cashflow live
- Estimated rent
- $1,082 medium interval (Pro) →
- Mortgage (P&I)
- −$309
- Tax from tax record
- −$119 /mo · $1,434/yr
- Insurance
- −$25
- HOA
- −$0
- Vacancy / Maint / Mgmt
- −$227
- Net cashflow
- $401
Break-even live
UW: 25.0% down · 7.5% · 30yr · 1.5% tax · 5.0% vac · 8.0% maint · 8.0% mgmt
Financing live
Cash to close
- Down payment
- $14,750
- Closing costs
- $1,770
- Reserves months
- —
- Total cash needed
- —
Loan-product check · same deal, 3 products live
Conventional
25% down · 7.5% · 30yr
- Down + closing
- —
- Monthly P&I
- —
- Monthly cashflow
- —
- DSCR
- —
- Eligible?
- —
Personal DTI + credit; lowest rate.
DSCR
20% down · 8.5% · 30yr
- Down + closing
- —
- Monthly P&I
- —
- Monthly cashflow
- —
- DSCR
- —
- Eligible?
- —
No personal income docs; deal must DSCR.
Hard money
10% down · 12.0% · 12mo
- Down + closing
- —
- Monthly P&I
- —
- Monthly cashflow
- —
- DSCR
- —
- Eligible?
- —
Short-term bridge; refi at stabilization.
Listing history 5 events
-
2026-06-01days on market $59,000 Active 61 DOM
-
2026-05-31days on market $59,000 Active 60 DOM
-
2026-04-01$59,000 Active
-
1997-02-03soldstatus $20,000
-
1994-08-16soldstatus $6,500
ⓘ Source: listings_history table (triggers on properties + properties_extension) + one-shot
backfill from property_details.listing_events for pre-trigger history.
Tax reassessment forecast FL · Resets to sale price
- Current annual tax
- $1,434 · $119/mo
- Projected year-2 tax
- $1,434 · $119/mo
- Expected delta
- $0/yr ($0/mo · 0.0%)
ⓘ Screening estimate from a state-policy table — verify with the county assessor before closing.
Climate risk First Street
- Flood 1/10 Low FEMA zone X (shaded) · 0% chance over 30 yrs
- Wildfire 6/10 Major
- Heat 8/10 Severe 7 d/yr ≥107°F today · 20 d/yr by 30 yrs out
- Wind 9/10 Extreme 99% chance of damaging wind over 30 yrs
- Air quality 2/10 Low 1 unhealthy d/yr today · 1 by 30 yrs out
Nearby sold comps map
Loading sold comps map…
Walkable amenities ~0.75 mi
Loading nearby amenities…
Taxation est. · year 1
- Rental income
- $12,983
- − Mortgage interest
- −$3,305
- − Property taxes
- −$1,434
- − Insurance
- −$295
- − Repairs & maintenance
- −$1,039
- − Management
- −$1,039
- − Depreciation
- −$1,716
- Taxable income
- $4,156
- Est. tax owed @ 24.0%
- −$997
- After-tax cash flow
- $3,818/yr
For passive investors: Depreciation is non-cash, so a rental often shows a tax loss while cash-flowing — sheltering income. Rental losses are passive: they offset passive income freely, and up to $25,000/yr can offset ordinary (W-2) income if you actively participate and your MAGI is under $100k (phasing out to $0 by $150k); unused losses carry forward. On sale, claimed depreciation is recaptured at up to 25%, and gains may owe capital-gains tax (a 1031 exchange can defer both). Figures are a year-1 estimate at your 24.0% rate — not tax advice; consult a CPA.
Schools (NCES district)
- District
- Lake
- NCES district ID
- 1201050
- Math proficiency
- 49% ▼ -7.00%
- Reading proficiency
- 50% ▼ -4.00%
- Median HH income
- $46,632
- Composite
- 42.05/100
- National rank
- #3327
- State rank
- #37 of 73 in FL
Livability — Lake Kathryn
- Score
- 46/100
- State rank
- #896
- US rank
- #26433
Category grades
Schools grade is shown separately in the Schools card above.
Census & demographics
- Census place
- Lake Kathryn, FL
- Population (ZIP)
- 2,839
Population outlook (Lake County) Hauer SSP2
- Today (2025)
- 386,640 people
- By 2030
- 417,107 · +7.9%
- By 2040
- 476,676 · +23.3%
- By 2050
- 531,296 · +37.4%
- By 2075
- 648,303 · +67.7%
- By 2100
- 698,530 · +80.7%
Race, ethnicity, and origin ACS 2023
- Neighborhood character
- Predominantly White (96%)
- Race & ethnicity
- White 96% Hispanic / Latino 2% Two or more races 1%
- Common ancestry
- Italian 3% Russian 3% Lithuanian 1%
- Foreign-born
- 1%
- Languages at home
- 98% English-only · Spanish 2%
Political lean MEDSL · Lake
- 2024 margin
- Strong R (+24.7) · D 37.3% · R 62.0%
- 2008→2024 swing
- -11.2pp toward R · 2008: -13.5pp · 2024: -24.7pp
- All cycles
- 2024: R+24.7 2020: R+20.0 2016: R+23.1 2012: R+17.1 2008: R+13.5
Not yet ingested
- Civics
- —
Market trends
- HPI YoY
- ▲ 11.00%
- Current HPI
- 372.7
- Rent YoY
- —
- Metro
- —
- State GDP YoY
- ▲ 3.28%
- F500 in state
- 36
Industry mix (Fortune 500 HQ in FL)
| Industry | F500 HQs | Revenue |
|---|---|---|
| Industrial Technology | 2 | $29B |
|
||
| Insurance | 2 | $17B |
|
||
| Retail | 1 | $60B |
|
||
| Technology Distribution | 1 | $58B |
|
||
| Homebuilding | 1 | $35B |
|
||
| Technology Manufacturing | 1 | $35B |
|
||
Price history
+807.7% since first listed3 events — show timeline
- 2026-04-01 Listed $59,000 Stellar MLS as Distributed by MLS Grid
- 1997-02-03 Sold (Public Records) $20,000 Public Records
- 1994-08-16 Sold (Public Records) $6,500 Public Records
Property tax history
+9.3%/yrLatest (2025): $1,434 · +3.5% YoY. Source: county tax records.
Cash-flow waterfall
monthlySold comps — $/sqft
last 12 mo · ≤1 miLoading sold comps…