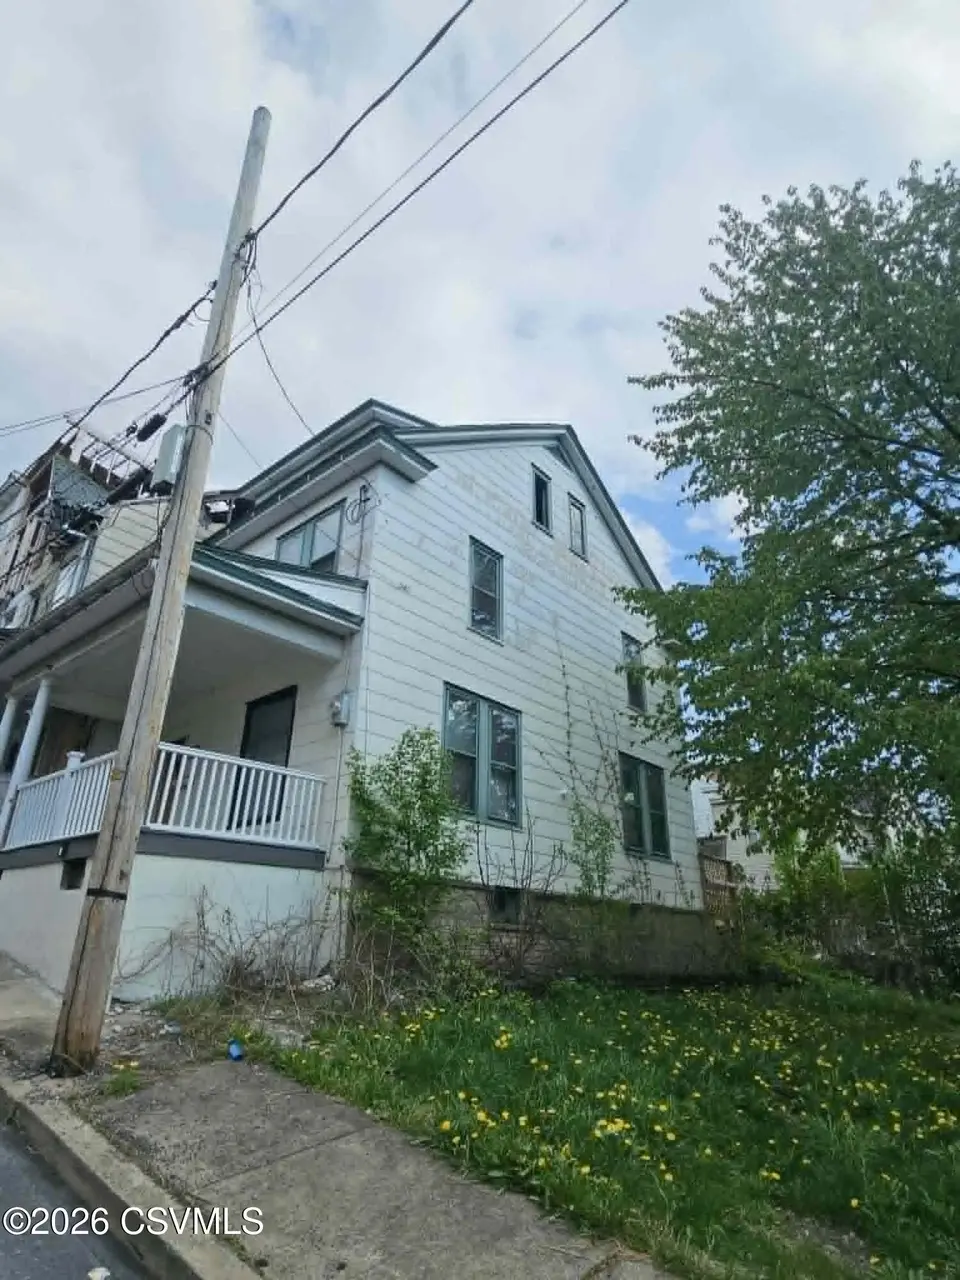
110 Birch St · Shamokin, PA
Flood risk 1/10 · Minimal
- FEMA flood zone
- X (unshaded)
- Chance of flooding over 30 yrs
- 0.0%
- Est. flood insurance / yr
- $507 – $1,088
Fire risk 3/10 · Minor
- Est. fire insurance / yr
- $511 – $949
Heat risk 5/10 · Moderate
- Hot days now (above 94°F)
- 8 days/yr
- Hot days in 30 yrs
- 17 days/yr
Wind risk 2/10 · Minimal
- Chance of severe wind over 30 yrs
- 3.0%
Air-quality risk 2/10 · Minimal
- Unhealthy air days now
- 1 days/yr
- Unhealthy air days in 30 yrs
- 2 days/yr
Risk factors via First Street. Map © Google.
Why this score? — see what drove the B- grade
The composite is a weighted blend of 9 inputs, each scored 0–100. Each bar is that input's sub-score; the figure is the points it added to the 100-point composite (weight × sub-score).
- Cash flow +30.0/30.0
- DSCR +10.0/10.0
- 1% rule +8.5/10.0
- Appreciation +6.0/10.0
- Livability +3.4/5.0
- Rent growth +2.5/5.0
- Condition / age +2.5/5.0
- Schools +2.4/10.0
- ARV discount +0.0/15.0
$68,900
🖨 Deal sheet 📄 Offer letter ✓ Due diligence
Listing remarks
Bring your ideas to this spacious 2 and 1/2 story home. Large living and dining room with a galley style kitchen which needs completed. Upstairs has a large bathroom and 3 spacious bedrooms plus the possibility of another bedroom in the upper level. This home has newly sheet rocked walls and ceilings along with some newer replacement windows and a rear deck along with an extra side lot for off street parking availability! Home needs some finishing touches! Call Freda for a showing today at 570-259 2428
Key facts
- Rear deck
- Extra side lot
- Galley style kitchen
Tags
Property features AI
Finance
- Other: Residential zoning
Exterior
- Parking: Off-street parking potential; See remarks for parking details
- Utilities: Public water; Public sewer; Electric with circuit breakers
- Home design: Single family residence (Residential property); 1,200 above-grade finished area; 50 x 60 lot dimensions
- Construction: Shingle roof; Construction includes asbestos (see remarks); No foundation details listed
- Exterior features: Deck; Porch; Sidewalks
Interior
- Kitchen: No appliances listed
- Bedrooms: Total of 7 rooms (bedrooms and other living spaces combined)
- Bathrooms: 1 three-quarter bathroom
- Heating & cooling: Baseboard heating; Ceiling fan(s) for cooling
- Interior features: Ceiling fan(s); Unfinished basement
Neighborhood map
What this means for you Summary
Snapshot
- This is a 3-bed/1.0-bath land listed at $69k.
Deal economics
- At list price, monthly cash flow is $257 ($3k/yr) — positive.
- The deal already cash-flows at list — no discount required.
- Meets the 1% rule at list price ($928 rent vs $69k).
- Recommended offer: $67k (3.0% below list) — sets the bar for market timing.
Location & tenants
- Location reads 68/100 on livability (#887 in PA) — a middle-class / working-renter tenant base. Strengths: amenities A+, cost of living A+, housing A+; Watch: schools D, commute F, employment F.
- Shamokin Area SD (town): math 19% / reading 40% proficiency, ranked #450 of 539 in PA (top 84%) — low school quality limits family demand, transient renter base, plan for 1-2y turnover.
- Market conditions: 76 active listings in the ZIP; 6 comparable units currently listed for rent nearby; rentals lingering (median 44d on market — plan ~5-8 weeks vacancy on turnover, expect pricing pressure); 100% of comp listings sitting > 30 days — soft ceiling on asking rent; 81 units permitted in Northumberland County in 2024 (0 in 5+ unit buildings).
Forward outlook
- In year one you build about $2k of equity ($476 loan paydown + $1k appreciation (1.9% local appreciation)).
- Northumberland County population projected at -11% by 2050 — secular population decline; favor cash flow + early exit over multi-decade hold.
- At projected returns (1.9% appreciation + 3.0% rent growth), your $19k cash investment doubles in ~4 years — after that, you're playing with house money.
Negotiation context
- It's been on market 53 days — a 3% lower offer ($67k) is reasonable based on typical stale-listing flexibility.
- 2 sale attempts since 4y ago with the ask held roughly flat each time — persistent listings suggest the price (not the market) is what's stuck; bring a comps-based counter.
Risks & watch-outs
- Watch-outs: built in 1900 — expect roof / HVAC / electrical / plumbing capex.
- Climate carrying-cost: extreme-heat days projected 8→17/yr by 2055 (HVAC capex compounding) — expect insurance premiums to compound above CPI over the hold.
Questions for the listing agent
- It's been on market 53 days. Have you received any prior offers? Is the seller open to a 3% concession, seller financing, or rate buy-down credit?
- Built in 1900 — when were the roof, HVAC, electrical panel, plumbing, and water heater last replaced?
- Is there a deadline driving the sale (1031 exchange, divorce, estate, relocation)? That informs how much negotiation room exists.
- Schools are D-rated, which usually means shorter tenancies and higher turnover. Who's the typical renter profile here, and what's been the actual vacancy rate?
- What's the average days-on-market for RENTAL listings here right now (not sales)? A rising rental-DOM trend means longer vacancies and softer asking-rent achievability than the comps imply.
- What's the recent tenant-quality profile in this submarket — average credit score on applications, eviction rate, late-payment / NSF rate, and stable-employment percentage? A property-management company in the area should have these aggregated.
- How much new for-sale + rental construction is in the pipeline within 1–3 miles? Heavy new supply typically softens prices + rents 12–24 months out; constrained supply supports both.
Investment metrics
- 1% rule
- 1.35% ✓
- Cap rate
- 10.77%
- Cash-on-cash
- 16.00%
- DSCR
- 1.71
- GRM
- 6.2
CMA / ARV
- ARV (median comp)
- $52,535
- List price
- $68,900
- Delta
- 31.15%
- Verdict
- OVERPRICED
- Comps
- 20 within 1.0 mi
Projected returns pro-forma
1.9% appreciation · 3.0% rent growth · sell at horizon
- IRR
- 20.1%
- Equity multiple
- 2.08×
- Total profit
- $20,784
- Equity at exit
- $26,818
- IRR
- 22.3%
- Equity multiple
- 3.91×
- Total profit
- $56,154
- Equity at exit
- $38,345
Cash invested: $19,292 (down + closing). Projections, not guarantees.
Landlord ↔ Tenant lean methodology
- Overall (STATE)
- 62 Landlord-Friendly
- State Pennsylvania
- 62 Landlord-Friendly · EVEN
- County
- — inherits STATE
- City
- — inherits STATE
ZIP-level market 17872
- Home prices YoY
- 1.6%
- Active inventory
- 76
- Price-to-rent
- 6.2×
Monthly cashflow live
- Estimated rent
- $928 high interval (Pro) →
- Mortgage (P&I)
- −$361
- Tax est. 1.5%
- −$86 /mo · $1,034/yr
- Insurance
- −$29
- HOA
- −$0
- Vacancy / Maint / Mgmt
- −$195
- Net cashflow
- $257
Break-even live
UW: 25.0% down · 7.5% · 30yr · 1.5% tax · 5.0% vac · 8.0% maint · 8.0% mgmt
Financing live
Cash to close
- Down payment
- $17,225
- Closing costs
- $2,067
- Reserves months
- —
- Total cash needed
- —
Loan-product check · same deal, 3 products live
Conventional
25% down · 7.5% · 30yr
- Down + closing
- —
- Monthly P&I
- —
- Monthly cashflow
- —
- DSCR
- —
- Eligible?
- —
Personal DTI + credit; lowest rate.
DSCR
20% down · 8.5% · 30yr
- Down + closing
- —
- Monthly P&I
- —
- Monthly cashflow
- —
- DSCR
- —
- Eligible?
- —
No personal income docs; deal must DSCR.
Hard money
10% down · 12.0% · 12mo
- Down + closing
- —
- Monthly P&I
- —
- Monthly cashflow
- —
- DSCR
- —
- Eligible?
- —
Short-term bridge; refi at stabilization.
Rent comps 6 comps
| Address | Beds | Baths | Sqft | Rent | $/sqft | DOM | Units | Dist |
|---|---|---|---|---|---|---|---|---|
| 11 S Market St Fl Rear Shamokin, PA | 3.0 | 1.0 | 950 | $1,000 | $1.05 | 43d | 1 | 0.20mi |
| 11 S Market St Apt B Rear Shamokin, PA | 2.0 | 1.0 | 1100 | $900 | $0.82 | 43d | 1 | 0.20mi |
| 2 S Vine St Shamokin, PA | 3.0 | 1.0 | 1450 | $975 | $0.67 | 43d | 1 | 0.33mi |
| 863 W Spruce St Coal Township, PA | 2.0 | 1.0 | 1200 | $695 | $0.58 | 43d | 1 | 0.62mi |
| 804 W Mulberry St Coal Township, PA | 3.0 | 1.0 | 1350 | $1,075 | $0.80 | 43d | 1 | 0.62mi |
| 1309 W Spruce St Coal Township, PA | 3.0 | 1.0 | 1275 | $825 | $0.65 | 43d | 1 | 0.94mi |
Listing history 20 events
-
2026-06-19days on market $68,900 Active 53 DOM
-
2026-06-18days on market $68,900 Active 52 DOM
-
2026-06-17days on market $68,900 Active 51 DOM
-
2026-06-16days on market $68,900 Active 50 DOM
-
2026-06-15days on market $68,900 Active 49 DOM
-
2026-06-14days on market $68,900 Active 47 DOM
-
2026-06-12days on market $68,900 Active 46 DOM
-
2026-06-09days on market $68,900 Active 43 DOM
-
2026-06-08days on market $68,900 Active 42 DOM
-
2026-06-07days on market $68,900 Active 41 DOM
-
2026-06-03days on market $68,900 Active 37 DOM
-
2026-06-02days on market $68,900 Active 36 DOM
-
2026-06-01days on market $68,900 Active 35 DOM
-
2026-05-31days on market $68,900 Active 34 DOM
-
2026-05-30days on market $68,900 Active 33 DOM
-
2026-04-27$68,900 Active 510-char remark
-
2022-12-15historical
-
2022-11-09price $15,000
-
2022-10-26price $19,400
-
2022-10-18$19,900 Active
ⓘ Source: listings_history table (triggers on properties + properties_extension) + one-shot
backfill from property_details.listing_events for pre-trigger history.
Climate risk First Street
- Flood 1/10 Low FEMA zone X (unshaded) · 0% chance over 30 yrs
- Wildfire 3/10 Moderate
- Heat 5/10 Major 8 d/yr ≥94°F today · 17 d/yr by 30 yrs out
- Wind 2/10 Low 3% chance of damaging wind over 30 yrs
- Air quality 2/10 Low 1 unhealthy d/yr today · 2 by 30 yrs out
Nearby sold comps map
Loading sold comps map…
Walkable amenities ~0.75 mi
Loading nearby amenities…
Taxation est. · year 1
- Rental income
- $11,140
- − Mortgage interest
- −$3,859
- − Property taxes
- −$1,034
- − Insurance
- −$344
- − Repairs & maintenance
- −$891
- − Management
- −$891
- − Depreciation
- −$2,004
- Taxable income
- $2,116
- Est. tax owed @ 24.0%
- −$508
- After-tax cash flow
- $2,579/yr
For passive investors: Depreciation is non-cash, so a rental often shows a tax loss while cash-flowing — sheltering income. Rental losses are passive: they offset passive income freely, and up to $25,000/yr can offset ordinary (W-2) income if you actively participate and your MAGI is under $100k (phasing out to $0 by $150k); unused losses carry forward. On sale, claimed depreciation is recaptured at up to 25%, and gains may owe capital-gains tax (a 1031 exchange can defer both). Figures are a year-1 estimate at your 24.0% rate — not tax advice; consult a CPA.
Schools (NCES district)
- District
- Shamokin Area SD
- NCES district ID
- 4221240
- Math proficiency
- 19% ▼ -13.00%
- Reading proficiency
- 40% ▼ -11.00%
- Median HH income
- $35,380
- Composite
- 24.31/100
- National rank
- #7709
- State rank
- #450 of 539 in PA
Livability — Shamokin
- Score
- 68/100
- State rank
- #887
- US rank
- #9448
Category grades
Schools grade is shown separately in the Schools card above.
Census & demographics
- Census place
- Shamokin, PA
- City population
- 9,808
- Population (ZIP)
- 8,950
Population outlook (Northumberland County) Hauer SSP2
- Today (2025)
- 90,896 people
- By 2030
- 89,084 · -2.0%
- By 2040
- 84,822 · -6.7%
- By 2050
- 80,521 · -11.4%
- By 2075
- 72,152 · -20.6%
- By 2100
- 62,257 · -31.5%
Race, ethnicity, and origin ACS 2023
- Neighborhood character
- Predominantly White (84%)
- Race & ethnicity
- White 84% Two or more races 10% Hispanic / Latino 8% Black 1%
- Hispanic origin (detail)
- Puerto Rican 4%
- Common ancestry
- Romanian 14% Iranian 6% Subsaharan African 1%
- Foreign-born
- 1%
- Languages at home
- 96% English-only · Spanish 3%
Political lean MEDSL · Northumberland
- 2024 margin
- Solid R (+39.9) · D 29.6% · R 69.5%
- 2008→2024 swing
- -26.1pp toward R · 2008: -13.8pp · 2024: -39.9pp
- All cycles
- 2024: R+39.9 2020: R+38.5 2016: R+43.6 2012: R+19.4 2008: R+13.8
Not yet ingested
- Civics
- —
Market trends
- HPI YoY
- ▲ 1.90%
- Current HPI
- 124.6288
- Rent YoY
- —
- Metro
- —
- State GDP YoY
- ▲ 1.68%
- F500 in state
- 34
Industry mix (Fortune 500 HQ in PA)
| Industry | F500 HQs | Revenue |
|---|---|---|
| Healthcare | 2 | $309B |
|
||
| Insurance | 2 | $27B |
|
||
| Telecommunications / Media | 1 | $124B |
|
||
| Industrial Distribution | 1 | $22B |
|
||
| Financial Services | 1 | $20B |
|
||
| Chemicals / Materials | 1 | $18B |
|
||
Price history
+246.2% since first listed5 events — show timeline
- 2026-04-27 Listed $68,900 CSVBR
- 2022-12-15 Listing Removed — BRIGHT MLS
- 2022-11-09 Price Changed $15,000 BRIGHT MLS
- 2022-10-26 Price Changed $19,400 BRIGHT MLS
- 2022-10-18 Listed $19,900 BRIGHT MLS
Property tax history
-11.0%/yrLatest (2026): $135 · +61.5% YoY. Source: county tax records.
Cash-flow waterfall
monthlySold comps — $/sqft
last 12 mo · ≤1 miLoading sold comps…