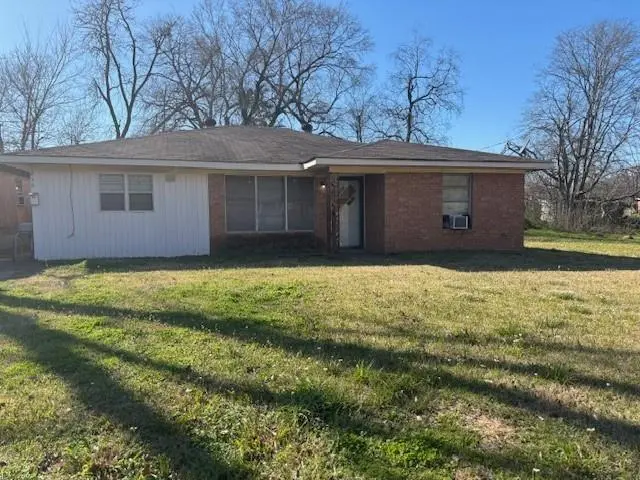
216 Martin Luther King Dr · Natchitoches, LA
Flood risk 1/10 · Minimal
- FEMA flood zone
- X (unshaded)
- Chance of flooding over 30 yrs
- 0.0%
- Est. flood insurance / yr
- $507 – $1,088
Fire risk 3/10 · Minor
- Est. fire insurance / yr
- $1,269 – $2,357
Heat risk 8/10 · Major
- Hot days now (above 113°F)
- 7 days/yr
- Hot days in 30 yrs
- 21 days/yr
Wind risk 8/10 · Major
- Chance of severe wind over 30 yrs
- 80.0%
Air-quality risk 1/10 · Minimal
- Unhealthy air days now
- 0 days/yr
- Unhealthy air days in 30 yrs
- 0 days/yr
Risk factors via First Street. Map © Google.
Why this score? — see what drove the B grade
The composite is a weighted blend of 9 inputs, each scored 0–100. Each bar is that input's sub-score; the figure is the points it added to the 100-point composite (weight × sub-score).
- Cash flow +30.0/30.0
- ARV discount +15.0/15.0
- DSCR +10.0/10.0
- 1% rule +9.8/10.0
- Livability +2.7/5.0
- Schools +2.6/10.0
- Rent growth +2.5/5.0
- Condition / age +2.2/5.0
- Appreciation +0.0/10.0
$80,000
🖨 Deal sheet 📄 Offer letter ✓ Due diligence
Listing remarks MLS
Investor Special - 3 Bedroom, 2 Bath Home on Large Lot Excellent opportunity for investors or renovators. This 3-bedroom, 2-bath home sits on a spacious lot with a large backyard, offering great potential for improvements or expansion. Situated on a spacious lot, the home features a sizable backyard for expansion, outdoor enhancements, or added amenities. The interior provides a functional layout and solid structure, ready for cosmetic and systems upgrades. Home is being sold strictly as-is with no repairs to be made. All offers are subject to approval by the presiding Judge.
Key facts
- Sizable backyard
- Large lot
- Functional layout
Tags
Neighborhood map
What this means for you Summary
Snapshot
- This is a 3-bed/2.0-bath single-family listed at $80k. Condition is rated fair.
Deal economics
- At list price, monthly cash flow is $382 ($5k/yr) — positive.
- The deal already cash-flows at list — no discount required.
- Meets the 1% rule at list price ($1k rent vs $80k).
- Recommended offer: $70k (12.0% below list) — sets the bar for market timing.
- Cap rate 12.0% vs local median 3.6% in Natchitoches — top-decile yield for the area; either an underpriced asset or a hidden risk that comps aren't pricing in. Stress-test before assuming the spread holds.
Location & tenants
- Location reads 54/100 on livability (#382 in LA) — a working-class tenant base; expect higher turnover. Strengths: cost of living A+; Watch: schools C-, health & safety C-, housing D+.
- Natchitoches Parish (town): math 29% / reading 36% proficiency, ranked #41 of 98 in LA (top 42%) — families likely to look elsewhere, expect single-tenant / working-renter base with shorter leases; 69% free/reduced lunch — lower-income household profile, screen leases tightly.
- Market conditions: 158 active listings in the ZIP; 95 units permitted in Natchitoches Parish in 2024 (0 in 5+ unit buildings).
Forward outlook
- Local home prices are declining (-3.0%/yr); year-one equity from $553 of loan paydown is wiped out by about $2k of value loss. Plan a longer hold.
- Natchitoches County population projected at -12% by 2050 — secular population decline; favor cash flow + early exit over multi-decade hold.
- At projected returns (-3.0% appreciation + 3.0% rent growth), your $22k cash investment doubles in ~6 years — after that, you're playing with house money.
Negotiation context
- It's been on market 465 days — a 12% lower offer ($70k) is reasonable based on typical stale-listing flexibility.
Risks & watch-outs
- Climate carrying-cost: severe wind risk, 80% chance of damaging wind over 30y; extreme-heat days projected 7→21/yr by 2055 (HVAC capex compounding) — expect insurance premiums to compound above CPI over the hold.
Questions for the listing agent
- It's been on market 465 days. Have you received any prior offers? Is the seller open to a 12% concession, seller financing, or rate buy-down credit?
- Have any recent inspections been done? Can we get a copy of the seller's disclosures and any deferred-maintenance estimates?
- Built in 1975 — when were the roof, HVAC, electrical panel, plumbing, and water heater last replaced?
- Why hasn't it sold? Are there any deal-killer items the seller is aware of (foundation, flood, title, zoning, code violations)?
- Is there a deadline driving the sale (1031 exchange, divorce, estate, relocation)? That informs how much negotiation room exists.
- Crime grade is F in this area — have there been break-ins, vandalism, or insurance claims at this property in the last 3 years? What carrier currently insures it and at what premium?
- What's the average days-on-market for RENTAL listings here right now (not sales)? A rising rental-DOM trend means longer vacancies and softer asking-rent achievability than the comps imply.
- What's the recent tenant-quality profile in this submarket — average credit score on applications, eviction rate, late-payment / NSF rate, and stable-employment percentage? A property-management company in the area should have these aggregated.
- How much new for-sale + rental construction is in the pipeline within 1–3 miles? Heavy new supply typically softens prices + rents 12–24 months out; constrained supply supports both.
Investment metrics
- 1% rule
- 1.48% ✓
- Cap rate
- 12.03%
- Cash-on-cash
- 20.47%
- DSCR
- 1.91
- GRM
- 5.6
CMA / ARV
- ARV (median comp)
- $147,435
- List price
- $80,000
- Delta
- -45.74%
- Verdict
- UNDERPRICED
- Comps
- 8 within 1.0 mi
Show comp detail 2 sales within ~0.75 mi
| Address | Dist | Beds/Ba | Sqft | Sold | Price | $/sf | Match |
|---|---|---|---|---|---|---|---|
| 709 Bossier St | 0.16mi | 2/1.0 (-1) | 1,347 (-7%) | 23mo | $139,000 | $103 | 53 |
| 306 Williams Ave | 0.68mi | 2/1.5 (-1) | 1,233 (-14%) | 16mo | $316,000 | $256 | 23 |
Match score weights: distance 35% · size 25% · config 20% · recency 20%. Top-matched comps best support the ARV.
Projected returns pro-forma
-3.0% appreciation · 3.0% rent growth · sell at horizon
- IRR
- 12.8%
- Equity multiple
- 1.51×
- Total profit
- $11,396
- Equity at exit
- $11,928
- IRR
- 21.7%
- Equity multiple
- 2.85×
- Total profit
- $41,339
- Equity at exit
- $6,917
Cash invested: $22,400 (down + closing). Projections, not guarantees.
Landlord ↔ Tenant lean methodology
- Overall (STATE)
- 90 Strongly Landlord-Friendly
- State Louisiana
- 90 Strongly Landlord-Friendly · R+12
- County
- — inherits STATE
- City
- — inherits STATE
ZIP-level market 71457
- Active inventory
- 158
- Price-to-rent
- 5.6×
Monthly cashflow live
- Estimated rent
- $1,184 medium interval (Pro) →
- Mortgage (P&I)
- −$420
- Tax est. 1.5%
- −$100 /mo · $1,200/yr
- Insurance
- −$33
- HOA
- −$0
- Vacancy / Maint / Mgmt
- −$249
- Net cashflow
- $382
Break-even live
UW: 25.0% down · 7.5% · 30yr · 1.5% tax · 5.0% vac · 8.0% maint · 8.0% mgmt
Financing live
Cash to close
- Down payment
- $20,000
- Closing costs
- $2,400
- Reserves months
- —
- Total cash needed
- —
Loan-product check · same deal, 3 products live
Conventional
25% down · 7.5% · 30yr
- Down + closing
- —
- Monthly P&I
- —
- Monthly cashflow
- —
- DSCR
- —
- Eligible?
- —
Personal DTI + credit; lowest rate.
DSCR
20% down · 8.5% · 30yr
- Down + closing
- —
- Monthly P&I
- —
- Monthly cashflow
- —
- DSCR
- —
- Eligible?
- —
No personal income docs; deal must DSCR.
Hard money
10% down · 12.0% · 12mo
- Down + closing
- —
- Monthly P&I
- —
- Monthly cashflow
- —
- DSCR
- —
- Eligible?
- —
Short-term bridge; refi at stabilization.
Listing history 18 events
-
2026-06-19days on market $80,000 Active 465 DOM
-
2026-06-18days on market $80,000 Active 464 DOM
-
2026-06-17days on market $80,000 Active 463 DOM
-
2026-06-16days on market $80,000 Active 462 DOM
-
2026-06-15days on market $80,000 Active 461 DOM
-
2026-06-14days on market $80,000 Active 459 DOM
-
2026-06-12days on market $80,000 Active 458 DOM
-
2026-06-09days on market $80,000 Active 455 DOM
-
2026-06-08days on market $80,000 Active 454 DOM
-
2026-06-07days on market $80,000 Active 453 DOM
-
2026-06-07days on market $80,000 Active 452 DOM
-
2026-06-04days on market $80,000 Active 449 DOM
-
2026-06-02days on market $80,000 Active 448 DOM
-
2026-06-01days on market $80,000 Active 447 DOM
-
2026-05-31days on market $80,000 Active 446 DOM
-
2026-05-31days on market $80,000 Active 445 DOM
-
2026-04-14price $80,000 582-char remark
Show marketing remark (582 chars)
Investor Special - 3 Bedroom, 2 Bath Home on Large Lot Excellent opportunity for investors or renovators. This 3-bedroom, 2-bath home sits on a spacious lot with a large backyard, offering great potential for improvements or expansion. Situated on a spacious lot, the home features a sizable backyard for expansion, outdoor enhancements, or added amenities. The interior provides a functional layout and solid structure, ready for cosmetic and systems upgrades. Home is being sold strictly as-is with no repairs to be made. All offers are subject to approval by the presiding Judge.
-
2025-03-11$95,000 Active 582-char remark
Show marketing remark (582 chars)
Investor Special - 3 Bedroom, 2 Bath Home on Large Lot Excellent opportunity for investors or renovators. This 3-bedroom, 2-bath home sits on a spacious lot with a large backyard, offering great potential for improvements or expansion. Situated on a spacious lot, the home features a sizable backyard for expansion, outdoor enhancements, or added amenities. The interior provides a functional layout and solid structure, ready for cosmetic and systems upgrades. Home is being sold strictly as-is with no repairs to be made. All offers are subject to approval by the presiding Judge.
ⓘ Source: listings_history table (triggers on properties + properties_extension) + one-shot
backfill from property_details.listing_events for pre-trigger history.
Climate risk First Street
- Flood 1/10 Low FEMA zone X (unshaded) · 0% chance over 30 yrs
- Wildfire 3/10 Moderate
- Heat 8/10 Severe 7 d/yr ≥113°F today · 21 d/yr by 30 yrs out
- Wind 8/10 Severe 80% chance of damaging wind over 30 yrs
- Air quality 1/10 Low 0 unhealthy d/yr today · 0 by 30 yrs out
Nearby sold comps map
Loading sold comps map…
Walkable amenities ~0.75 mi
Loading nearby amenities…
Taxation est. · year 1
- Rental income
- $14,203
- − Mortgage interest
- −$4,481
- − Property taxes
- −$1,200
- − Insurance
- −$400
- − Repairs & maintenance
- −$1,136
- − Management
- −$1,136
- − Depreciation
- −$2,327
- Taxable income
- $3,522
- Est. tax owed @ 24.0%
- −$845
- After-tax cash flow
- $3,741/yr
For passive investors: Depreciation is non-cash, so a rental often shows a tax loss while cash-flowing — sheltering income. Rental losses are passive: they offset passive income freely, and up to $25,000/yr can offset ordinary (W-2) income if you actively participate and your MAGI is under $100k (phasing out to $0 by $150k); unused losses carry forward. On sale, claimed depreciation is recaptured at up to 25%, and gains may owe capital-gains tax (a 1031 exchange can defer both). Figures are a year-1 estimate at your 24.0% rate — not tax advice; consult a CPA.
Condition & rehab AI · 8 photos
This 3-bedroom, 2-bath home on a spacious lot requires moderate renovations to improve its condition and appeal to buyers.
Repairs flagged
- Major Kitchen flooring — Severely damaged and outdated
- Major Kitchen cabinets and appliances — Outdated and in poor condition
- Major Bathroom fixtures — Outdated and in poor condition
- Minor Exterior siding — Some discoloration
Value-add opportunities
- Resale New kitchen flooring — Modern flooring will attract buyers
- Resale New kitchen cabinets and appliances — Up-to-date kitchen will appeal to buyers
- Resale New bathroom fixtures — Modern bathroom will attract buyers
- Both Landscaping and debris removal — Improved curb appeal and reduced maintenance costs
Renovation cost estimate screening
| Repair item | Severity | Est. cost |
|---|---|---|
| Kitchen flooring · Severely damaged and outdated | Major | $15,000–50,000 |
| Kitchen cabinets and appliances · Outdated and in poor condition | Major | $15,000–50,000 |
| Bathroom fixtures · Outdated and in poor condition | Major | $15,000–50,000 |
| Exterior siding · Some discoloration | Minor | $500–3,000 |
| Total estimated repair cost · 4 items | $45,500–153,000 |
Value-add ROI direction
- Resale New kitchen flooring — Modern flooring will attract buyers ↑
- Resale New kitchen cabinets and appliances — Up-to-date kitchen will appeal to buyers ↑
- Resale New bathroom fixtures — Modern bathroom will attract buyers ↑
- Both Landscaping and debris removal — Improved curb appeal and reduced maintenance costs ↑
ⓘ Cost ranges are severity-bucket heuristics (US national rule-of-thumb). Get contractor quotes + a written scope before underwriting a rehab budget.
Schools (NCES district)
- District
- Natchitoches Parish
- NCES district ID
- 2201140
- Math proficiency
- 29% ▼ -27.00%
- Reading proficiency
- 36% ▼ -27.00%
- Median HH income
- $30,204
- Composite
- 26.36/100
- National rank
- #7235
- State rank
- #41 of 98 in LA
Livability — Natchitoches
- Score
- 54/100
- State rank
- #382
- US rank
- #23935
Category grades
Schools grade is shown separately in the Schools card above.
Census & demographics
- Census place
- Natchitoches, LA
- City population
- 27,214
- Population (ZIP)
- 25,485
Population outlook (Natchitoches County) Hauer SSP2
- Today (2025)
- 38,130 people
- By 2030
- 37,412 · -1.9%
- By 2040
- 35,550 · -6.8%
- By 2050
- 33,580 · -11.9%
- By 2075
- 29,268 · -23.2%
- By 2100
- 23,909 · -37.3%
Race, ethnicity, and origin ACS 2023
- Neighborhood character
- Diverse neighborhood (Simpson 0.58)
- Race & ethnicity
- Black 47% White 45% Two or more races 5% Hispanic / Latino 3%
- Common ancestry
- Lithuanian 5% Italian 1% Serbian 1%
- Foreign-born
- 2% · Canada
- Languages at home
- 97% English-only · Spanish 2% French/Haitian/Cajun 1%
Political lean MEDSL · Natchitoches
- 2024 margin
- Strong R (+22.4) · D 38.2% · R 60.5% · Other 1.3%
- 2008→2024 swing
- -15.0pp toward R · 2008: -7.3pp · 2024: -22.4pp
- All cycles
- 2024: R+22.4 2020: R+14.9 2016: R+11.0 2012: R+6.6 2008: R+7.3
Not yet ingested
- Civics
- —
Market trends
- HPI YoY
- ▼ -121.84%
- Current HPI
- 103.9202
- Rent YoY
- —
- Metro
- —
- State GDP YoY
- ▲ 3.29%
- F500 in state
- 10
Industry mix (Fortune 500 HQ in LA)
| Industry | F500 HQs | Revenue |
|---|---|---|
| Telecommunications | 2 | $23B |
|
||
| Utilities | 1 | $12B |
|
||
| Wholesale / Distribution | 1 | $5B |
|
||
| Advertising | 1 | $2B |
|
||
Price history
-15.8% since first listed2 events — show timeline
- 2026-04-14 Price Changed $80,000 AcadianaMLS
- 2025-03-11 Listed $95,000 AcadianaMLS
Cash-flow waterfall
monthlySold comps — $/sqft
last 12 mo · ≤1 miLoading sold comps…