 Duplex
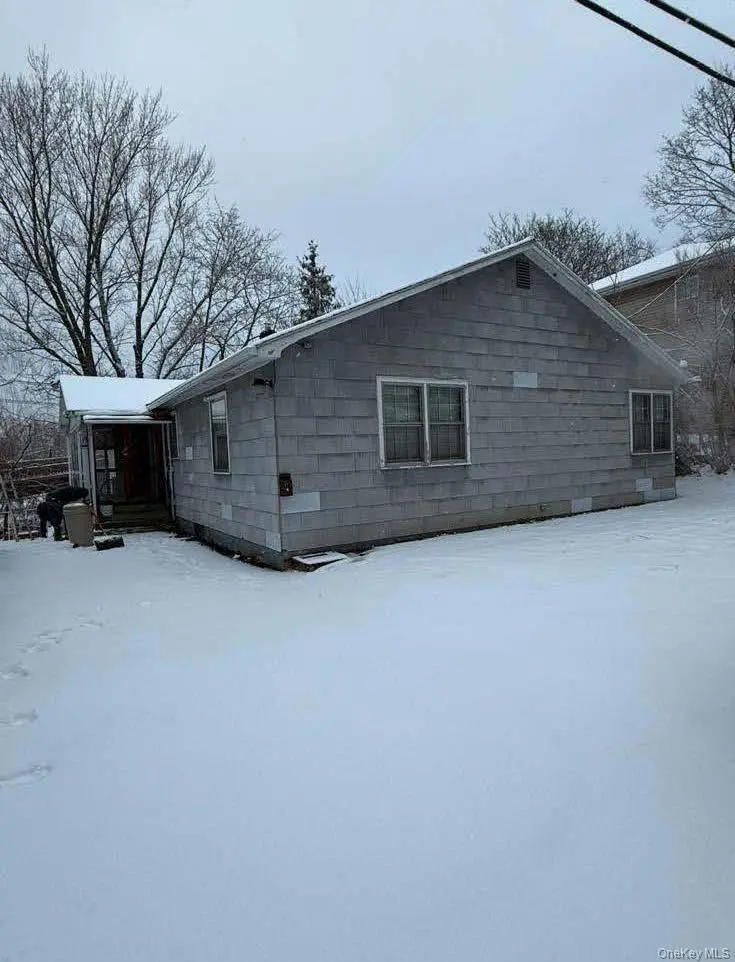
17 Allen St · Catskill, NY
Flood risk 9/10 · Severe
- FEMA flood zone
- X (unshaded)
- Chance of flooding over 30 yrs
- 0.99%
- Est. flood insurance / yr
- $473 – $860
Fire risk 1/10 · Minimal
- Est. fire insurance / yr
- $691 – $1,283
Heat risk 4/10 · Minor
- Hot days now (above 99°F)
- 7 days/yr
- Hot days in 30 yrs
- 16 days/yr
Wind risk 3/10 · Minor
- Chance of severe wind over 30 yrs
- 7.0%
Air-quality risk 2/10 · Minimal
- Unhealthy air days now
- 0 days/yr
- Unhealthy air days in 30 yrs
- 1 days/yr
Risk factors via First Street. Map © Google.
Why this score? — see what drove the B+ grade
The composite is a weighted blend of 9 inputs, each scored 0–100. Each bar is that input's sub-score; the figure is the points it added to the 100-point composite (weight × sub-score).
- Cash flow +26.3/30.0
- ARV discount +15.0/15.0
- Appreciation +10.0/10.0
- DSCR +8.9/10.0
- 1% rule +7.2/10.0
- Schools +4.1/10.0
- Livability +3.5/5.0
- Rent growth +2.5/5.0
- Condition / age +2.5/5.0
$299,000
🖨 Deal sheet 📄 Offer letter ✓ Due diligence
Multi-family units
County records classify this as Multi-Family (2-4 Unit). Listing-text estimate: 2 units. confirmed
Listing remarks MLS
2 family, 2 bedrooms in each unit, finished basement, close to everything, centrally-located place.Main Street restaurants bars mermaid cafe 30 minutes best ski resort's hunter Windham historic sites hiking zoom flume water park., Additional information: Separate Hotwater Heater:yes
Key facts
- Water park
- Finished basement
- Historic sites
Tags
Neighborhood map
What this means for you Summary
Snapshot
- This is a 2 × 2-bed/1.5-bath units multifamily listed at $299k.
Deal economics
- At list price, monthly cash flow is $716 ($9k/yr) — positive. Per door: $358/mo.
- The deal already cash-flows at list — no discount required.
- Meets the 1% rule at list price ($4k rent vs $299k).
- Recommended offer: $263k (12.0% below list) — sets the bar for market timing.
- Cap rate 9.4% vs local median 2.9% in Catskill — top-decile yield for the area; either an underpriced asset or a hidden risk that comps aren't pricing in. Stress-test before assuming the spread holds.
Location & tenants
- Location reads 69/100 on livability (#483 in NY) — a middle-class / working-renter tenant base. Strengths: health & safety A+, crime B+; Watch: schools C-, amenities F, commute F.
- Catskill Central School District (town): math 45% / reading 51% proficiency, ranked #429 of 590 in NY (top 73%) — families likely to look elsewhere, expect single-tenant / working-renter base with shorter leases.
- Market conditions: 104 active listings in the ZIP; 97 units permitted in Greene County in 2024 (0 in 5+ unit buildings).
- At $3,658/mo this rent would consume 60% of the median local household income ($73k/yr) (locally 318% of renters already pay >50% of income on rent) — very limited rent-growth headroom before tenants either downsize or default.
Forward outlook
- In year one you build about $32k of equity ($2k loan paydown + $30k appreciation (10.0% local appreciation)).
- Greene County population projected at -22% by 2050 — secular population decline; favor cash flow + early exit over multi-decade hold.
- At projected returns (10.0% appreciation + 3.0% rent growth), your $84k cash investment doubles in ~2 years — after that, you're playing with house money.
- By year 2, paydown + projected appreciation supports a ~$51k cash-out refi (75% LTV) — recoverable capital for the next deal without selling this one.
Negotiation context
- It's been on market 450 days — a 12% lower offer ($263k) is reasonable based on typical stale-listing flexibility.
- 2 sale attempts with the ask held roughly flat each time — persistent listings suggest the price (not the market) is what's stuck; bring a comps-based counter.
Risks & watch-outs
- Watch-outs: flood insurance adds $56/mo; built in 1951 — expect roof / HVAC / electrical / plumbing capex.
- Climate carrying-cost: severe flood risk — expect insurance premiums to compound above CPI over the hold.
Questions for the listing agent
- It's been on market 450 days. Have you received any prior offers? Is the seller open to a 12% concession, seller financing, or rate buy-down credit?
- Can we see the unit-by-unit rent roll, current vacancy, and any below-market leases? What's the average tenancy length?
- What capital expenditures (roof, boiler, parking lot, exteriors) have been made in the last 5 years, and what's planned in the next 2?
- Built in 1951 — when were the roof, HVAC, electrical panel, plumbing, and water heater last replaced?
- What's the actual annual flood-insurance premium (NFIP or private), and is the property in a SFHA with mandatory coverage?
- Why hasn't it sold? Are there any deal-killer items the seller is aware of (foundation, flood, title, zoning, code violations)?
- Is there a deadline driving the sale (1031 exchange, divorce, estate, relocation)? That informs how much negotiation room exists.
- What's the average days-on-market for RENTAL listings here right now (not sales)? A rising rental-DOM trend means longer vacancies and softer asking-rent achievability than the comps imply.
- What's the recent tenant-quality profile in this submarket — average credit score on applications, eviction rate, late-payment / NSF rate, and stable-employment percentage? A property-management company in the area should have these aggregated.
- How much new apartment / multifamily construction is in the pipeline within 1–3 miles? Heavy new supply (>2% of stock underway) typically softens rents 12–24 months out; light construction supports rent growth.
Investment metrics
- 1% rule
- 1.22% ✓
- Cap rate
- 9.39%
- Cash-on-cash
- 11.06%
- DSCR
- 1.49
- GRM
- 6.8
CMA / ARV
- ARV (median comp)
- $497,821
- List price
- $299,000
- Delta
- -39.94%
- Verdict
- UNDERPRICED
- Comps
- 20 within 1.0 mi
Show comp detail 4 sales within ~0.75 mi
| Address | Dist | Beds/Ba | Sqft | Sold | Price | $/sf | Match |
|---|---|---|---|---|---|---|---|
| 54 W Bridge St | 0.59mi | 4/2.0 (+1) | 2,184 (+1%) | 2mo | $480,000 | $220 | 65 |
| 54 Division St | 0.51mi | 4/— (+1) | 2,200 (+2%) | 11mo | $280,000 | $127 | 60 |
| 188 Water St | 0.36mi | 3/3.0 | 2,268 (+5%) | 18mo | $325,000 | $143 | 56 |
| 516 Main St | 0.18mi | 4/2.5 (+1) | 1,848 (-15%) | 22mo | $325,000 | $176 | 42 |
Match score weights: distance 35% · size 25% · config 20% · recency 20%. Top-matched comps best support the ARV.
Projected returns pro-forma
10.0% appreciation · 3.0% rent growth · sell at horizon
- IRR
- 31.8%
- Equity multiple
- 3.49×
- Total profit
- $208,585
- Equity at exit
- $269,363
- IRR
- 27.5%
- Equity multiple
- 7.91×
- Total profit
- $578,613
- Equity at exit
- $580,891
Cash invested: $83,720 (down + closing). Projections, not guarantees.
Landlord ↔ Tenant lean methodology
- Overall (STATE)
- 15 Strongly Tenant-Friendly
- State New York
- 15 Strongly Tenant-Friendly · D+10
- County
- — inherits STATE
- City
- — inherits STATE
ZIP-level market 12414
- Home prices YoY
- 11.9%
- Active inventory
- 104
- Price-to-rent
- 13.6×
Monthly cashflow live
- Estimated rent
- $3,658 medium interval (Pro) →
- Mortgage (P&I)
- −$1,568
- Tax from tax record
- −$425 /mo · $5,105/yr
- Insurance
- −$125
- Flood insurance flood zone
- −$56 /mo · $666/yr
- HOA
- −$0
- Vacancy / Maint / Mgmt
- −$768
- Net cashflow
- $716
Break-even live
2-unit breakdown (identical units grouped — click to expand)
| Units | Beds | Baths | Est. rent |
|---|---|---|---|
| 2× units | 2 | 1.5 | $3,658 |
| #1 | 2 | 1.5 | $1,829 |
| #2 | 2 | 1.5 | $1,829 |
| Total (2 units) | $3,658 | ||
UW: 25.0% down · 7.5% · 30yr · 1.5% tax · 5.0% vac · 8.0% maint · 8.0% mgmt
Financing live
Cash to close
- Down payment
- $74,750
- Closing costs
- $8,970
- Reserves months
- —
- Total cash needed
- —
Loan-product check · same deal, 3 products live
Conventional
25% down · 7.5% · 30yr
- Down + closing
- —
- Monthly P&I
- —
- Monthly cashflow
- —
- DSCR
- —
- Eligible?
- —
Personal DTI + credit; lowest rate.
DSCR
20% down · 8.5% · 30yr
- Down + closing
- —
- Monthly P&I
- —
- Monthly cashflow
- —
- DSCR
- —
- Eligible?
- —
No personal income docs; deal must DSCR.
Hard money
10% down · 12.0% · 12mo
- Down + closing
- —
- Monthly P&I
- —
- Monthly cashflow
- —
- DSCR
- —
- Eligible?
- —
Short-term bridge; refi at stabilization.
Listing history 6 events
-
2026-06-01days on market $299,000 Active 450 DOM
-
2026-05-31days on market $299,000 Active 449 DOM
-
2026-05-30days on market $299,000 Active 448 DOM
-
2026-01-14status Active 283-char remark
Show marketing remark (283 chars)
2 family, 2 bedrooms in each unit, finished basement, close to everything, centrally-located place.Main Street restaurants bars mermaid cafe 30 minutes best ski resort's hunter Windham historic sites hiking zoom flume water park., Additional information: Separate Hotwater Heater:yes
-
2026-01-01historical 283-char remark
Show marketing remark (283 chars)
2 family, 2 bedrooms in each unit, finished basement, close to everything, centrally-located place.Main Street restaurants bars mermaid cafe 30 minutes best ski resort's hunter Windham historic sites hiking zoom flume water park., Additional information: Separate Hotwater Heater:yes
-
2025-02-23$299,000 Active 283-char remark
Show marketing remark (283 chars)
2 family, 2 bedrooms in each unit, finished basement, close to everything, centrally-located place.Main Street restaurants bars mermaid cafe 30 minutes best ski resort's hunter Windham historic sites hiking zoom flume water park., Additional information: Separate Hotwater Heater:yes
ⓘ Source: listings_history table (triggers on properties + properties_extension) + one-shot
backfill from property_details.listing_events for pre-trigger history.
Tax reassessment forecast NY · Partial reset (capped growth)
- Current annual tax
- $5,105 · $425/mo
- Projected year-2 tax
- $5,105 · $425/mo
- Expected delta
- $0/yr ($0/mo · 0.0%)
ⓘ Screening estimate from a state-policy table — verify with the county assessor before closing.
Climate risk First Street
- Flood 9/10 Extreme FEMA zone X (unshaded) · 99% chance over 30 yrs
- Wildfire 1/10 Low
- Heat 4/10 Moderate 7 d/yr ≥99°F today · 16 d/yr by 30 yrs out
- Wind 3/10 Moderate 7% chance of damaging wind over 30 yrs
- Air quality 2/10 Low 0 unhealthy d/yr today · 1 by 30 yrs out
Nearby sold comps map
Loading sold comps map…
Walkable amenities ~0.75 mi
Loading nearby amenities…
Taxation est. · year 1
- Rental income
- $43,896
- − Mortgage interest
- −$16,749
- − Property taxes
- −$5,105
- − Insurance
- −$2,162
- − Repairs & maintenance
- −$3,512
- − Management
- −$3,512
- − Depreciation
- −$8,698
- Taxable income
- $4,159
- Est. tax owed @ 24.0%
- −$998
- After-tax cash flow
- $7,597/yr
For passive investors: Depreciation is non-cash, so a rental often shows a tax loss while cash-flowing — sheltering income. Rental losses are passive: they offset passive income freely, and up to $25,000/yr can offset ordinary (W-2) income if you actively participate and your MAGI is under $100k (phasing out to $0 by $150k); unused losses carry forward. On sale, claimed depreciation is recaptured at up to 25%, and gains may owe capital-gains tax (a 1031 exchange can defer both). Figures are a year-1 estimate at your 24.0% rate — not tax advice; consult a CPA.
Schools (NCES district)
- District
- Catskill Central School District
- NCES district ID
- 3606720
- Math proficiency
- 45% ▼ -9.00%
- Reading proficiency
- 51% ▲ 8.00%
- Median HH income
- $44,960
- Composite
- 40.63/100
- National rank
- #3685
- State rank
- #429 of 590 in NY
Livability — Catskill
- Score
- 69/100
- State rank
- #483
- US rank
- #8498
Category grades
Schools grade is shown separately in the Schools card above.
Census & demographics
- Census place
- Catskill, NY
- County
- Greene County · 10,169 people
- City population
- 10,169
- Metro
- nan
- Population (ZIP)
- 10,169
- Household income
- $73,036
- Rent vs Own
- Severe rent burden
- 318.0
Population outlook (Greene County) Hauer SSP2
- Today (2025)
- 44,963 people
- By 2030
- 43,126 · -4.1%
- By 2040
- 38,756 · -13.8%
- By 2050
- 34,913 · -22.4%
- By 2075
- 28,156 · -37.4%
- By 2100
- 22,296 · -50.4%
Race, ethnicity, and origin ACS 2023
- Neighborhood character
- Predominantly White (77%)
- Race & ethnicity
- White 77% Hispanic / Latino 10% Two or more races 8% Black 6%
- Hispanic origin (detail)
- Puerto Rican 7%
- Common ancestry
- Scotch-Irish 3% Iranian 3% Lithuanian 3%
- Foreign-born
- 4% · Canada, Mexico
- Languages at home
- 91% English-only · Spanish 5% Other Indo-European 2% Russian/Polish/Slavic 1%
Political lean MEDSL · Greene
- 2024 margin
- R (+17.0) · D 41.5% · R 58.5%
- 2008→2024 swing
- -7.1pp toward R · 2008: -9.9pp · 2024: -17.0pp
- All cycles
- 2024: R+17.0 2020: R+15.6 2016: R+27.4 2012: R+11.1 2008: R+9.9
Not yet ingested
- Civics
- —
Market trends
- HPI YoY
- ▲ 52.47%
- Current HPI
- 494.3394
- Rent YoY
- —
- Metro
- nan
- State GDP YoY
- ▲ 2.60%
- F500 in state
- 92
Industry mix (Fortune 500 HQ in NY)
| Industry | F500 HQs | Revenue |
|---|---|---|
| Financial Services | 10 | $950B |
|
||
| Consumer Goods | 9 | $162B |
|
||
| Insurance | 4 | $225B |
|
||
| Telecommunications | 2 | $144B |
|
||
| Pharmaceuticals | 2 | $112B |
|
||
| Media / Entertainment | 2 | $69B |
|
||
Price history
3 events — show timeline
- 2026-01-14 Relisted — OneKey® MLS as Distributed by MLS Grid
- 2026-01-01 Listing Removed — OneKey® MLS as Distributed by MLS Grid
- 2025-02-23 Listed $299,000 OneKey® MLS as Distributed by MLS Grid
Property tax history
+4.2%/yrLatest (2025): $5,105 · +3.0% YoY. Source: county tax records.
Cash-flow waterfall
monthlySold comps — $/sqft
last 12 mo · ≤1 miLoading sold comps…