1263 NC 16 Hwy N · Taylorsville, NC
Flood risk 1/10 · Minimal
- FEMA flood zone
- X (unshaded)
- Chance of flooding over 30 yrs
- 0.0%
- Est. flood insurance / yr
- $507 – $1,088
Fire risk 4/10 · Minor
- Est. fire insurance / yr
- $906 – $1,684
Heat risk 5/10 · Moderate
- Hot days now (above 102°F)
- 7 days/yr
- Hot days in 30 yrs
- 18 days/yr
Wind risk 2/10 · Minimal
- Chance of severe wind over 30 yrs
- 1.0%
Air-quality risk 2/10 · Minimal
- Unhealthy air days now
- 1 days/yr
- Unhealthy air days in 30 yrs
- 2 days/yr
Risk factors via First Street. Map © Google.
Why this score? — see what drove the B grade
The composite is a weighted blend of 9 inputs, each scored 0–100. Each bar is that input's sub-score; the figure is the points it added to the 100-point composite (weight × sub-score).
- Cash flow +30.0/30.0
- 1% rule +10.0/10.0
- DSCR +10.0/10.0
- ARV discount +7.5/15.0
- Schools +4.5/10.0
- Livability +3.5/5.0
- Rent growth +2.5/5.0
- Condition / age +2.5/5.0
- Appreciation +0.0/10.0
$89,100
🖨 Deal sheet 📄 Offer letter ✓ Due diligence
Listing remarks
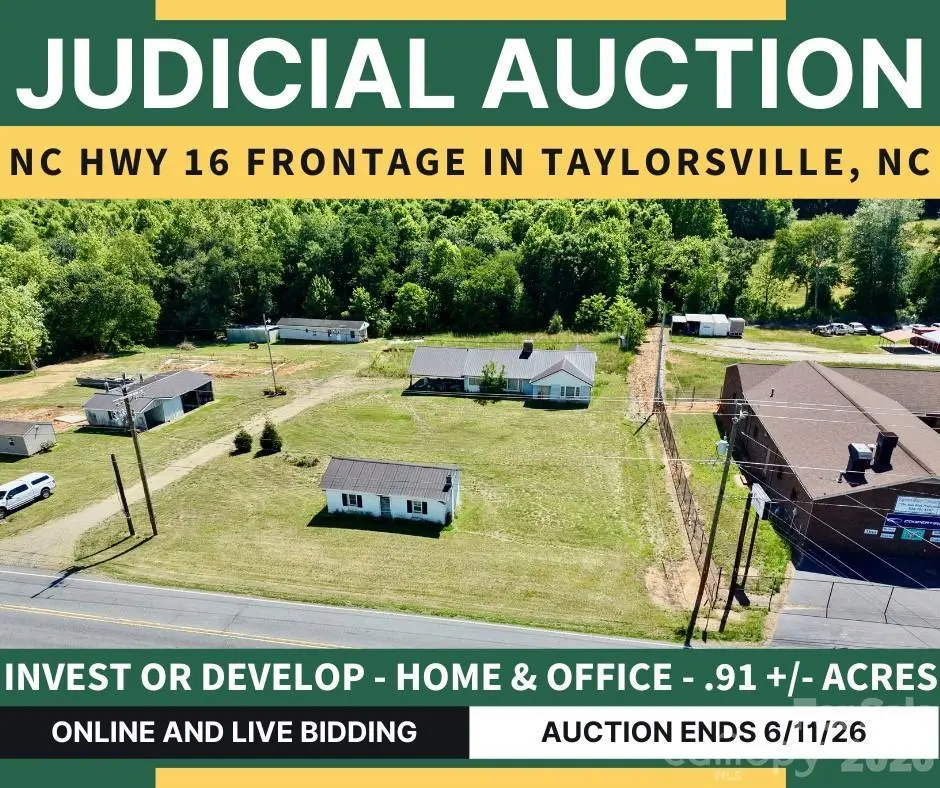
LIST PRICE IS CURRENT HIGH BID PLUS BUYER'S PREMIUM. THIS AUCTION HAS ENDED. ALL UPSET BIDS WILL NEED TO BE PLACED WITH THE CLERK OF SUPERIOR COURT. REFERENCE FILE # 25SP000020-010. MINIMUM UPSET BID IS 5%. This judicial auction presents an excellent investment or redevelopment opportunity in a high-visibility location along NC Highway 16 North in Taylorsville, North Carolina. Situated on approximately 0.91 +/- acres with valuable highway frontage, the property includes a 1,410 +/- square foot 3 bedroom, 1 bathroom home, a detached 2-car carport, and a 480 +/- square foot office building. The residence has been vacant for an extended period, is currently without power, and is in poor condit
Key facts
- Excellent visibility
- High traffic count
- 0.91 acre lot
Tags
Property features AI
Finance
- Other: Property includes separate living quarters of about 480 unheated sq. ft.; Living area listed as 1,410 sq. ft.; Property is offered at auction
- HOA & community: No HOA
Exterior
- Parking: Attached 2-space carport
- Utilities: Public water; Septic system installed; Electric service
- Home design: Single-family residence; Site-built construction; One story; Crawl space foundation; RA-20 zoning
- Construction: Block construction
- Exterior features: Approximately 0.91-acre lot; Roads are a mix of gravel and paved; Publicly maintained road; Separate living quarters (second living quarters)
Interior
- Kitchen: No appliances listed
- Bedrooms: 3 bedrooms (all on the main level)
- Bathrooms: 1 full bathroom
- Heating & cooling: Electric heating; Electric cooling
- Interior features: Fireplace; One room count
- Laundry & utility: No laundry features listed
Neighborhood map
What this means for you Summary
Snapshot
- This is a 3-bed/1.0-bath single-family listed at $89k.
Deal economics
- At list price, monthly cash flow is $683 ($8k/yr) — positive.
- The deal already cash-flows at list — no discount required.
- Meets the 1% rule at list price ($2k rent vs $89k).
- Recommended offer: $86k (3.0% below list) — sets the bar for market timing.
- Cap rate 15.5% vs local median 4.0% in Taylorsville — top-decile yield for the area; either an underpriced asset or a hidden risk that comps aren't pricing in. Stress-test before assuming the spread holds.
Location & tenants
- Location reads 69/100 on livability (#159 in NC) — a middle-class / working-renter tenant base. Strengths: crime A+, cost of living A+, housing A-; Watch: schools C-, amenities F, commute F.
- Alexander County Schools (rural): math 52% / reading 55% proficiency, ranked #52 of 178 in NC (top 29%) — acceptable for families but not a draw, mixed tenant base, ~2y average lease.
- Market conditions: 135 active listings in the ZIP; 113 units permitted in Alexander County in 2024 (0 in 5+ unit buildings).
Forward outlook
- Local home prices are declining (-3.0%/yr); year-one equity from $616 of loan paydown is wiped out by about $3k of value loss. Plan a longer hold.
- Alexander County population projected at -18% by 2050 — secular population decline; favor cash flow + early exit over multi-decade hold.
- At projected returns (-3.0% appreciation + 3.0% rent growth), your $25k cash investment doubles in ~4 years — after that, you're playing with house money.
Negotiation context
- It's been on market 33 days — a 3% lower offer ($86k) is reasonable based on typical stale-listing flexibility.
Risks & watch-outs
- Watch-outs: built in 1955 — expect roof / HVAC / electrical / plumbing capex.
- Climate carrying-cost: extreme-heat days projected 7→18/yr by 2055 (HVAC capex compounding) — expect insurance premiums to compound above CPI over the hold.
Questions for the listing agent
- It's been on market 33 days. Have you received any prior offers? Is the seller open to a 3% concession, seller financing, or rate buy-down credit?
- Built in 1955 — when were the roof, HVAC, electrical panel, plumbing, and water heater last replaced?
- Is there a deadline driving the sale (1031 exchange, divorce, estate, relocation)? That informs how much negotiation room exists.
- What's the average days-on-market for RENTAL listings here right now (not sales)? A rising rental-DOM trend means longer vacancies and softer asking-rent achievability than the comps imply.
- What's the recent tenant-quality profile in this submarket — average credit score on applications, eviction rate, late-payment / NSF rate, and stable-employment percentage? A property-management company in the area should have these aggregated.
- How much new for-sale + rental construction is in the pipeline within 1–3 miles? Heavy new supply typically softens prices + rents 12–24 months out; constrained supply supports both.
Investment metrics
- 1% rule
- 1.89% ✓
- Cap rate
- 15.49%
- Cash-on-cash
- 32.85%
- DSCR
- 2.46
- GRM
- 4.4
CMA / ARV
- ARV (on-the-fly)
- $255,910
- Comps found
- 3
Show comp detail 3 sales within ~0.75 mi
| Address | Dist | Beds/Ba | Sqft | Sold | Price | $/sf | Match |
|---|---|---|---|---|---|---|---|
| 1485 NC Hwy 16 Hwy N | 0.20mi | 3/2.0 | 1,721 (+6%) | 13mo | $349,900 | $203 | 66 |
| 35 Caldwell Dr | 0.35mi | 3/2.0 | 1,865 (+14%) | 7mo | $292,500 | $157 | 50 |
| 80 Sunset Dr | 0.59mi | 3/2.0 | 1,512 (-7%) | 15mo | $225,000 | $149 | 44 |
Match score weights: distance 35% · size 25% · config 20% · recency 20%. Top-matched comps best support the ARV.
Projected returns pro-forma
-3.0% appreciation · 3.0% rent growth · sell at horizon
- IRR
- 28.0%
- Equity multiple
- 2.17×
- Total profit
- $29,104
- Equity at exit
- $13,285
- IRR
- 35.5%
- Equity multiple
- 4.27×
- Total profit
- $81,534
- Equity at exit
- $7,704
Cash invested: $24,948 (down + closing). Projections, not guarantees.
Landlord ↔ Tenant lean methodology
- Overall (STATE)
- 85 Strongly Landlord-Friendly
- State North Carolina
- 85 Strongly Landlord-Friendly · R+3
- County
- — inherits STATE
- City
- — inherits STATE
ZIP-level market 28681
- Home prices YoY
- -11.9%
- Active inventory
- 135
- Price-to-rent
- 4.4×
Monthly cashflow live
- Estimated rent
- $1,683 medium interval (Pro) →
- Mortgage (P&I)
- −$467
- Tax from tax record
- −$142 /mo · $1,706/yr
- Insurance
- −$37
- HOA
- −$0
- Vacancy / Maint / Mgmt
- −$353
- Net cashflow
- $683
Break-even live
UW: 25.0% down · 7.5% · 30yr · 1.5% tax · 5.0% vac · 8.0% maint · 8.0% mgmt
Financing live
Cash to close
- Down payment
- $22,275
- Closing costs
- $2,673
- Reserves months
- —
- Total cash needed
- —
Loan-product check · same deal, 3 products live
Conventional
25% down · 7.5% · 30yr
- Down + closing
- —
- Monthly P&I
- —
- Monthly cashflow
- —
- DSCR
- —
- Eligible?
- —
Personal DTI + credit; lowest rate.
DSCR
20% down · 8.5% · 30yr
- Down + closing
- —
- Monthly P&I
- —
- Monthly cashflow
- —
- DSCR
- —
- Eligible?
- —
No personal income docs; deal must DSCR.
Hard money
10% down · 12.0% · 12mo
- Down + closing
- —
- Monthly P&I
- —
- Monthly cashflow
- —
- DSCR
- —
- Eligible?
- —
Short-term bridge; refi at stabilization.
Listing history 18 events
-
2026-06-19days on market $89,100 Active 33 DOM
-
2026-06-18days on market $89,100 Active 32 DOM
-
2026-06-17days on market $89,100 Active 31 DOM
-
2026-06-16days on market $89,100 Active 30 DOM
-
2026-06-15days on market $89,100 Active 29 DOM
-
2026-06-14pricedays on market $89,100 Active 27 DOM
-
2026-06-13days on market $25,000 Active 26 DOM
-
2026-06-10days on market $25,000 Active 24 DOM
-
2026-06-09days on market $25,000 Active 23 DOM
-
2026-06-09price $25,000 Active 22 DOM
-
2026-06-08days on market $23,375 Active 22 DOM
-
2026-06-07pricedays on market $23,375 Active 21 DOM
-
2026-06-03days on market $11,275 Active 17 DOM
-
2026-06-02days on market $11,275 Active 16 DOM
-
2026-06-01days on market $11,275 Active 15 DOM
-
2026-05-31days on market $11,275 Active 14 DOM
-
2026-05-30days on market $11,275 Active 13 DOM
-
2026-05-17$10,000 Active
ⓘ Source: listings_history table (triggers on properties + properties_extension) + one-shot
backfill from property_details.listing_events for pre-trigger history.
Tax reassessment forecast NC · Resets to sale price
- Current annual tax
- $1,706 · $142/mo
- Projected year-2 tax
- $1,706 · $142/mo
- Expected delta
- $0/yr ($0/mo · 0.0%)
ⓘ Screening estimate from a state-policy table — verify with the county assessor before closing.
Climate risk First Street
- Flood 1/10 Low FEMA zone X (unshaded) · 0% chance over 30 yrs
- Wildfire 4/10 Moderate
- Heat 5/10 Major 7 d/yr ≥102°F today · 18 d/yr by 30 yrs out
- Wind 2/10 Low 100% chance of damaging wind over 30 yrs
- Air quality 2/10 Low 1 unhealthy d/yr today · 2 by 30 yrs out
Nearby sold comps map
Loading sold comps map…
Walkable amenities ~0.75 mi
Loading nearby amenities…
Taxation est. · year 1
- Rental income
- $20,195
- − Mortgage interest
- −$4,991
- − Property taxes
- −$1,706
- − Insurance
- −$446
- − Repairs & maintenance
- −$1,616
- − Management
- −$1,616
- − Depreciation
- −$2,592
- Taxable income
- $7,229
- Est. tax owed @ 24.0%
- −$1,735
- After-tax cash flow
- $6,460/yr
For passive investors: Depreciation is non-cash, so a rental often shows a tax loss while cash-flowing — sheltering income. Rental losses are passive: they offset passive income freely, and up to $25,000/yr can offset ordinary (W-2) income if you actively participate and your MAGI is under $100k (phasing out to $0 by $150k); unused losses carry forward. On sale, claimed depreciation is recaptured at up to 25%, and gains may owe capital-gains tax (a 1031 exchange can defer both). Figures are a year-1 estimate at your 24.0% rate — not tax advice; consult a CPA.
Schools (NCES district)
- District
- Alexander County Schools
- NCES district ID
- 3700090
- Math proficiency
- 52% ▲ 5.00%
- Reading proficiency
- 55% ▲ 7.00%
- Median HH income
- $41,189
- Composite
- 44.84/100
- National rank
- #2732
- State rank
- #52 of 178 in NC
Livability — Taylorsville
- Score
- 69/100
- State rank
- #159
- US rank
- #8794
Category grades
Schools grade is shown separately in the Schools card above.
Census & demographics
- Population (ZIP)
- 26,117
Population outlook (Alexander County) Hauer SSP2
- Today (2025)
- 36,916 people
- By 2030
- 36,085 · -2.3%
- By 2040
- 33,528 · -9.2%
- By 2050
- 30,229 · -18.1%
- By 2075
- 23,159 · -37.3%
- By 2100
- 15,981 · -56.7%
Race, ethnicity, and origin ACS 2023
- Neighborhood character
- Predominantly White (88%)
- Race & ethnicity
- White 88% Black 5% Hispanic / Latino 5% Two or more races 3% Native American 1%
- Common ancestry
- Slovak 2% Romanian 1% Serbian 1%
- Foreign-born
- 2% · Canada, China
- Languages at home
- 94% English-only · Spanish 4% German/W. Germanic 1%
Political lean MEDSL · Alexander
- 2024 margin
- Solid R (+59.9) · D 19.7% · R 79.5%
- 2008→2024 swing
- -21.5pp toward R · 2008: -38.4pp · 2024: -59.9pp
- All cycles
- 2024: R+59.9 2020: R+58.0 2016: R+55.9 2012: R+44.6 2008: R+38.4
Not yet ingested
- Civics
- —
Market trends
- HPI YoY
- ▼ -30.79%
- Current HPI
- 227.497
- Rent YoY
- —
- Metro
- —
- State GDP YoY
- ▲ 3.28%
- F500 in state
- 26
Industry mix (Fortune 500 HQ in NC)
| Industry | F500 HQs | Revenue |
|---|---|---|
| Financial Services | 2 | $213B |
|
||
| Retail | 2 | $95B |
|
||
| Industrial Conglomerate | 1 | $38B |
|
||
| Metals / Steel | 1 | $35B |
|
||
| Utilities | 1 | $30B |
|
||
| Industrial Machinery | 1 | $19B |
|
||
Price history
1 event — show timeline
- 2026-05-17 Listed $10,000 CANOPYMLS as Distributed by MLS Grid
Property tax history
+9.8%/yrLatest (2025): $1,706 · +683.9% YoY. Source: county tax records.
Cash-flow waterfall
monthlySold comps — $/sqft
last 12 mo · ≤1 miLoading sold comps…