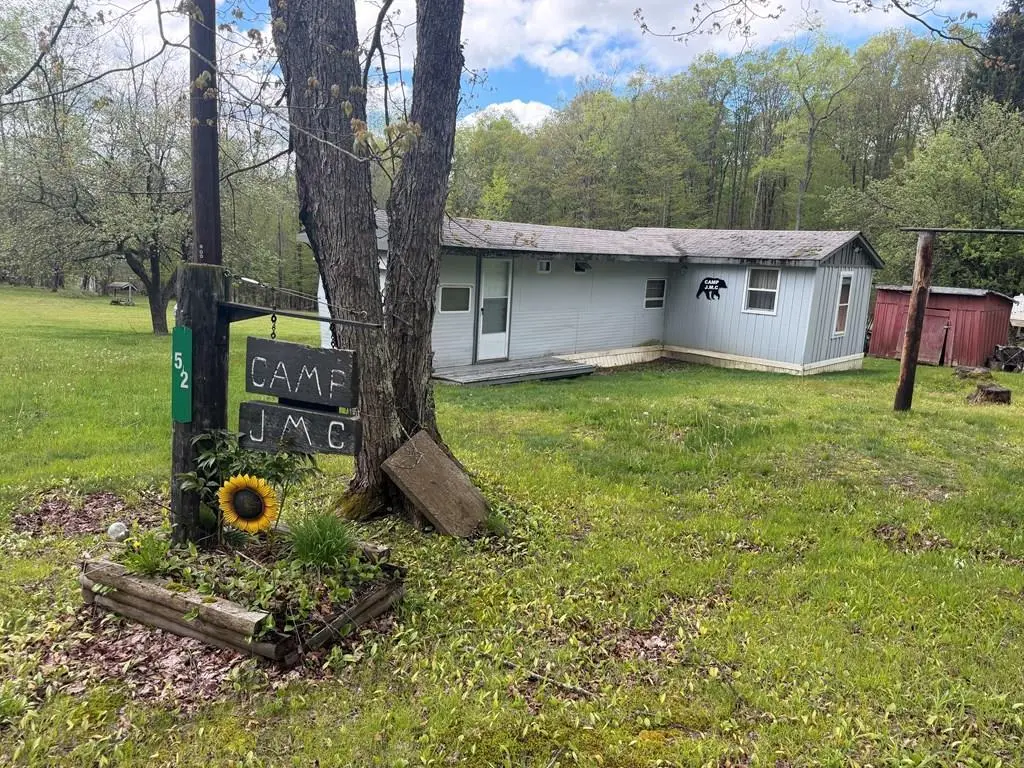
52 Coyote Crossing Ln · Keating, PA
Flood risk 1/10 · Minimal
- FEMA flood zone
- X (unshaded)
- Chance of flooding over 30 yrs
- 0.0%
- Est. flood insurance / yr
- $473 – $860
Fire risk 2/10 · Minimal
- Est. fire insurance / yr
- $511 – $949
Heat risk 1/10 · Minimal
- Hot days now (above 89°F)
- 7 days/yr
- Hot days in 30 yrs
- 17 days/yr
Wind risk 1/10 · Minimal
- Chance of severe wind over 30 yrs
- —
Air-quality risk 1/10 · Minimal
- Unhealthy air days now
- 0 days/yr
- Unhealthy air days in 30 yrs
- 0 days/yr
Risk factors via First Street. Map © Google.
Why this score? — see what drove the B+ grade
The composite is a weighted blend of 9 inputs, each scored 0–100. Each bar is that input's sub-score; the figure is the points it added to the 100-point composite (weight × sub-score).
- Cash flow +30.0/30.0
- DSCR +10.0/10.0
- 1% rule +9.1/10.0
- ARV discount +7.5/15.0
- Appreciation +7.0/10.0
- Schools +4.8/10.0
- Rent growth +2.5/5.0
- Livability +2.5/5.0
- Condition / age +2.2/5.0
$54,900
🖨 Deal sheet 📄 Offer letter ✓ Due diligence
Listing remarks
Escape to the peaceful countryside with this charming singlewide home, thoughtfully maintained and featuring a small addition. The home offers one bedroom, currently outfitted with bunk beds and a full bed, and a dining area that opens to a welcoming deck, perfect for enjoying morning coffee or evening sunsets. While there is no indoor plumbing, the property includes a privy and benefits from deeded spring access nearby, providing a natural water source. Comfort is ensured year-round with a pellet stove for heating. Nestled in a serene country setting, this property is ideal for those seeking a quiet retreat, weekend getaway, or off-grid lifestyle.
Key facts
- Deeded spring access
- Welcoming deck
- Pellet stove
Tags
Property features AI
Exterior
- Home design: Residential manufactured home
- Construction: Metal siding; Wood siding
- Exterior features: Shingle roof
Interior
- Bathrooms: Half bathroom
- Interior features: Total of 4 rooms; 1 half bathroom
Neighborhood map
What this means for you Summary
Snapshot
- This is a 1-bed/0.5-bath manufactured listed at $55k. Condition is rated fair.
Deal economics
- At list price, monthly cash flow is $230 ($3k/yr) — positive.
- The deal already cash-flows at list — no discount required.
- Meets the 1% rule at list price ($772 rent vs $55k).
- Recommended offer: $53k (3.0% below list) — sets the bar for market timing.
Location & tenants
- Location reads: area grade B — affects rentability + tenant quality, not the cash-flow math above.
- Austin Area SD (rural): math 45% / reading 65% proficiency, ranked #337 of 658 in PA (top 51%) — acceptable for families but not a draw, mixed tenant base, ~2y average lease.
- Market conditions: 18 active listings in the ZIP; 24 units permitted in Potter County in 2024 (0 in 5+ unit buildings).
Forward outlook
- In year one you build about $3k of equity ($380 loan paydown + $2k appreciation (3.9% local appreciation)).
- Potter County population projected at -27% by 2050 — secular population decline; favor cash flow + early exit over multi-decade hold.
- At projected returns (3.9% appreciation + 3.0% rent growth), your $15k cash investment doubles in ~3 years — after that, you're playing with house money.
Negotiation context
- It's been on market 34 days — a 3% lower offer ($53k) is reasonable based on typical stale-listing flexibility.
Questions for the listing agent
- It's been on market 34 days. Have you received any prior offers? Is the seller open to a 3% concession, seller financing, or rate buy-down credit?
- Have any recent inspections been done? Can we get a copy of the seller's disclosures and any deferred-maintenance estimates?
- Built in 1968 — when were the roof, HVAC, electrical panel, plumbing, and water heater last replaced?
- Is there a deadline driving the sale (1031 exchange, divorce, estate, relocation)? That informs how much negotiation room exists.
- What's the average days-on-market for RENTAL listings here right now (not sales)? A rising rental-DOM trend means longer vacancies and softer asking-rent achievability than the comps imply.
- What's the recent tenant-quality profile in this submarket — average credit score on applications, eviction rate, late-payment / NSF rate, and stable-employment percentage? A property-management company in the area should have these aggregated.
- How much new for-sale + rental construction is in the pipeline within 1–3 miles? Heavy new supply typically softens prices + rents 12–24 months out; constrained supply supports both.
Investment metrics
- 1% rule
- 1.41% ✓
- Cap rate
- 11.33%
- Cash-on-cash
- 17.99%
- DSCR
- 1.80
- GRM
- 5.9
CMA / ARV
No comps found within radius.
Projected returns pro-forma
3.91% appreciation · 3.0% rent growth · sell at horizon
- IRR
- 26.3%
- Equity multiple
- 2.56×
- Total profit
- $24,009
- Equity at exit
- $27,562
- IRR
- 26.2%
- Equity multiple
- 5.01×
- Total profit
- $61,706
- Equity at exit
- $44,863
Cash invested: $15,372 (down + closing). Projections, not guarantees.
Landlord ↔ Tenant lean methodology
- Overall (STATE)
- 62 Landlord-Friendly
- State Pennsylvania
- 62 Landlord-Friendly · EVEN
- County
- — inherits STATE
- City
- — inherits STATE
ZIP-level market 16720
- Home prices YoY
- 3.5%
- Active inventory
- 18
- Price-to-rent
- 5.9×
Monthly cashflow live
- Estimated rent
- $772 medium interval (Pro) →
- Mortgage (P&I)
- −$288
- Tax est. 1.5%
- −$69 /mo · $824/yr
- Insurance
- −$23
- HOA
- −$0
- Vacancy / Maint / Mgmt
- −$162
- Net cashflow
- $230
Break-even live
UW: 25.0% down · 7.5% · 30yr · 1.5% tax · 5.0% vac · 8.0% maint · 8.0% mgmt
Financing live
Cash to close
- Down payment
- $13,725
- Closing costs
- $1,647
- Reserves months
- —
- Total cash needed
- —
Loan-product check · same deal, 3 products live
Conventional
25% down · 7.5% · 30yr
- Down + closing
- —
- Monthly P&I
- —
- Monthly cashflow
- —
- DSCR
- —
- Eligible?
- —
Personal DTI + credit; lowest rate.
DSCR
20% down · 8.5% · 30yr
- Down + closing
- —
- Monthly P&I
- —
- Monthly cashflow
- —
- DSCR
- —
- Eligible?
- —
No personal income docs; deal must DSCR.
Hard money
10% down · 12.0% · 12mo
- Down + closing
- —
- Monthly P&I
- —
- Monthly cashflow
- —
- DSCR
- —
- Eligible?
- —
Short-term bridge; refi at stabilization.
Listing history 16 events
-
2026-06-18days on market $54,900 Active 34 DOM
-
2026-06-17days on market $54,900 Active 33 DOM
-
2026-06-16days on market $54,900 Active 32 DOM
-
2026-06-15days on market $54,900 Active 31 DOM
-
2026-06-13days on market $54,900 Active 29 DOM
-
2026-06-12days on market $54,900 Active 28 DOM
-
2026-06-09days on market $54,900 Active 25 DOM
-
2026-06-08days on market $54,900 Active 24 DOM
-
2026-06-08days on market $54,900 Active 23 DOM
-
2026-06-07days on market $54,900 Active 22 DOM
-
2026-06-04days on market $54,900 Active 19 DOM
-
2026-06-02days on market $54,900 Active 18 DOM
-
2026-06-01price $54,900 Active 17 DOM
-
2026-06-01days on market $61,900 Active 17 DOM
-
2026-05-31days on market $61,900 Active 16 DOM
-
2026-05-14$61,900 Active 656-char remark
ⓘ Source: listings_history table (triggers on properties + properties_extension) + one-shot
backfill from property_details.listing_events for pre-trigger history.
Climate risk First Street
- Flood 1/10 Low FEMA zone X (unshaded) · 0% chance over 30 yrs
- Wildfire 2/10 Low
- Heat 1/10 Low 7 d/yr ≥89°F today · 17 d/yr by 30 yrs out
- Wind 1/10 Low
- Air quality 1/10 Low 0 unhealthy d/yr today · 0 by 30 yrs out
Nearby sold comps map
Loading sold comps map…
Walkable amenities ~0.75 mi
Loading nearby amenities…
Taxation est. · year 1
- Rental income
- $9,264
- − Mortgage interest
- −$3,075
- − Property taxes
- −$824
- − Insurance
- −$274
- − Repairs & maintenance
- −$741
- − Management
- −$741
- − Depreciation
- −$1,597
- Taxable income
- $2,012
- Est. tax owed @ 24.0%
- −$483
- After-tax cash flow
- $2,283/yr
For passive investors: Depreciation is non-cash, so a rental often shows a tax loss while cash-flowing — sheltering income. Rental losses are passive: they offset passive income freely, and up to $25,000/yr can offset ordinary (W-2) income if you actively participate and your MAGI is under $100k (phasing out to $0 by $150k); unused losses carry forward. On sale, claimed depreciation is recaptured at up to 25%, and gains may owe capital-gains tax (a 1031 exchange can defer both). Figures are a year-1 estimate at your 24.0% rate — not tax advice; consult a CPA.
Condition & rehab AI · 13 photos
This singlewide mobile home requires moderate repairs and maintenance, including roof and exterior siding repairs, to improve its condition and value.
Repairs flagged
- Major roof — visible wear and missing shingles
- Major exterior siding — weathered and peeling
- Minor kitchen cabinets — dated and could be updated
Value-add opportunities
- Both paint interior walls — enhances curb appeal and interior aesthetics
- Both repair roof — improves structural integrity and enhances curb appeal
- Both repair exterior siding — enhances structural integrity and curb appeal
Renovation cost estimate screening
| Repair item | Severity | Est. cost |
|---|---|---|
| roof · visible wear and missing shingles | Major | $15,000–50,000 |
| exterior siding · weathered and peeling | Major | $15,000–50,000 |
| kitchen cabinets · dated and could be updated | Minor | $500–3,000 |
| Total estimated repair cost · 3 items | $30,500–103,000 |
Value-add ROI direction
- Both paint interior walls — enhances curb appeal and interior aesthetics ↑
- Both repair roof — improves structural integrity and enhances curb appeal ↑
- Both repair exterior siding — enhances structural integrity and curb appeal ↑
ⓘ Cost ranges are severity-bucket heuristics (US national rule-of-thumb). Get contractor quotes + a written scope before underwriting a rehab budget.
Schools (NCES district)
- District
- Austin Area SD
- NCES district ID
- 4202700
- Math proficiency
- 45% ▼ -10.00%
- Reading proficiency
- 65% ▼ -5.00%
- Median HH income
- $38,291
- Composite
- 47.59/100
- National rank
- #4953
- State rank
- #337 of 658 in PA
Livability — Keating
No livability data for this city. (Only ~50 U.S. cities are tracked.)
Census & demographics
- Population (ZIP)
- 1,196
Population outlook (Potter County) Hauer SSP2
- Today (2025)
- 15,824 people
- By 2030
- 15,023 · -5.1%
- By 2040
- 13,290 · -16.0%
- By 2050
- 11,572 · -26.9%
- By 2075
- 8,144 · -48.5%
- By 2100
- 5,102 · -67.8%
Race, ethnicity, and origin ACS 2023
- Neighborhood character
- Predominantly White (97%)
- Race & ethnicity
- White 97% Two or more races 2%
- Common ancestry
- Romanian 4% Lithuanian 2% Serbian 2%
- Foreign-born
- 1%
Political lean MEDSL · Potter
- 2024 margin
- Solid R (+62.3) · D 18.4% · R 80.7%
- 2008→2024 swing
- -24.9pp toward R · 2008: -37.4pp · 2024: -62.3pp
- All cycles
- 2024: R+62.3 2020: R+60.8 2016: R+63.6 2012: R+45.9 2008: R+37.4
Not yet ingested
- Civics
- —
Market trends
- HPI YoY
- ▲ 3.91%
- Current HPI
- 115.4722
- Rent YoY
- —
- Metro
- —
- State GDP YoY
- ▲ 1.68%
- F500 in state
- 34
Industry mix (Fortune 500 HQ in PA)
| Industry | F500 HQs | Revenue |
|---|---|---|
| Healthcare | 2 | $309B |
|
||
| Insurance | 2 | $27B |
|
||
| Telecommunications / Media | 1 | $124B |
|
||
| Industrial Distribution | 1 | $22B |
|
||
| Financial Services | 1 | $20B |
|
||
| Chemicals / Materials | 1 | $18B |
|
||
Price history
-11.3% since first listed2 events — show timeline
- 2026-06-01 Price Changed $54,900 NMPA
- 2026-05-14 Listed $61,900 NMPA
Cash-flow waterfall
monthlySold comps — $/sqft
last 12 mo · ≤1 miLoading sold comps…