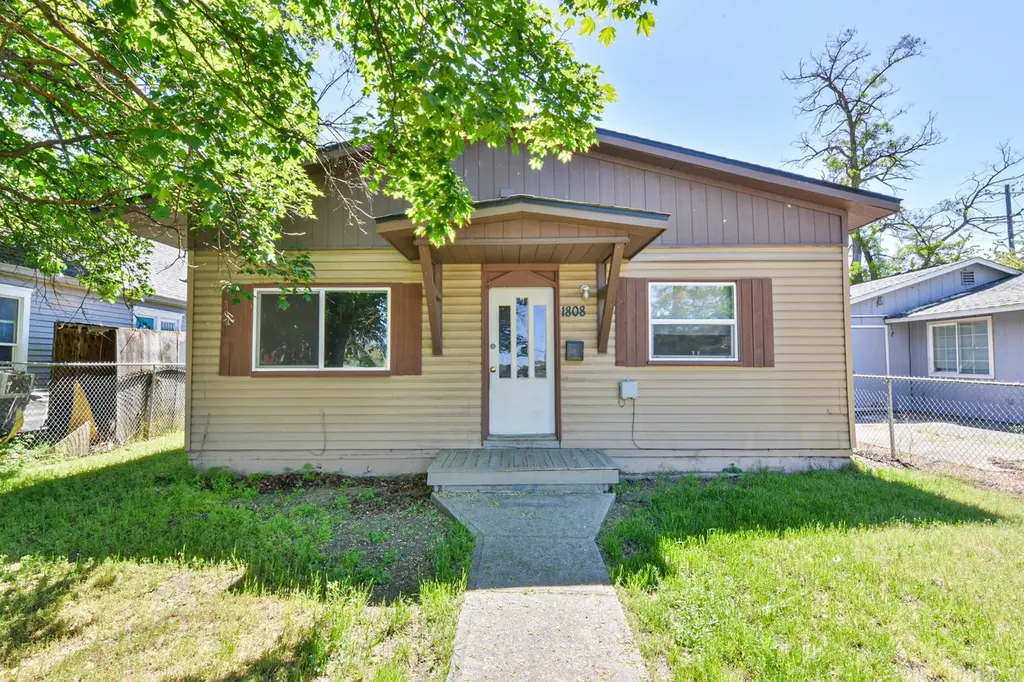
1808 E 4th Ave · Spokane, WA
Flood risk 1/10 · Minimal
- FEMA flood zone
- X (unshaded)
- Chance of flooding over 30 yrs
- 0.0%
- Est. flood insurance / yr
- $507 – $1,088
Fire risk 1/10 · Minimal
- Est. fire insurance / yr
- $604 – $1,122
Heat risk 3/10 · Minor
- Hot days now (above 94°F)
- 7 days/yr
- Hot days in 30 yrs
- 16 days/yr
Wind risk 1/10 · Minimal
- Chance of severe wind over 30 yrs
- —
Air-quality risk 10/10 · Severe
- Unhealthy air days now
- 19 days/yr
- Unhealthy air days in 30 yrs
- 21 days/yr
Risk factors via First Street. Map © Google.
Why this score? — see what drove the D+ grade
The composite is a weighted blend of 9 inputs, each scored 0–100. Each bar is that input's sub-score; the figure is the points it added to the 100-point composite (weight × sub-score).
- ARV discount +15.0/15.0
- Cash flow +13.2/30.0
- Schools +4.6/10.0
- DSCR +4.0/10.0
- Livability +4.0/5.0
- Rent growth +3.4/5.0
- 1% rule +3.3/10.0
- Condition / age +2.5/5.0
- Appreciation +0.0/10.0
$200,000
🖨 Deal sheet 📄 Offer letter ✓ Due diligence
Listing remarks MLS
Updated lower south hill home just a block from the beautiful new Liberty Park Library, waterpark and sports fields. This home has a newer roof, fresh paint inside & out, newly sodded front yard, new LVP flooring throughout, new kitchen including cabinets, counter tops and updated white appliances. Back yard is spacious and partially fenced. Alley access provides easy option for a future garage. Gas forced air heat & newer sewer line. New vinyl windows being installed Mid-October (ordered waiting for delivery & install). Don't miss this affordable south hill home perfect for a first time buyer or investment property.
Key facts
- 5,964 sq ft lot
- Built 1903
- Listed 16 days
Property features AI
Finance
- Financial info: Lender owned
Exterior
- Parking: Alley access
- Utilities: High-speed internet available
- Home design: Single-family residence; One-story
- Construction: Vinyl siding; Composition roof
- Exterior features: Fenced yard; Level lot; City street and paved road frontage; Alley access
Interior
- Bedrooms: 3 bedrooms
- Heating & cooling: Natural gas forced air heating
- Interior features: Dishwasher; Refrigerator
Neighborhood map
What this means for you Summary
Snapshot
- This is a 3-bed/1.0-bath single-family listed at $200k.
Deal economics
- At list price, monthly cash flow is $-3 ($-35/yr) — negative.
- To cash-flow at today's rent, offer at most $199k (0.3% below list).
- To meet the 1% rule (rent ≥ 1% of price), the offer needs to be $165k (17.3% below list).
- Recommended offer: $165k (17.3% below list) — sets the bar for 1% rule.
- Cap rate 6.3% vs local median 3.2% in Spokane — top-decile yield for the area; either an underpriced asset or a hidden risk that comps aren't pricing in. Stress-test before assuming the spread holds.
Location & tenants
- Location reads 80/100 on livability (#93 in WA, #1,822 nationally) — a professional / high-income tenant draw. Strengths: amenities A+, commute A+, housing A+; Watch: crime F.
- Spokane School District (urban): math 47% / reading 58% proficiency, ranked #136 of 291 in WA (top 47%) — acceptable for families but not a draw, mixed tenant base, ~2y average lease.
- Zoned schools: Grant Elementary (331 students, 86% FRL); Lewis & Clark High School (1,739 students, 38% FRL).
- Market conditions: Rents rising (+3.5%/yr); 132 active listings in the ZIP; 22 comparable units currently listed for rent nearby; rentals at typical pace (median 24d on market — plan ~3-4 weeks tenant-placement turnaround); 3,608 units permitted in Spokane County in 2024 (1,792 in 5+ unit buildings).
- This rent runs 30% of the median local income ($65k/yr) — at the standard rent-burdened threshold; future hikes will face affordability resistance.
Forward outlook
- Local home prices are declining (-3.0%/yr); year-one equity from $1k of loan paydown is wiped out by about $6k of value loss. Plan a longer hold.
- Spokane County population projected at +13% by 2050 — modest demand growth; plan on rents tracking national, not racing it.
Negotiation context
- It's been on market 16 days — a 2% lower offer ($197k) is reasonable based on typical stale-listing flexibility.
- 6 sale attempts since 19y ago with the ask held roughly flat each time — persistent listings suggest the price (not the market) is what's stuck; bring a comps-based counter.
Risks & watch-outs
- Watch-outs: built in 1903 — expect roof / HVAC / electrical / plumbing capex.
Questions for the listing agent
- What do current leases actually rent for vs. the listed asking? Can we see a recent rent roll and the last 12 months of T-12 income?
- Built in 1903 — when were the roof, HVAC, electrical panel, plumbing, and water heater last replaced?
- Is there a deadline driving the sale (1031 exchange, divorce, estate, relocation)? That informs how much negotiation room exists.
- Schools are B-rated — typically a magnet for longer-tenancy family renters. What's the average tenant stay here, and is there a school-zone premium baked into asking?
- Crime grade is F in this area — have there been break-ins, vandalism, or insurance claims at this property in the last 3 years? What carrier currently insures it and at what premium?
- The area grade is low — what's the realistic commute time and amenity access for the typical tenant pool here? Any planned neighborhood developments (good or bad) we should know about?
- What's the average days-on-market for RENTAL listings here right now (not sales)? A rising rental-DOM trend means longer vacancies and softer asking-rent achievability than the comps imply.
- What's the recent tenant-quality profile in this submarket — average credit score on applications, eviction rate, late-payment / NSF rate, and stable-employment percentage? A property-management company in the area should have these aggregated.
- How much new for-sale + rental construction is in the pipeline within 1–3 miles? Heavy new supply typically softens prices + rents 12–24 months out; constrained supply supports both.
Investment metrics
- 1% rule
- 0.83% ✗
- Cap rate
- 6.28%
- Cash-on-cash
- -0.06%
- DSCR
- 1.00
- GRM
- 10.1
CMA / ARV
- ARV (on-the-fly)
- $266,324
- Comps found
- 12
Show comp detail 12 sales within ~0.75 mi
| Address | Dist | Beds/Ba | Sqft | Sold | Price | $/sf | Match |
|---|---|---|---|---|---|---|---|
| 1823 E 5th Ave | 0.05mi | 3/1.0 | 1,044 (+9%) | 1mo | $139,000 | $133 | 81 |
| 1714 E 9th Ave | 0.38mi | 2/1.0 (-1) | 980 (+2%) | 3mo | $345,000 | $352 | 71 |
| 1919 E 10th Ave | 0.42mi | 3/1.0 | 970 (+1%) | 14mo | $265,000 | $273 | 66 |
| 2108 E Pacific Ave Unit 2110 E Pacific Ave Spokane, WA 99202 | 0.29mi | 2/1.0 (-1) | 1,028 (+7%) | 9mo | $325,000 | $316 | 62 |
| 625 S Ivory St | 0.41mi | 2/1.0 (-1) | 904 (-6%) | 9mo | $292,500 | $324 | 59 |
| 2218 E 4th Ave | 0.32mi | 2/1.0 (-1) | 840 (-12%) | 2mo | $242,500 | $289 | 58 |
| 2304 E 6th Ave | 0.38mi | 2/1.0 (-1) | 837 (-13%) | 3mo | $232,500 | $278 | 54 |
| 2314 E 6th Ave | 0.40mi | 2/1.0 (-1) | 1,092 (+14%) | 1mo | $227,000 | $208 | 52 |
| 2218 E Hartson Ave | 0.37mi | 2/1.0 (-1) | 836 (-13%) | 9mo | $220,000 | $263 | 49 |
| 2617 E 8th Ave | 0.66mi | 2/1.0 (-1) | 885 (-8%) | 7mo | $236,882 | $268 | 46 |
| 2703 E 4th Ave | 0.64mi | 2/1.0 (-1) | 842 (-12%) | 8mo | $190,000 | $226 | 38 |
| 1712 E 14th Ave | 0.69mi | 2/1.0 (-1) | 834 (-13%) | 6mo | $270,000 | $324 | 36 |
Match score weights: distance 35% · size 25% · config 20% · recency 20%. Top-matched comps best support the ARV.
Projected returns pro-forma
-3.0% appreciation · 3.53% rent growth · sell at horizon
- IRR
- -15.9%
- Equity multiple
- 0.43×
- Total profit
- $-31,726
- Equity at exit
- $29,821
- IRR
- -6.6%
- Equity multiple
- 0.57×
- Total profit
- $-24,266
- Equity at exit
- $17,292
Cash invested: $56,000 (down + closing). Projections, not guarantees.
Landlord ↔ Tenant lean methodology
- Overall (STATE)
- 28 Tenant-Leaning
- State Washington
- 28 Tenant-Leaning · D+8
- County
- — inherits STATE
- City
- — inherits STATE
ZIP-level market 99202
- Home prices YoY
- -19.0%
- Rents YoY
- 3.5%
- Active inventory
- 132
- Price-to-rent
- 10.1×
Monthly cashflow live
- Estimated rent
- $1,654 high interval (Pro) →
- Mortgage (P&I)
- −$1,049
- Tax from tax record
- −$177 /mo · $2,130/yr
- Insurance
- −$83
- HOA
- −$0
- Vacancy / Maint / Mgmt
- −$347
- Net cashflow
- $-3
Break-even live
UW: 25.0% down · 7.5% · 30yr · 1.5% tax · 5.0% vac · 8.0% maint · 8.0% mgmt
Financing live
Cash to close
- Down payment
- $50,000
- Closing costs
- $6,000
- Reserves months
- —
- Total cash needed
- —
Loan-product check · same deal, 3 products live
Conventional
25% down · 7.5% · 30yr
- Down + closing
- —
- Monthly P&I
- —
- Monthly cashflow
- —
- DSCR
- —
- Eligible?
- —
Personal DTI + credit; lowest rate.
DSCR
20% down · 8.5% · 30yr
- Down + closing
- —
- Monthly P&I
- —
- Monthly cashflow
- —
- DSCR
- —
- Eligible?
- —
No personal income docs; deal must DSCR.
Hard money
10% down · 12.0% · 12mo
- Down + closing
- —
- Monthly P&I
- —
- Monthly cashflow
- —
- DSCR
- —
- Eligible?
- —
Short-term bridge; refi at stabilization.
Rent comps 22 comps
| Address | Beds | Baths | Sqft | Rent | $/sqft | DOM | Units | Dist |
|---|---|---|---|---|---|---|---|---|
| 716 S Arthur St Spokane, WA | 2.0 | 2.0 | 975 | $1,410 | $1.45 | 23d | 1 | 0.60mi |
| 1829 E 14th Ave Spokane, WA | 2.0 | 1.0 | 1122 | $1,900 | $1.69 | 23d | 1 | 0.63mi |
| 915 S Arthur St Unit Back Right Duplex Spokane, WA | 2.0 | 1.0 | 850 | $1,300 | $1.53 | 23d | 1 | 0.63mi |
| 819 E 9th Ave Spokane, WA | 2.0 | 1.0 | 800 | $1,295 | $1.62 | 23d | 1 | 0.76mi |
| 714 S Hatch St Spokane, WA | 2.0 | 2.0 | 1010 | $2,012 | $1.99 | 23d | 1 | 0.80mi |
| 1411 E Iron Bridge Way Spokane, WA | 3.0 | 1.0–2.0 | 826 | $3,150 | $3.81 | 14d | 6 | 0.93mi |
| 523 E 11th Ave Spokane, WA | 3.0 | 2.0 | 1080 | $1,800 | $1.67 | 21d | 1 | 1.00mi |
| 226 E 7th Ave Spokane, WA | 2.0 | 1.0 | 730 | $1,200 | $1.64 | 14d | 1 | 1.08mi |
| 226 E 7th Ave Spokane, WA | 2.0 | 1.0 | 775 | $1,200 | $1.55 | 23d | 1 | 1.08mi |
| 2011 E Desmet Ave Spokane, WA | 2.0 | 1.0 | 900 | $1,250 | $1.39 | 14d | 1 | 1.10mi |
| 1036 E Desmet Ave Unit 5 Spokane, WA | 2.0 | 1.0 | 750 | $1,195 | $1.59 | 14d | 1 | 1.14mi |
| 1212 N South Riverton Ave Spokane, WA | 2.0 | 1.0 | 800 | $1,600 | $2.00 | 23d | 1 | 1.19mi |
| 29 E 6th Ave Spokane, WA | 2.0 | 1.0 | 800 | $1,300 | $1.62 | 23d | 1 | 1.22mi |
| 1449 N Madelia St Spokane, WA | 2.0 | 1.5 | 1010 | $1,650 | $1.63 | 23d | 2 | 1.32mi |
| 1517 S Grand Blvd Unit 101 Spokane, WA | 2.0 | 2.0 | 1000 | $2,395 | $2.40 | 23d | 1 | 1.32mi |
| 1517 S Grand Blvd Spokane, WA | 2.0 | 2.0 | 1000 | $2,395 | $2.40 | 14d | 2 | 1.32mi |
| 324 E 18th Ave Spokane, WA | 2.0 | 1.0 | 970 | $1,750 | $1.80 | 23d | 1 | 1.34mi |
| 44 W 6th Ave Spokane, WA | 2.0 | 1.0–2.0 | 648 | $1,575 | $2.43 | 23d | 2 | 1.34mi |
| 2807 E Boone Ave Unit 3 Spokane, WA | 2.0 | 1.0 | 850 | $1,025 | $1.21 | 14d | 1 | 1.37mi |
| 3908 E 4th Ave Spokane, WA | 2.0 | 1.0 | 920 | $1,650 | $1.79 | 23d | 1 | 1.44mi |
| 206 W Riverside Ave Spokane, WA | 2.0 | 1.0–2.0 | 649 | $1,775 | $2.73 | 14d | 11 | 1.47mi |
| 206 W 8th Ave Spokane, WA | 2.0 | 1.0 | 562 | $1,300 | $2.31 | 23d | 1 | 1.48mi |
Listing history 17 events
-
2026-05-12$200,000 Active
-
2021-11-12soldstatus $219,000 Sold 642-char remark
Show marketing remark (642 chars)
Updated lower south hill home just a block from the beautiful new Liberty Park Library, waterpark and sports fields. This home has a newer roof, fresh paint inside & out, newly sodded front yard, new LVP flooring throughout, new kitchen including cabinets, counter tops and updated white appliances. Back yard is spacious and partially fenced. Alley access provides easy option for a future garage. Gas forced air heat & newer sewer line. New vinyl windows being installed Mid-October (ordered waiting for delivery & install). Don't miss this affordable south hill home perfect for a first time buyer or investment property.
-
2021-10-11status Pending 642-char remark
Show marketing remark (642 chars)
Updated lower south hill home just a block from the beautiful new Liberty Park Library, waterpark and sports fields. This home has a newer roof, fresh paint inside & out, newly sodded front yard, new LVP flooring throughout, new kitchen including cabinets, counter tops and updated white appliances. Back yard is spacious and partially fenced. Alley access provides easy option for a future garage. Gas forced air heat & newer sewer line. New vinyl windows being installed Mid-October (ordered waiting for delivery & install). Don't miss this affordable south hill home perfect for a first time buyer or investment property.
-
2021-10-04status Pending on Inspection 642-char remark
Show marketing remark (642 chars)
Updated lower south hill home just a block from the beautiful new Liberty Park Library, waterpark and sports fields. This home has a newer roof, fresh paint inside & out, newly sodded front yard, new LVP flooring throughout, new kitchen including cabinets, counter tops and updated white appliances. Back yard is spacious and partially fenced. Alley access provides easy option for a future garage. Gas forced air heat & newer sewer line. New vinyl windows being installed Mid-October (ordered waiting for delivery & install). Don't miss this affordable south hill home perfect for a first time buyer or investment property.
-
2021-09-25$225,000 New 642-char remark
Show marketing remark (642 chars)
Updated lower south hill home just a block from the beautiful new Liberty Park Library, waterpark and sports fields. This home has a newer roof, fresh paint inside & out, newly sodded front yard, new LVP flooring throughout, new kitchen including cabinets, counter tops and updated white appliances. Back yard is spacious and partially fenced. Alley access provides easy option for a future garage. Gas forced air heat & newer sewer line. New vinyl windows being installed Mid-October (ordered waiting for delivery & install). Don't miss this affordable south hill home perfect for a first time buyer or investment property.
-
2021-09-24historical
-
2021-09-24$225,000 New
-
2007-12-10soldstatus $75,000
-
2007-12-07soldstatus $75,000
-
2007-08-10$75,000
-
2007-08-10historical
-
2007-08-10$75,000
-
2007-08-10historical
-
2007-05-23$79,900
-
2001-09-21soldstatus $45,000
-
2000-02-08soldstatus $28,700
-
1995-06-29soldstatus $41,950
ⓘ Source: listings_history table (triggers on properties + properties_extension) + one-shot
backfill from property_details.listing_events for pre-trigger history.
Tax reassessment forecast WA · Resets to sale price
- Current annual tax
- $2,130 · $177/mo
- Projected year-2 tax
- $2,130 · $177/mo
- Expected delta
- $0/yr ($0/mo · 0.0%)
ⓘ Screening estimate from a state-policy table — verify with the county assessor before closing.
Climate risk First Street
- Flood 1/10 Low FEMA zone X (unshaded) · 0% chance over 30 yrs
- Wildfire 1/10 Low
- Heat 3/10 Moderate 7 d/yr ≥94°F today · 16 d/yr by 30 yrs out
- Wind 1/10 Low
- Air quality 10/10 Extreme 19 unhealthy d/yr today · 21 by 30 yrs out
Nearby sold comps map
Loading sold comps map…
Walkable amenities ~0.75 mi
Loading nearby amenities…
Taxation est. · year 1
- Rental income
- $19,849
- − Mortgage interest
- −$11,203
- − Property taxes
- −$2,130
- − Insurance
- −$1,000
- − Repairs & maintenance
- −$1,588
- − Management
- −$1,588
- − Depreciation
- −$5,818
- Taxable loss
- −$3,478
- Est. tax savings @ 24.0%
- +$835
- After-tax cash flow
- $800/yr
For passive investors: Depreciation is non-cash, so a rental often shows a tax loss while cash-flowing — sheltering income. Rental losses are passive: they offset passive income freely, and up to $25,000/yr can offset ordinary (W-2) income if you actively participate and your MAGI is under $100k (phasing out to $0 by $150k); unused losses carry forward. On sale, claimed depreciation is recaptured at up to 25%, and gains may owe capital-gains tax (a 1031 exchange can defer both). Figures are a year-1 estimate at your 24.0% rate — not tax advice; consult a CPA.
Schools (NCES district)
- District
- Spokane School District
- NCES district ID
- 5308250
- Math proficiency
- 47% ▲ 1.00%
- Reading proficiency
- 58% ▲ 1.00%
- Median HH income
- $43,187
- Composite
- 46.1/100
- National rank
- #5477
- State rank
- #136 of 291 in WA
Livability — Spokane
- Score
- 80/100
- State rank
- #93
- US rank
- #1822
Category grades
Schools grade is shown separately in the Schools card above.
Census & demographics
- Census place
- Spokane, WA
- County
- Spokane County · 496,401 people
- City population
- 298,820
- Metro
- Spokane-Spokane Valley, WA
- Population (ZIP)
- 19,921
- Household income
- $65,189
- Rent vs Own
- Severe rent burden
- 1216.0
Population outlook (Spokane County) Hauer SSP2
- Today (2025)
- 531,314 people
- By 2030
- 549,278 · +3.4%
- By 2040
- 577,822 · +8.8%
- By 2050
- 598,188 · +12.6%
- By 2075
- 630,744 · +18.7%
- By 2100
- 622,360 · +17.1%
Race, ethnicity, and origin ACS 2023
- Neighborhood character
- Predominantly White (74%)
- Race & ethnicity
- White 74% Two or more races 10% Hispanic / Latino 10% Asian 4% Black 3% Pacific Islander 1%
- Hispanic origin (detail)
- Mexican 6%
- Common ancestry
- Portuguese 4% Lithuanian 4% Slovak 3%
- Foreign-born
- 8% · Canada, Vietnam, Philippines
- Languages at home
- 89% English-only · Spanish 3% Russian/Polish/Slavic 2% Other Asian/Pacific 2%
Political lean MEDSL · Spokane
- 2024 margin
- Toss-up / Even · D 46.0% · R 51.0% · Other 3.0%
- 2008→2024 swing
- -3.8pp toward R · 2008: -1.1pp · 2024: -5.0pp
- All cycles
- 2024: R+5.0 2020: R+4.3 2016: R+8.3 2012: R+6.3 2008: R+1.1
Not yet ingested
- Civics
- —
Market trends
- HPI YoY
- ▼ -97.08%
- Current HPI
- 412.9574
- Rent YoY
- ▲ 3.53%
- Metro
- Spokane-Spokane Valley, WA
- State GDP YoY
- ▲ 4.65%
- F500 in state
- 22
Industry mix (Fortune 500 HQ in WA)
| Industry | F500 HQs | Revenue |
|---|---|---|
| Retail | 2 | $269B |
|
||
| Technology / Retail | 1 | $638B |
|
||
| Technology | 1 | $245B |
|
||
| Telecommunications | 1 | $38B |
|
||
| Food / Beverage | 1 | $36B |
|
||
| Automotive / Trucks | 1 | $34B |
|
||
Price history
+376.8% since first listed17 events — show timeline
- 2026-05-12 Listed $200,000 SPOKANEMLS as Distributed by MLS Grid
- 2021-11-12 Sold (MLS) $219,000 SPOKANEMLS as Distributed by MLS Grid
- 2021-10-11 Pending — SPOKANEMLS as Distributed by MLS Grid
- 2021-10-04 Pending — SPOKANEMLS as Distributed by MLS Grid
- 2021-09-25 Listed $225,000 SPOKANEMLS as Distributed by MLS Grid
- 2021-09-24 Listed $225,000 SPOKANEMLS as Distributed by MLS Grid
- 2021-09-24 Listing Removed — SPOKANEMLS as Distributed by MLS Grid
- 2007-12-10 Sold (MLS) $75,000 SPOKANEMLS as Distributed by MLS Grid
- 2007-12-07 Sold (Public Records) $75,000 Public Records
- 2007-08-10 Listing Removed — SPOKANEMLS as Distributed by MLS Grid
- 2007-08-10 Listed $75,000 SPOKANEMLS as Distributed by MLS Grid
- 2007-08-10 Listing Removed — SPOKANEMLS as Distributed by MLS Grid
- 2007-08-10 Listed $75,000 SPOKANEMLS as Distributed by MLS Grid
- 2007-05-23 Listed $79,900 SPOKANEMLS as Distributed by MLS Grid
- 2001-09-21 Sold (Public Records) $45,000 Public Records
- 2000-02-08 Sold (Public Records) $28,700 Public Records
- 1995-06-29 Sold (Public Records) $41,950 Public Records
Property tax history
+6.8%/yrLatest (2026): $2,130 · +1.5% YoY. Source: county tax records.
Cash-flow waterfall
monthlySold comps — $/sqft
last 12 mo · ≤1 miLoading sold comps…