 Fourplex
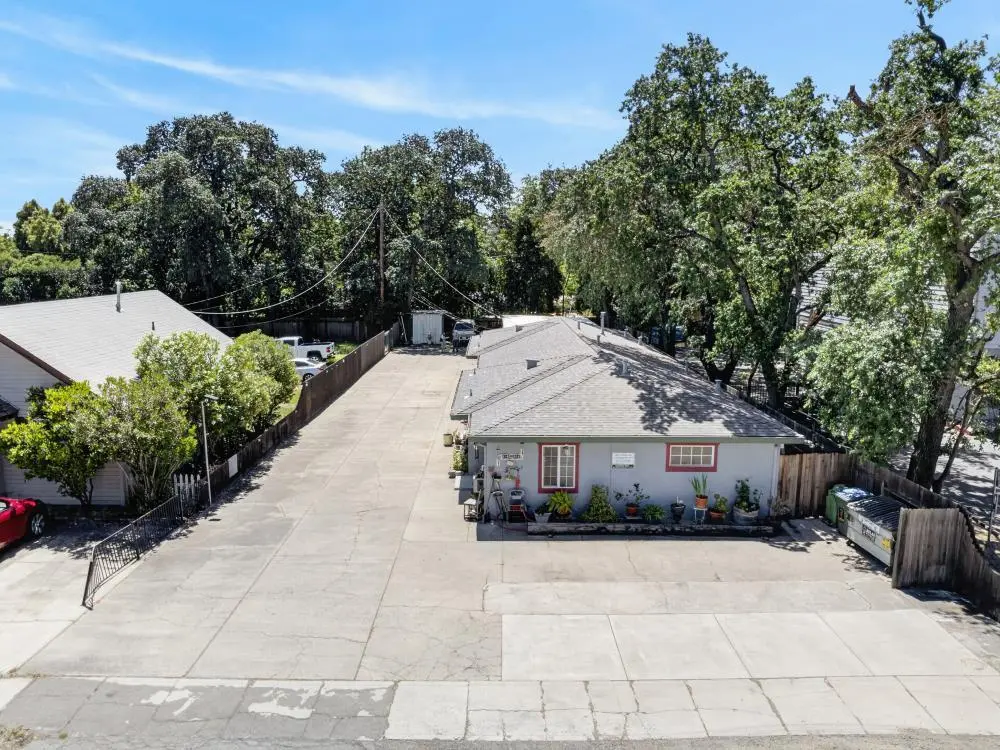
9140 - 9146 Elk Grove Blvd · Elk Grove, CA
Flood risk 1/10 · Minimal
- FEMA flood zone
- X (unshaded)
- Chance of flooding over 30 yrs
- 0.0%
- Est. flood insurance / yr
- $507 – $1,088
Fire risk 5/10 · Moderate
- Est. fire insurance / yr
- $659 – $1,223
Heat risk 7/10 · Major
- Hot days now (above 102°F)
- 7 days/yr
- Hot days in 30 yrs
- 14 days/yr
Wind risk 1/10 · Minimal
- Chance of severe wind over 30 yrs
- —
Air-quality risk 10/10 · Severe
- Unhealthy air days now
- 25 days/yr
- Unhealthy air days in 30 yrs
- 27 days/yr
Risk factors via First Street. Map © Google.
Why this score? — see what drove the C- grade
The composite is a weighted blend of 9 inputs, each scored 0–100. Each bar is that input's sub-score; the figure is the points it added to the 100-point composite (weight × sub-score).
- Cash flow +24.0/30.0
- DSCR +7.7/10.0
- 1% rule +5.3/10.0
- Schools +4.1/10.0
- Livability +3.6/5.0
- ARV discount +2.7/15.0
- Rent growth +2.5/5.0
- Condition / age +2.5/5.0
- Appreciation +0.0/10.0
$736,000
🖨 Deal sheet 📄 Offer letter ✓ Due diligence
Multi-family units
County records classify this as Multi-Family (2-4 Unit). Listing-text estimate: 4 units. confirmed
Listing remarks
Situated close to Elk Grove's Old Town Plaza. This single story property features (4) 1 bedroom/1 bath units and 4 separate single car garages. Great investment opportunity that has easy access to local shops and the freeway.
Key facts
- 0.25 acre lot
- 3 garage spots
- Built 1956
Tags
Property features AI
Finance
- HOA & community: No homeowners association
Exterior
- Parking: Total of about 10 parking spaces; 3-car garage
- Utilities: Natural gas connected; Public sewer (sewer in street); Water with meter on site; Irrigation meter on site
- Home design: Residential income property (quadruplex, apartments); Built in 1956; Single-story
- Construction: Composition roof; Built in 1956
- Exterior features: Composition roof; Regular-shaped lot
Interior
- Kitchen: Free-standing gas oven; Free-standing gas range; Free-standing refrigerator; Appliances may vary by unit
- Bedrooms: Four separate 1-bedroom units
- Flooring: Carpet; Tile; Laminate
- Bathrooms: Four full bathrooms (one in each unit)
- Heating & cooling: Central heating (varies by unit); Wall furnace; Central air conditioning (varies by unit); Wall units; Window units; Ceiling fans
- Interior features: Dual-pane partial windows; One-story property
- Laundry & utility: Laundry arrangements vary by unit
Neighborhood map
What this means for you Summary
Snapshot
- This is a 4 × 1-bed/1-bath units multifamily listed at $736k.
Deal economics
- At list price, monthly cash flow is $1k ($17k/yr) — positive. Per door: $360/mo.
- The deal already cash-flows at list — no discount required.
- Meets the 1% rule at list price ($8k rent vs $736k).
- Recommended offer: $714k (3.0% below list) — sets the bar for market timing.
- Cap rate 8.6% vs local median 2.8% in Elk Grove — top-decile yield for the area; either an underpriced asset or a hidden risk that comps aren't pricing in. Stress-test before assuming the spread holds.
Location & tenants
- Location reads 71/100 on livability (#212 in CA) — a middle-class / working-renter tenant base. Strengths: employment A+, housing A+, crime B+; Watch: commute F, cost of living F.
- Elk Grove Unified (suburban): math 40% / reading 51% proficiency, ranked #165 of 517 in CA (top 32%) — families likely to look elsewhere, expect single-tenant / working-renter base with shorter leases.
- Market conditions: Rents flat; 242 active listings in the ZIP; 6 comparable units currently listed for rent nearby; rentals lingering (median 44d on market — plan ~5-8 weeks vacancy on turnover, expect pricing pressure); 50% of comp listings sitting > 30 days — soft ceiling on asking rent; high-income renter base; 6,825 units permitted in Sacramento County in 2024 (1,752 in 5+ unit buildings).
- At $7,555/mo this rent would consume 72% of the median local household income ($125k/yr) (locally 1160% of renters already pay >50% of income on rent) — very limited rent-growth headroom before tenants either downsize or default.
Forward outlook
- Local home prices are declining (-3.0%/yr); year-one equity from $5k of loan paydown is wiped out by about $22k of value loss. Plan a longer hold.
- Sacramento County population projected at +17% by 2050 — long-run rental-demand tailwind backs the buy-and-hold thesis.
Negotiation context
- It's been on market 41 days — a 3% lower offer ($714k) is reasonable based on typical stale-listing flexibility.
- Current owner paid $242k; list at $736k implies a 204% gain — meaningful room to come down on a strong offer.
Risks & watch-outs
- Watch-outs: built in 1956 — expect roof / HVAC / electrical / plumbing capex.
- Climate carrying-cost: moderate wildfire risk; extreme-heat days projected 7→14/yr by 2055 (HVAC capex compounding) — expect insurance premiums to compound above CPI over the hold.
Questions for the listing agent
- It's been on market 41 days. Have you received any prior offers? Is the seller open to a 3% concession, seller financing, or rate buy-down credit?
- Can we see the unit-by-unit rent roll, current vacancy, and any below-market leases? What's the average tenancy length?
- What capital expenditures (roof, boiler, parking lot, exteriors) have been made in the last 5 years, and what's planned in the next 2?
- Built in 1956 — when were the roof, HVAC, electrical panel, plumbing, and water heater last replaced?
- Is there a deadline driving the sale (1031 exchange, divorce, estate, relocation)? That informs how much negotiation room exists.
- Schools are B-rated — typically a magnet for longer-tenancy family renters. What's the average tenant stay here, and is there a school-zone premium baked into asking?
- What's the average days-on-market for RENTAL listings here right now (not sales)? A rising rental-DOM trend means longer vacancies and softer asking-rent achievability than the comps imply.
- What's the recent tenant-quality profile in this submarket — average credit score on applications, eviction rate, late-payment / NSF rate, and stable-employment percentage? A property-management company in the area should have these aggregated.
- How much new apartment / multifamily construction is in the pipeline within 1–3 miles? Heavy new supply (>2% of stock underway) typically softens rents 12–24 months out; light construction supports rent growth.
Investment metrics
- 1% rule
- 1.03% ✓
- Cap rate
- 8.64%
- Cash-on-cash
- 8.38%
- DSCR
- 1.37
- GRM
- 8.1
CMA / ARV
- ARV (median comp)
- $665,445
- List price
- $736,000
- Delta
- 10.60%
- Verdict
- OVERPRICED
- Comps
- 18 within 1.0 mi
Show comp detail 3 sales within ~0.75 mi
| Address | Dist | Beds/Ba | Sqft | Sold | Price | $/sf | Match |
|---|---|---|---|---|---|---|---|
| 9566 Emerald Park Dr | 0.42mi | 4/4.0 | 2,100 (-7%) | 1mo | $628,000 | $299 | 68 |
| 9456 Acapulco Way | 0.62mi | 4/3.0 | 2,038 (-9%) | 10mo | $662,000 | $325 | 43 |
| 8970 - 8972 Laguna Vista Ct | 0.72mi | 5/4.0 (+1) | 1,980 (-12%) | 19mo | $694,000 | $351 | 25 |
Match score weights: distance 35% · size 25% · config 20% · recency 20%. Top-matched comps best support the ARV.
Projected returns pro-forma
-3.0% appreciation · 0.13% rent growth · sell at horizon
- IRR
- -6.6%
- Equity multiple
- 0.76×
- Total profit
- $-48,996
- Equity at exit
- $109,740
- IRR
- -0.6%
- Equity multiple
- 0.96×
- Total profit
- $-7,682
- Equity at exit
- $63,636
Cash invested: $206,080 (down + closing). Projections, not guarantees.
Landlord ↔ Tenant lean methodology
- Overall (STATE)
- 18 Strongly Tenant-Friendly
- State California
- 18 Strongly Tenant-Friendly · D+13
- County
- — inherits STATE
- City
- — inherits STATE
ZIP-level market 95624
- Rents YoY
- 0.1%
- Active inventory
- 242
- Price-to-rent
- 32.5×
Monthly cashflow live
- Estimated rent
- $7,555 medium interval (Pro) →
- Mortgage (P&I)
- −$3,860
- Tax from tax record
- −$362 /mo · $4,347/yr
- Insurance
- −$307
- HOA
- −$0
- Vacancy / Maint / Mgmt
- −$1,587
- Net cashflow
- $1,440
Break-even live
4-unit breakdown (identical units grouped — click to expand)
| Units | Beds | Baths | Est. rent |
|---|---|---|---|
| 4× units | 1 | 1 | $7,556 |
| #1 | 1 | 1 | $1,889 |
| #2 | 1 | 1 | $1,889 |
| #3 | 1 | 1 | $1,889 |
| #4 | 1 | 1 | $1,889 |
| Total (4 units) | $7,555 | ||
UW: 25.0% down · 7.5% · 30yr · 1.5% tax · 5.0% vac · 8.0% maint · 8.0% mgmt
Financing live
Cash to close
- Down payment
- $184,000
- Closing costs
- $22,080
- Reserves months
- —
- Total cash needed
- —
Loan-product check · same deal, 3 products live
Conventional
25% down · 7.5% · 30yr
- Down + closing
- —
- Monthly P&I
- —
- Monthly cashflow
- —
- DSCR
- —
- Eligible?
- —
Personal DTI + credit; lowest rate.
DSCR
20% down · 8.5% · 30yr
- Down + closing
- —
- Monthly P&I
- —
- Monthly cashflow
- —
- DSCR
- —
- Eligible?
- —
No personal income docs; deal must DSCR.
Hard money
10% down · 12.0% · 12mo
- Down + closing
- —
- Monthly P&I
- —
- Monthly cashflow
- —
- DSCR
- —
- Eligible?
- —
Short-term bridge; refi at stabilization.
Rent comps 6 comps
| Address | Beds | Baths | Sqft | Rent | $/sqft | DOM | Units | Dist |
|---|---|---|---|---|---|---|---|---|
| 9101 Yount Ct Elk Grove, CA | 3.0 | 2.0 | 1664 | $5,500 | $3.31 | 2d | 1 | 0.22mi |
| 9316 Cruz Ct Elk Grove, CA | 4.0 | 4.0 | 2908 | $5,995 | $2.06 | 43d | 1 | 0.45mi |
| 4917 Aizenberg Cir Elk Grove, CA | 3.0 | 2.0 | 1468 | $2,500 | $1.70 | 43d | 1 | 0.86mi |
| 9650 Mindoka Way Elk Grove, CA | 5.0 | 3.0 | 2491 | $3,900 | $1.57 | 43d | 1 | 0.86mi |
| 9748 Roedell Way Elk Grove, CA | 4.0 | 2.0 | 2208 | $2,995 | $1.36 | 4d | 1 | 0.96mi |
| 9369 Sierra Creek Dr Elk Grove, CA | 4.0 | 3.0 | 2361 | $3,100 | $1.31 | 21d | 1 | 1.38mi |
Listing history 17 events
-
2026-06-18days on market $736,000 Active 41 DOM
-
2026-06-17days on market $736,000 Active 40 DOM
-
2026-06-16days on market $736,000 Active 39 DOM
-
2026-06-15days on market $736,000 Active 38 DOM
-
2026-06-13days on market $736,000 Active 36 DOM
-
2026-06-13days on market $736,000 Active 35 DOM
-
2026-06-09days on market $736,000 Active 32 DOM
-
2026-06-08days on market $736,000 Active 31 DOM
-
2026-06-07days on market $736,000 Active 30 DOM
-
2026-06-05days on market $736,000 Active 27 DOM
-
2026-06-03days on market $736,000 Active 26 DOM
-
2026-06-02days on market $736,000 Active 25 DOM
-
2026-06-01days on market $736,000 Active 24 DOM
-
2026-05-31days on market $736,000 Active 23 DOM
-
2001-09-25soldstatus $242,500
-
2001-09-25soldstatus $242,500
-
1994-05-05soldstatus $181,500
ⓘ Source: listings_history table (triggers on properties + properties_extension) + one-shot
backfill from property_details.listing_events for pre-trigger history.
Tax reassessment forecast CA · Resets to sale price
- Current annual tax
- $4,347 · $362/mo
- Projected year-2 tax
- $5,594 · $466/mo
- Expected delta
- +$1,246/yr (+$104/mo · 28.7%)
ⓘ Screening estimate from a state-policy table — verify with the county assessor before closing.
Climate risk First Street
- Flood 1/10 Low FEMA zone X (unshaded) · 0% chance over 30 yrs
- Wildfire 5/10 Major
- Heat 7/10 Severe 7 d/yr ≥102°F today · 14 d/yr by 30 yrs out
- Wind 1/10 Low
- Air quality 10/10 Extreme 25 unhealthy d/yr today · 27 by 30 yrs out
Nearby sold comps map
Loading sold comps map…
Walkable amenities ~0.75 mi
Loading nearby amenities…
Taxation est. · year 1
- Rental income
- $90,660
- − Mortgage interest
- −$41,227
- − Property taxes
- −$4,347
- − Insurance
- −$3,680
- − Repairs & maintenance
- −$7,253
- − Management
- −$7,253
- − Depreciation
- −$21,411
- Taxable income
- $5,489
- Est. tax owed @ 24.0%
- −$1,317
- After-tax cash flow
- $15,961/yr
For passive investors: Depreciation is non-cash, so a rental often shows a tax loss while cash-flowing — sheltering income. Rental losses are passive: they offset passive income freely, and up to $25,000/yr can offset ordinary (W-2) income if you actively participate and your MAGI is under $100k (phasing out to $0 by $150k); unused losses carry forward. On sale, claimed depreciation is recaptured at up to 25%, and gains may owe capital-gains tax (a 1031 exchange can defer both). Figures are a year-1 estimate at your 24.0% rate — not tax advice; consult a CPA.
Schools (NCES district)
- District
- Elk Grove Unified
- NCES district ID
- 0612330
- Math proficiency
- 40% ▼ -5.00%
- Reading proficiency
- 51% ▼ -5.00%
- Median HH income
- $67,860
- Composite
- 40.72/100
- National rank
- #3658
- State rank
- #165 of 517 in CA
Livability — Elk Grove
- Score
- 71/100
- State rank
- #212
- US rank
- #6681
Category grades
Schools grade is shown separately in the Schools card above.
Census & demographics
- Census place
- Elk Grove, CA
- County
- Sacramento County · 1,539,646 people
- City population
- 190,119
- Metro
- Sacramento-Roseville-Folsom, CA
- Population (ZIP)
- 67,630
- Household income
- $125,332
- Rent vs Own
- Severe rent burden
- 1160.0
Population outlook (Sacramento County) Hauer SSP2
- Today (2025)
- 1,660,763 people
- By 2030
- 1,732,990 · +4.3%
- By 2040
- 1,855,755 · +11.7%
- By 2050
- 1,941,335 · +16.9%
- By 2075
- 2,046,162 · +23.2%
- By 2100
- 1,961,444 · +18.1%
Race, ethnicity, and origin ACS 2023
- Neighborhood character
- Highly diverse neighborhood (Simpson 0.75)
- Race & ethnicity
- White 37% Asian 28% Hispanic / Latino 17% Two or more races 14% Black 8% Pacific Islander 2%
- Hispanic origin (detail)
- Mexican 14%
- Common ancestry
- Italian 2% Lithuanian 2% Russian 1%
- Foreign-born
- 25% · Vietnam, Canada, China
- Languages at home
- 66% English-only · Other Indo-European 7% Spanish 6% Vietnamese 6%
Political lean MEDSL · Sacramento
- 2024 margin
- D (+19.7) · D 58.1% · R 38.4% · Other 3.5%
- 2008→2024 swing
- +0.7pp no change · 2008: 19.0pp · 2024: 19.7pp
- All cycles
- 2024: D+19.7 2020: D+25.3 2016: D+23.7 2012: D+16.3 2008: D+19.0
Not yet ingested
- Civics
- —
Market trends
- HPI YoY
- ▼ -416.87%
- Current HPI
- 308.8294
- Rent YoY
- ▲ 0.13%
- Metro
- Sacramento-Roseville-Folsom, CA
- State GDP YoY
- ▲ 3.21%
- F500 in state
- 116
Industry mix (Fortune 500 HQ in CA)
| Industry | F500 HQs | Revenue |
|---|---|---|
| Technology | 27 | $1,492B |
|
||
| Financial Services | 3 | $174B |
|
||
| Retail | 3 | $44B |
|
||
| Insurance | 3 | $26B |
|
||
| Media / Entertainment | 2 | $115B |
|
||
| Pharmaceuticals / Biotech | 2 | $62B |
|
||
Price history
+33.6% since first listed3 events — show timeline
- 2001-09-25 Sold (Public Records) $242,500 Public Records
- 2001-09-25 Sold (Public Records) $242,500 Public Records
- 1994-05-05 Sold (Public Records) $181,500 Public Records
Property tax history
+1.9%/yrLatest (2025): $4,347 · +0.9% YoY. Source: county tax records.
Cash-flow waterfall
monthlySold comps — $/sqft
last 12 mo · ≤1 miLoading sold comps…