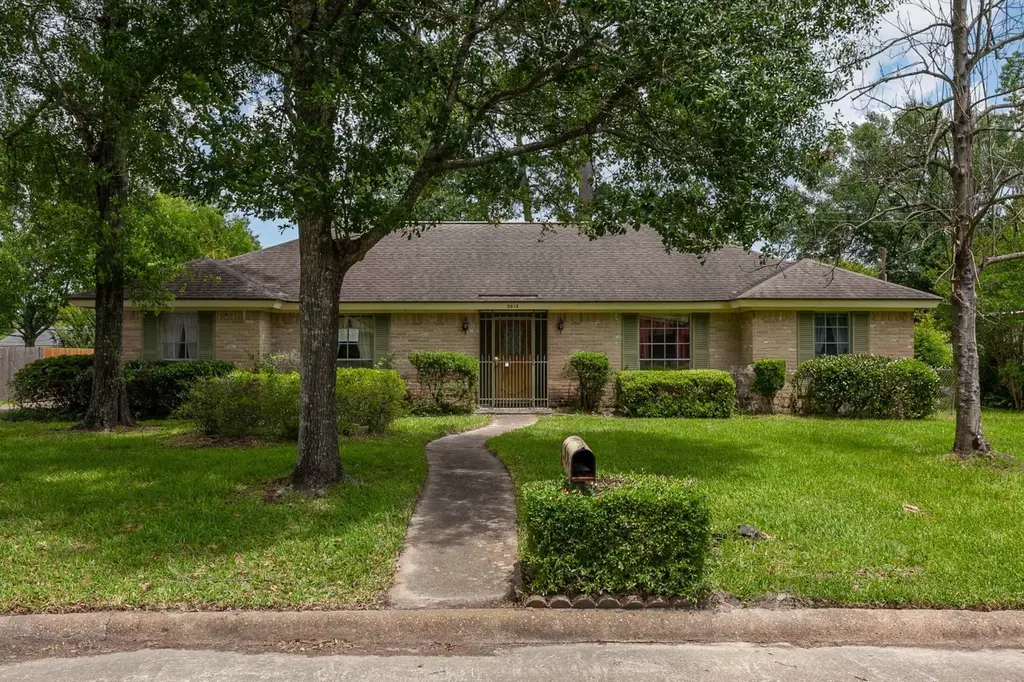
2812 Fairway · Orange, TX
Flood risk 5/10 · Moderate
- FEMA flood zone
- X (unshaded)
- Chance of flooding over 30 yrs
- 0.47%
- Est. flood insurance / yr
- $507 – $1,088
Fire risk 3/10 · Minor
- Est. fire insurance / yr
- $1,222 – $2,270
Heat risk 9/10 · Severe
- Hot days now (above 109°F)
- 7 days/yr
- Hot days in 30 yrs
- 23 days/yr
Wind risk 9/10 · Severe
- Chance of severe wind over 30 yrs
- 99.0%
Air-quality risk 2/10 · Minimal
- Unhealthy air days now
- 1 days/yr
- Unhealthy air days in 30 yrs
- 1 days/yr
Risk factors via First Street. Map © Google.
Why this score? — see what drove the D grade
The composite is a weighted blend of 9 inputs, each scored 0–100. Each bar is that input's sub-score; the figure is the points it added to the 100-point composite (weight × sub-score).
- ARV discount +10.0/15.0
- Cash flow +9.7/30.0
- Appreciation +5.5/10.0
- 1% rule +4.2/10.0
- Rent growth +3.9/5.0
- Livability +3.6/5.0
- DSCR +2.7/10.0
- Condition / age +2.5/5.0
- Schools +1.6/10.0
$189,900
🖨 Deal sheet (PDF) 📄 Offer letter ✓ Due diligence
Listing remarks MLS
Welcome to Country Club Estates! This 4 bedroom, 2.5 bath home sits on over ¼ acre and offers space and comfort inside and out. A two-car garage with covered walkway leads into a thoughtful floor plan with formal living and dining rooms, a breakfast area, and a spacious den with built-in bookcases and a brick gas fireplace. The kitchen boasts solid wood cabinetry, double ovens, an electric cooktop, and gas oven. Step outside to enjoy the covered patio and fenced backyard, ideal for entertaining or relaxing. Located near Sunset Grove Country Club, the Stark Museum of Art, Lutcher Theatre, and Shangri La Botanical Gardens. Discover all that Orange has to offer with its vibrant arts, natural beauty, booming economy, and remarkable growth!
Key facts
- Dining rooms
- Covered walkway
- Formal living room
Tags
Neighborhood map
What this means for you Summary
Snapshot
- This is a 4-bed/2.5-bath single-family listed at $190k.
Deal economics
- At list price, monthly cash flow is $-125 ($-1k/yr) — negative.
- To cash-flow at today's rent, offer at most $168k (11.6% below list).
- To meet the 1% rule (rent ≥ 1% of price), the offer needs to be $174k (8.4% below list).
- Recommended offer: $168k (11.6% below list) — sets the bar for cash-flow.
- Cap rate 5.5% vs local median 3.8% in Orange — top-decile yield for the area; either an underpriced asset or a hidden risk that comps aren't pricing in. Stress-test before assuming the spread holds.
Location & tenants
- Location reads 71/100 on livability (#286 in TX) — a middle-class / working-renter tenant base. Strengths: cost of living A+, housing A+, health & safety A+; Watch: crime D+, employment D+, amenities F.
- West Orange-Cove CISD (suburban): math 17% / reading 21% proficiency, ranked #784 of 826 in TX (top 95%) — low school quality limits family demand, transient renter base, plan for 1-2y turnover; 79% free/reduced lunch — lower-income household profile, screen leases tightly.
- Zoned schools: West Orange-Stark El (math 14% / reading 17%, grade F, #3,990 of 4,322 statewide, top 93%, 1,130 students, 94% FRL); West Orange-Stark Middle (math 20% / reading 20%, grade F, #1,428 of 1,662 statewide, top 87%, 505 students, 92% FRL); West Orange-Stark H S (math 19% / reading 31%, grade F, #1,250 of 1,632 statewide, top 77%, 660 students, 88% FRL).
- Market conditions: Rents rising fast (+5.7%/yr); 338 active listings in the ZIP; 6 comparable units currently listed for rent nearby; rentals at typical pace (median 23d on market — plan ~3-4 weeks tenant-placement turnaround); 235 units permitted in Orange County in 2024 (50 in 5+ unit buildings).
- This rent runs 32% of the median local income ($64k/yr) — at the standard rent-burdened threshold; future hikes will face affordability resistance.
Forward outlook
- In year one you build about $3k of equity ($1k loan paydown + $2k appreciation (1.0% local appreciation)).
- Orange County population projected at +6% by 2050 — modest demand growth; plan on rents tracking national, not racing it.
- By year 10, paydown + projected appreciation supports a ~$34k cash-out refi (75% LTV) — recoverable capital for the next deal without selling this one.
Negotiation context
- It's been on market 66 days — a 6% lower offer ($179k) is reasonable based on typical stale-listing flexibility.
- 4 sale attempts with the ask held roughly flat each time — persistent listings suggest the price (not the market) is what's stuck; bring a comps-based counter.
Risks & watch-outs
- Watch-outs: property tax is 2.7% of price.
- Climate carrying-cost: moderate flood risk; severe wind risk, 99% chance of damaging wind over 30y; extreme-heat days projected 7→23/yr by 2055 (HVAC capex compounding) — expect insurance premiums to compound above CPI over the hold.
Questions for the listing agent
- What do current leases actually rent for vs. the listed asking? Can we see a recent rent roll and the last 12 months of T-12 income?
- It's been on market 66 days. Have you received any prior offers? Is the seller open to a 12% concession, seller financing, or rate buy-down credit?
- Built in 1976 — when were the roof, HVAC, electrical panel, plumbing, and water heater last replaced?
- Property tax is high relative to price — has the assessment been appealed recently, and will the sale trigger a re-assessment?
- Why hasn't it sold? Are there any deal-killer items the seller is aware of (foundation, flood, title, zoning, code violations)?
- Is there a deadline driving the sale (1031 exchange, divorce, estate, relocation)? That informs how much negotiation room exists.
- Schools are D-rated, which usually means shorter tenancies and higher turnover. Who's the typical renter profile here, and what's been the actual vacancy rate?
- Crime grade is D in this area — have there been break-ins, vandalism, or insurance claims at this property in the last 3 years? What carrier currently insures it and at what premium?
- The area grade is low — what's the realistic commute time and amenity access for the typical tenant pool here? Any planned neighborhood developments (good or bad) we should know about?
- What's the average days-on-market for RENTAL listings here right now (not sales)? A rising rental-DOM trend means longer vacancies and softer asking-rent achievability than the comps imply.
- What's the recent tenant-quality profile in this submarket — average credit score on applications, eviction rate, late-payment / NSF rate, and stable-employment percentage? A property-management company in the area should have these aggregated.
- How much new for-sale + rental construction is in the pipeline within 1–3 miles? Heavy new supply typically softens prices + rents 12–24 months out; constrained supply supports both.
Investment metrics
- 1% rule
- 0.92% ✗
- Cap rate
- 5.51%
- Cash-on-cash
- -2.81%
- DSCR
- 0.87
- GRM
- 9.1
CMA / ARV
- ARV (median comp)
- $201,013
- List price
- $189,900
- Delta
- -5.53%
- Verdict
- FAIR
- Comps
- 20 within 1.0 mi
Show comp detail 10 sales within ~0.75 mi
| Address | Dist | Beds/Ba | Sqft | Sold | Price | $/sf | Match |
|---|---|---|---|---|---|---|---|
| 2309 Tilley Cir | 0.14mi | 4/2.0 | 2,121 (-1%) | 5mo | $219,900 | $104 | 86 |
| 2600 Country Club Dr | 0.14mi | 4/2.0 | 2,142 (+0%) | 17mo | $249,900 | $117 | 77 |
| 2517 Thunderbird Dr | 0.22mi | 3/2.0 (-1) | 2,211 (+3%) | 6mo | $222,500 | $101 | 72 |
| 2308 Tilley Cir | 0.12mi | 3/1.5 (-1) | 2,194 (+3%) | 24mo | $99,500 | $45 | 61 |
| 2140 Live Oak Rd | 0.58mi | 3/2.5 (-1) | 2,242 (+5%) | 4mo | $259,900 | $116 | 57 |
| 3117 Pebble Beach Ln | 0.20mi | 3/2.5 (-1) | 1,975 (-8%) | 22mo | $237,000 | $120 | 55 |
| 29 Knotty Pine Ln | 0.54mi | 3/2.0 (-1) | 2,318 (+8%) | 1mo | $259,900 | $112 | 53 |
| 3814 Beverly Ave | 0.74mi | 3/2.0 (-1) | 1,853 (-13%) | 4mo | $209,900 | $113 | 33 |
| 2012 Melwood | 0.66mi | 3/2.0 (-1) | 1,840 (-14%) | 9mo | $229,900 | $125 | 31 |
| 2622 Eddleman Rd | 0.57mi | 3/2.0 (-1) | 1,883 (-12%) | 24mo | $255,000 | $135 | 27 |
Match score weights: distance 35% · size 25% · config 20% · recency 20%. Top-matched comps best support the ARV.
Projected returns pro-forma
1.01% appreciation · 5.71% rent growth · sell at horizon
- IRR
- 0.3%
- Equity multiple
- 1.01×
- Total profit
- $727
- Equity at exit
- $64,927
- IRR
- 6.9%
- Equity multiple
- 1.90×
- Total profit
- $47,905
- Equity at exit
- $86,358
Cash invested: $53,172 (down + closing). Projections, not guarantees.
Landlord ↔ Tenant lean methodology
- Overall (STATE)
- 87 Strongly Landlord-Friendly
- State Texas
- 87 Strongly Landlord-Friendly · R+5
- County
- — inherits STATE
- City
- — inherits STATE
ZIP-level market 77630
- Home prices YoY
- 0.4%
- Rents YoY
- 5.7%
- Active inventory
- 338
- Price-to-rent
- 9.1×
Monthly cashflow live
- Estimated rent
- $1,740 high interval (Pro) →
- Mortgage (P&I)
- −$996
- Tax from tax record
- −$424 /mo · $5,087/yr
- Insurance
- −$79
- HOA
- −$0
- Vacancy / Maint / Mgmt
- −$365
- Net cashflow
- $-125
Break-even live
Sensitivity live
| Price | -10% $-17 | -5% $-71 | +0% $-125 | +5% $-178 | +10% $-232 |
|---|---|---|---|---|---|
| Rent | -10% $-262 | -5% $-193 | +0% $-125 | +5% $-56 | +10% $13 |
| Rate | -1.0pp $-29 | -0.5pp $-76 | base $-125 | +0.5pp $-174 | +1.0pp $-224 |
UW: 25.0% down · 7.5% · 30yr · 1.5% tax · 5.0% vac · 8.0% maint · 8.0% mgmt
Financing live
Cash to close
- Down payment
- $47,475
- Closing costs
- $5,697
- Reserves months
- —
- Total cash needed
- —
Loan-product check · same deal, 3 products live
Conventional
25% down · 7.5% · 30yr
- Down + closing
- —
- Monthly P&I
- —
- Monthly cashflow
- —
- DSCR
- —
- Eligible?
- —
Personal DTI + credit; lowest rate.
DSCR
20% down · 8.5% · 30yr
- Down + closing
- —
- Monthly P&I
- —
- Monthly cashflow
- —
- DSCR
- —
- Eligible?
- —
No personal income docs; deal must DSCR.
Hard money
10% down · 12.0% · 12mo
- Down + closing
- —
- Monthly P&I
- —
- Monthly cashflow
- —
- DSCR
- —
- Eligible?
- —
Short-term bridge; refi at stabilization.
Rent comps 6 comps
| Address | Beds | Baths | Sqft | Rent | $/sqft | DOM | Units | Dist |
|---|---|---|---|---|---|---|---|---|
| 2801 W Sunset Dr Orange, TX | 1.0–3.0 | 1.0–2.0 | 1113 | $1,400 | $1.26 | 15d | 27 | 0.52mi |
| 4417 Willowglen St Orange, TX | 3.0 | 2.0 | 1658 | $1,650 | $1.00 | 15d | 1 | 0.87mi |
| 20 Pinewood Cir Orange, TX | 3.0 | 2.5 | 2252 | $2,150 | $0.95 | 45d | 1 | 0.90mi |
| 1205 Wrenway Orange, TX | 4.0 | 2.0 | 1551 | $1,775 | $1.14 | 15d | 1 | 0.91mi |
| 1117 18th St Orange, TX | 4.0 | 2.0 | 1716 | $1,500 | $0.87 | 45d | 1 | 1.08mi |
| 3333 Ridgemont Dr Unit 401 Orange, TX | 3.0 | 2.0 | 1700 | $1,725 | $1.01 | 23d | 1 | 1.45mi |
Listing history 12 events
-
2026-05-11status Pending 752-char remark
Show marketing remark (752 chars)
Welcome to Country Club Estates! This 4 bedroom, 2.5 bath home sits on over ¼ acre and offers space and comfort inside and out. A two-car garage with covered walkway leads into a thoughtful floor plan with formal living and dining rooms, a breakfast area, and a spacious den with built-in bookcases and a brick gas fireplace. The kitchen boasts solid wood cabinetry, double ovens, an electric cooktop, and gas oven. Step outside to enjoy the covered patio and fenced backyard, ideal for entertaining or relaxing. Located near Sunset Grove Country Club, the Stark Museum of Art, Lutcher Theatre, and Shangri La Botanical Gardens. Discover all that Orange has to offer with its vibrant arts, natural beauty, booming economy, and remarkable growth!
-
2026-04-03status Active 752-char remark
Show marketing remark (752 chars)
Welcome to Country Club Estates! This 4 bedroom, 2.5 bath home sits on over ¼ acre and offers space and comfort inside and out. A two-car garage with covered walkway leads into a thoughtful floor plan with formal living and dining rooms, a breakfast area, and a spacious den with built-in bookcases and a brick gas fireplace. The kitchen boasts solid wood cabinetry, double ovens, an electric cooktop, and gas oven. Step outside to enjoy the covered patio and fenced backyard, ideal for entertaining or relaxing. Located near Sunset Grove Country Club, the Stark Museum of Art, Lutcher Theatre, and Shangri La Botanical Gardens. Discover all that Orange has to offer with its vibrant arts, natural beauty, booming economy, and remarkable growth!
-
2026-03-26status Pending 752-char remark
Show marketing remark (752 chars)
Welcome to Country Club Estates! This 4 bedroom, 2.5 bath home sits on over ¼ acre and offers space and comfort inside and out. A two-car garage with covered walkway leads into a thoughtful floor plan with formal living and dining rooms, a breakfast area, and a spacious den with built-in bookcases and a brick gas fireplace. The kitchen boasts solid wood cabinetry, double ovens, an electric cooktop, and gas oven. Step outside to enjoy the covered patio and fenced backyard, ideal for entertaining or relaxing. Located near Sunset Grove Country Club, the Stark Museum of Art, Lutcher Theatre, and Shangri La Botanical Gardens. Discover all that Orange has to offer with its vibrant arts, natural beauty, booming economy, and remarkable growth!
-
2026-02-25$189,900 Active 752-char remark
Show marketing remark (752 chars)
Welcome to Country Club Estates! This 4 bedroom, 2.5 bath home sits on over ¼ acre and offers space and comfort inside and out. A two-car garage with covered walkway leads into a thoughtful floor plan with formal living and dining rooms, a breakfast area, and a spacious den with built-in bookcases and a brick gas fireplace. The kitchen boasts solid wood cabinetry, double ovens, an electric cooktop, and gas oven. Step outside to enjoy the covered patio and fenced backyard, ideal for entertaining or relaxing. Located near Sunset Grove Country Club, the Stark Museum of Art, Lutcher Theatre, and Shangri La Botanical Gardens. Discover all that Orange has to offer with its vibrant arts, natural beauty, booming economy, and remarkable growth!
-
2026-01-30status Pending
-
2026-01-15price $189,900
-
2025-11-15price $199,900
-
2025-08-26$209,900 Active
-
2025-08-21historical
-
2025-07-12price $209,900
-
2025-07-12price $209,900
-
2025-05-18$219,900 Active
ⓘ Source: listings_history table (triggers on properties + properties_extension) + one-shot
backfill from property_details.listing_events for pre-trigger history.
Tax reassessment forecast TX · Resets to sale price
- Current annual tax
- $5,087 · $424/mo
- Projected year-2 tax
- $5,087 · $424/mo
- Expected delta
- $0/yr ($0/mo · 0.0%)
ⓘ Screening estimate from a state-policy table — verify with the county assessor before closing.
Climate risk First Street
- Flood 5/10 Major FEMA zone X (unshaded) · 47% chance over 30 yrs
- Wildfire 3/10 Moderate
- Heat 9/10 Extreme 7 d/yr ≥109°F today · 23 d/yr by 30 yrs out
- Wind 9/10 Extreme 99% chance of damaging wind over 30 yrs
- Air quality 2/10 Low 1 unhealthy d/yr today · 1 by 30 yrs out
Nearby sold comps map
Loading sold comps map…
Walkable amenities ~0.75 mi
Loading nearby amenities…
Taxation est. · year 1
- Rental income
- $20,877
- − Mortgage interest
- −$10,637
- − Property taxes
- −$5,087
- − Insurance
- −$950
- − Repairs & maintenance
- −$1,670
- − Management
- −$1,670
- − Depreciation
- −$5,524
- Taxable loss
- −$4,662
- Est. tax savings @ 24.0%
- +$1,119
- After-tax cash flow
- $-375/yr
For passive investors: Depreciation is non-cash, so a rental often shows a tax loss while cash-flowing — sheltering income. Rental losses are passive: they offset passive income freely, and up to $25,000/yr can offset ordinary (W-2) income if you actively participate and your MAGI is under $100k (phasing out to $0 by $150k); unused losses carry forward. On sale, claimed depreciation is recaptured at up to 25%, and gains may owe capital-gains tax (a 1031 exchange can defer both). Figures are a year-1 estimate at your 24.0% rate — not tax advice; consult a CPA.
Schools (NCES district)
- District
- West Orange-Cove CISD
- NCES district ID
- 4845090
- Math proficiency
- 17% ▼ -7.00%
- Reading proficiency
- 21% ▼ -2.00%
- Median HH income
- $37,329
- Composite
- 15.86/100
- National rank
- #9260
- State rank
- #784 of 826 in TX
Livability — Orange
- Score
- 71/100
- State rank
- #286
- US rank
- #6456
Category grades
Schools grade is shown separately in the Schools card above.
Census & demographics
- Census place
- Orange, TX
- County
- Orange County · 87,112 people
- City population
- 22,976
- Metro
- Beaumont-Port Arthur, TX
- Population (ZIP)
- 28,983
- Household income
- $64,373
- Rent vs Own
- Severe rent burden
- 1018.0
Population outlook (Orange County) Hauer SSP2
- Today (2025)
- 88,065 people
- By 2030
- 89,591 · +1.7%
- By 2040
- 91,982 · +4.4%
- By 2050
- 93,023 · +5.6%
- By 2075
- 94,871 · +7.7%
- By 2100
- 88,155 · +0.1%
Race, ethnicity, and origin ACS 2023
- Neighborhood character
- Majority White (64%)
- Race & ethnicity
- White 64% Black 21% Hispanic / Latino 11% Two or more races 9%
- Hispanic origin (detail)
- Mexican 7%
- Common ancestry
- Lithuanian 13% Italian 1% Slovak 1%
- Foreign-born
- 5% · Canada
- Languages at home
- 91% English-only · Spanish 7% French/Haitian/Cajun 1% Other Asian/Pacific 1%
Political lean MEDSL · Orange
- 2024 margin
- Solid R (+66.8) · D 16.4% · R 83.1%
- 2008→2024 swing
- -19.6pp toward R · 2008: -47.1pp · 2024: -66.8pp
- All cycles
- 2024: R+66.8 2020: R+63.4 2016: R+61.9 2012: R+54.3 2008: R+47.1
Not yet ingested
- Civics
- —
Market trends
- HPI YoY
- ▲ 1.01%
- Current HPI
- 264.14
- Rent YoY
- ▲ 5.71%
- Metro
- Beaumont-Port Arthur, TX
- State GDP YoY
- ▲ 3.95%
- F500 in state
- 110
Industry mix (Fortune 500 HQ in TX)
| Industry | F500 HQs | Revenue |
|---|---|---|
| Energy | 16 | $1,198B |
|
||
| Technology | 5 | $198B |
|
||
| Engineering / Construction | 4 | $72B |
|
||
| Energy Services | 3 | $60B |
|
||
| Utilities | 3 | $41B |
|
||
| Healthcare | 2 | $330B |
|
||
Price history
-13.6% since first listed12 events — show timeline
- 2026-05-11 Pending — BBOR
- 2026-04-03 Relisted — BBOR
- 2026-03-26 Pending — BBOR
- 2026-02-25 Listed $189,900 BBOR
- 2026-01-30 Pending — BBOR
- 2026-01-15 Price Changed $189,900 BBOR
- 2025-11-15 Price Changed $199,900 BBOR
- 2025-08-26 Listed $209,900 BBOR
- 2025-08-21 Listing Removed — HARMLS
- 2025-07-12 Price Changed $209,900 BBOR
- 2025-07-12 Price Changed $209,900 HARMLS
- 2025-05-18 Listed $219,900 HARMLS
Property tax history
+2.5%/yrLatest (2025): $5,087 · -9.2% YoY. Source: county tax records.
Cash-flow waterfall
monthlySold comps — $/sqft
last 12 mo · ≤1 miLoading sold comps…