 6-Plex
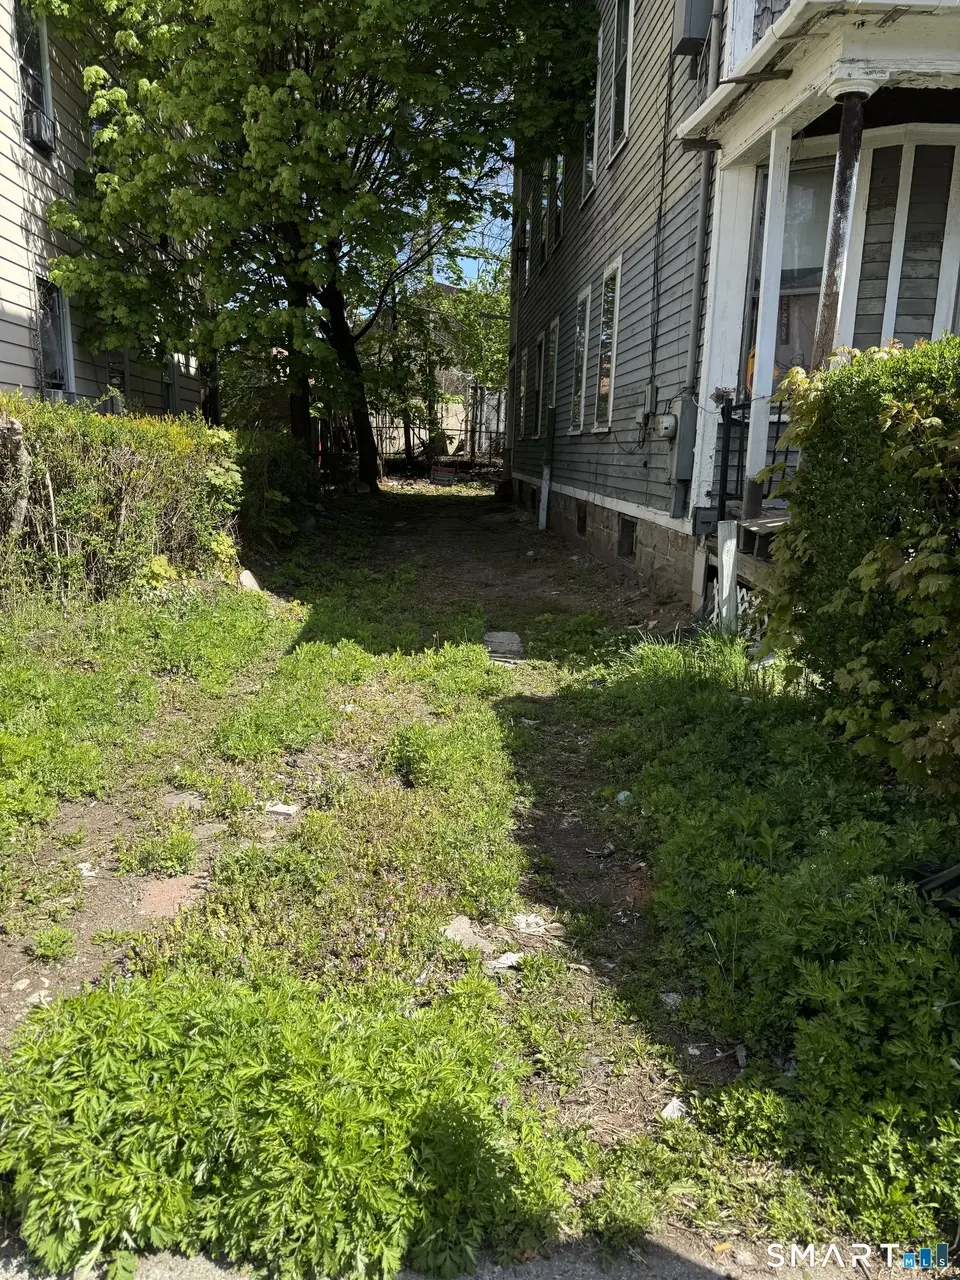
339 Pearl St · Bridgeport, CT
Flood risk 1/10 · Minimal
- FEMA flood zone
- X (unshaded)
- Chance of flooding over 30 yrs
- 0.0%
- Est. flood insurance / yr
- $473 – $860
Fire risk 1/10 · Minimal
- Est. fire insurance / yr
- $829 – $1,539
Heat risk 7/10 · Major
- Hot days now (above 97°F)
- 7 days/yr
- Hot days in 30 yrs
- 15 days/yr
Wind risk 6/10 · Moderate
- Chance of severe wind over 30 yrs
- 41.0%
Air-quality risk 4/10 · Minor
- Unhealthy air days now
- 5 days/yr
- Unhealthy air days in 30 yrs
- 7 days/yr
Risk factors via First Street. Map © Google.
Why this score? — see what drove the A grade
The composite is a weighted blend of 9 inputs, each scored 0–100. Each bar is that input's sub-score; the figure is the points it added to the 100-point composite (weight × sub-score).
- Cash flow +30.0/30.0
- ARV discount +15.0/15.0
- 1% rule +10.0/10.0
- DSCR +10.0/10.0
- Appreciation +10.0/10.0
- Livability +4.0/5.0
- Rent growth +3.6/5.0
- Condition / age +2.5/5.0
- Schools +1.2/10.0
$499,000
🖨 Deal sheet 📄 Offer letter ✓ Due diligence
Multi-family units
County records classify this as Multi-Family (5+ Unit). Listing-text estimate: 6 units. confirmed
5+ unit building — per-unit beds/baths from public records are typically unavailable; the breakdown below (if shown) is an estimate from the listing text.
Listing remarks MLS
Investor or Contractor's Dream Opportunity! Bring your vision and transform this six-family property into a true income-producing asset. Located in an up-and-coming area of Bridgeport, this property offers incredible potential for renovation and value-add improvements. Featuring 6 bedrooms and 6 bathrooms across multiple units, plus a private driveway for added convenience. Ideal for investors looking to expand their portfolio or contractors ready to create something special. Sale is subject to probate approval. Property is being sold strictly as-is. All parties entering the property must sign the attached hold harmless form prior to access. Don't miss the chance to unlock the full potential of this promising property! Buyers are responsible for conducting their own diligence. Subject to probate approval. Hold harmless form attached must be filled out and received by the listing agent prior to showing. Please note; most of the house is in accessible with miscellaneous items and belongings. Property will not qualify for conventional mortgage - cash only.
Key facts
- Private driveway
- 5,227 sq ft lot
- 2 parking spots
Tags
Neighborhood map
What this means for you Summary
Snapshot
- This is a 6 × 6-bed/6.0-bath units multifamily listed at $499k.
Deal economics
- At list price, monthly cash flow is $10k ($125k/yr) — positive. Per door: $2k/mo.
- The deal already cash-flows at list — no discount required.
- Meets the 1% rule at list price ($17k rent vs $499k).
- Cap rate 31.3% vs local median 5.0% in Bridgeport — top-decile yield for the area; either an underpriced asset or a hidden risk that comps aren't pricing in. Stress-test before assuming the spread holds.
Location & tenants
- Location reads 81/100 on livability (#15 in CT, #1,374 nationally) — a professional / high-income tenant draw. Strengths: amenities A+, commute A+, health & safety A+; Watch: crime C-, employment D+, schools D-.
- Bridgeport School District (urban): math 9% / reading 19% proficiency, ranked #151 of 153 in CT (top 99%) — low school quality limits family demand, transient renter base, plan for 1-2y turnover; 97% free/reduced lunch — lower-income household profile, screen leases tightly.
- Market conditions: Rents rising fast (+4.3%/yr); 30 active listings in the ZIP; 1 comparable units currently listed for rent nearby; 852 units permitted in Greater Bridgeport Planning Region in 2024 (698 in 5+ unit buildings).
- At $17,398/mo this rent would consume 456% of the median local household income ($46k/yr) (locally 910% of renters already pay >50% of income on rent) — very limited rent-growth headroom before tenants either downsize or default.
Forward outlook
- In year one you build about $53k of equity ($3k loan paydown + $50k appreciation (10.0% local appreciation)).
- At projected returns (10.0% appreciation + 4.3% rent growth), your $140k cash investment doubles in ~1 year — after that, you're playing with house money.
- By year 2, paydown + projected appreciation supports a ~$86k cash-out refi (75% LTV) — recoverable capital for the next deal without selling this one.
Negotiation context
- Only 5 days on market — expect competitive offers; lowballing is unlikely to land.
- 2 sale attempts since 29y ago with the ask held roughly flat each time — persistent listings suggest the price (not the market) is what's stuck; bring a comps-based counter.
Risks & watch-outs
- Watch-outs: built in 1915 — expect roof / HVAC / electrical / plumbing capex.
- Climate carrying-cost: major wind risk, 41% chance of damaging wind over 30y; extreme-heat days projected 7→15/yr by 2055 (HVAC capex compounding) — expect insurance premiums to compound above CPI over the hold.
Questions for the listing agent
- Can we see the unit-by-unit rent roll, current vacancy, and any below-market leases? What's the average tenancy length?
- What capital expenditures (roof, boiler, parking lot, exteriors) have been made in the last 5 years, and what's planned in the next 2?
- Built in 1915 — when were the roof, HVAC, electrical panel, plumbing, and water heater last replaced?
- Is there a deadline driving the sale (1031 exchange, divorce, estate, relocation)? That informs how much negotiation room exists.
- Schools are D-rated, which usually means shorter tenancies and higher turnover. Who's the typical renter profile here, and what's been the actual vacancy rate?
- What's the average days-on-market for RENTAL listings here right now (not sales)? A rising rental-DOM trend means longer vacancies and softer asking-rent achievability than the comps imply.
- What's the recent tenant-quality profile in this submarket — average credit score on applications, eviction rate, late-payment / NSF rate, and stable-employment percentage? A property-management company in the area should have these aggregated.
- How much new apartment / multifamily construction is in the pipeline within 1–3 miles? Heavy new supply (>2% of stock underway) typically softens rents 12–24 months out; light construction supports rent growth.
Investment metrics
- 1% rule
- 3.49% ✓
- Cap rate
- 31.34%
- Cash-on-cash
- 89.45%
- DSCR
- 4.98
- GRM
- 2.4
CMA / ARV
- ARV (median comp)
- $616,376
- List price
- $499,000
- Delta
- -19.04%
- Verdict
- UNDERPRICED
- Comps
- 20 within 1.0 mi
Show comp detail 1 sale within ~0.75 mi
| Address | Dist | Beds/Ba | Sqft | Sold | Price | $/sf | Match |
|---|---|---|---|---|---|---|---|
| 750 William St | 0.39mi | 7/5.0 (+1) | 4,075 (-10%) | 2mo | $670,000 | $164 | 53 |
Match score weights: distance 35% · size 25% · config 20% · recency 20%. Top-matched comps best support the ARV.
Projected returns pro-forma
10.0% appreciation · 4.35% rent growth · sell at horizon
- IRR
- 99.8%
- Equity multiple
- 7.87×
- Total profit
- $959,261
- Equity at exit
- $449,539
- IRR
- 95.5%
- Equity multiple
- 17.85×
- Total profit
- $2,354,930
- Equity at exit
- $969,447
Cash invested: $139,720 (down + closing). Projections, not guarantees.
Landlord ↔ Tenant lean methodology
- Overall (STATE)
- 27 Tenant-Leaning
- State Connecticut
- 27 Tenant-Leaning · D+7
- County
- — inherits STATE
- City
- — inherits STATE
ZIP-level market 06608
- Home prices YoY
- 3.6%
- Rents YoY
- 4.3%
- Active inventory
- 30
- Price-to-rent
- 14.3×
Monthly cashflow live
- Estimated rent
- $17,398 medium interval (Pro) →
- Mortgage (P&I)
- −$2,617
- Tax from tax record
- −$504 /mo · $6,053/yr
- Insurance
- −$208
- HOA
- −$0
- Vacancy / Maint / Mgmt
- −$3,654
- Net cashflow
- $10,415
Break-even live
6-unit breakdown (identical units grouped — click to expand)
| Units | Beds | Baths | Est. rent |
|---|---|---|---|
| 6× units | 6 | 6 | $17,400 |
| #1 | 6 | 6 | $2,900 |
| #2 | 6 | 6 | $2,900 |
| #3 | 6 | 6 | $2,900 |
| #4 | 6 | 6 | $2,900 |
| #5 | 6 | 6 | $2,900 |
| #6 | 6 | 6 | $2,900 |
| Total (6 units) | $17,398 | ||
UW: 25.0% down · 7.5% · 30yr · 1.5% tax · 5.0% vac · 8.0% maint · 8.0% mgmt
Financing live
Cash to close
- Down payment
- $124,750
- Closing costs
- $14,970
- Reserves months
- —
- Total cash needed
- —
Loan-product check · same deal, 3 products live
Conventional
25% down · 7.5% · 30yr
- Down + closing
- —
- Monthly P&I
- —
- Monthly cashflow
- —
- DSCR
- —
- Eligible?
- —
Personal DTI + credit; lowest rate.
DSCR
20% down · 8.5% · 30yr
- Down + closing
- —
- Monthly P&I
- —
- Monthly cashflow
- —
- DSCR
- —
- Eligible?
- —
No personal income docs; deal must DSCR.
Hard money
10% down · 12.0% · 12mo
- Down + closing
- —
- Monthly P&I
- —
- Monthly cashflow
- —
- DSCR
- —
- Eligible?
- —
Short-term bridge; refi at stabilization.
Rent comps 1 comps
| Address | Beds | Baths | Sqft | Rent | $/sqft | DOM | Units | Dist |
|---|---|---|---|---|---|---|---|---|
| 107 Catherine St Bridgeport, CT | 7.0 | 2.5 | 4104 | $2,900 | $0.71 | 14d | 1 | 1.14mi |
Listing history 4 events
-
2026-05-09status Under Contract 1069-char remark
Show marketing remark (1069 chars)
Investor or Contractor's Dream Opportunity! Bring your vision and transform this six-family property into a true income-producing asset. Located in an up-and-coming area of Bridgeport, this property offers incredible potential for renovation and value-add improvements. Featuring 6 bedrooms and 6 bathrooms across multiple units, plus a private driveway for added convenience. Ideal for investors looking to expand their portfolio or contractors ready to create something special. Sale is subject to probate approval. Property is being sold strictly as-is. All parties entering the property must sign the attached hold harmless form prior to access. Don't miss the chance to unlock the full potential of this promising property! Buyers are responsible for conducting their own diligence. Subject to probate approval. Hold harmless form attached must be filled out and received by the listing agent prior to showing. Please note; most of the house is in accessible with miscellaneous items and belongings. Property will not qualify for conventional mortgage - cash only.
-
2026-05-04$499,000 Active 1069-char remark
Show marketing remark (1069 chars)
Investor or Contractor's Dream Opportunity! Bring your vision and transform this six-family property into a true income-producing asset. Located in an up-and-coming area of Bridgeport, this property offers incredible potential for renovation and value-add improvements. Featuring 6 bedrooms and 6 bathrooms across multiple units, plus a private driveway for added convenience. Ideal for investors looking to expand their portfolio or contractors ready to create something special. Sale is subject to probate approval. Property is being sold strictly as-is. All parties entering the property must sign the attached hold harmless form prior to access. Don't miss the chance to unlock the full potential of this promising property! Buyers are responsible for conducting their own diligence. Subject to probate approval. Hold harmless form attached must be filled out and received by the listing agent prior to showing. Please note; most of the house is in accessible with miscellaneous items and belongings. Property will not qualify for conventional mortgage - cash only.
-
1997-12-22historical
-
1997-09-25$60,000
ⓘ Source: listings_history table (triggers on properties + properties_extension) + one-shot
backfill from property_details.listing_events for pre-trigger history.
Tax reassessment forecast CT · Partial reset (capped growth)
- Current annual tax
- $6,053 · $504/mo
- Projected year-2 tax
- $8,366 · $697/mo
- Expected delta
- +$2,313/yr (+$193/mo · 38.2%)
ⓘ Screening estimate from a state-policy table — verify with the county assessor before closing.
Climate risk First Street
- Flood 1/10 Low FEMA zone X (unshaded) · 0% chance over 30 yrs
- Wildfire 1/10 Low
- Heat 7/10 Severe 7 d/yr ≥97°F today · 15 d/yr by 30 yrs out
- Wind 6/10 Major 41% chance of damaging wind over 30 yrs
- Air quality 4/10 Moderate 5 unhealthy d/yr today · 7 by 30 yrs out
Nearby sold comps map
Loading sold comps map…
Walkable amenities ~0.75 mi
Loading nearby amenities…
Taxation est. · year 1
- Rental income
- $208,776
- − Mortgage interest
- −$27,952
- − Property taxes
- −$6,053
- − Insurance
- −$2,495
- − Repairs & maintenance
- −$16,702
- − Management
- −$16,702
- − Depreciation
- −$14,516
- Taxable income
- $124,356
- Est. tax owed @ 24.0%
- −$29,845
- After-tax cash flow
- $95,138/yr
For passive investors: Depreciation is non-cash, so a rental often shows a tax loss while cash-flowing — sheltering income. Rental losses are passive: they offset passive income freely, and up to $25,000/yr can offset ordinary (W-2) income if you actively participate and your MAGI is under $100k (phasing out to $0 by $150k); unused losses carry forward. On sale, claimed depreciation is recaptured at up to 25%, and gains may owe capital-gains tax (a 1031 exchange can defer both). Figures are a year-1 estimate at your 24.0% rate — not tax advice; consult a CPA.
Schools (NCES district)
- District
- Bridgeport School District
- NCES district ID
- 0900450
- Math proficiency
- 9% ▼ -7.00%
- Reading proficiency
- 19% ▼ -10.00%
- Median HH income
- $41,507
- Composite
- 12.09/100
- National rank
- #9656
- State rank
- #151 of 153 in CT
Livability — Bridgeport
- Score
- 81/100
- State rank
- #15
- US rank
- #1374
Category grades
Schools grade is shown separately in the Schools card above.
Census & demographics
- Census place
- Bridgeport, CT
- County
- Fairfield County · 765,532 people
- City population
- 149,153
- Metro
- Bridgeport-Stamford-Norwalk, CT
- Population (ZIP)
- 12,146
- Household income
- $45,754
- Rent vs Own
- Severe rent burden
- 910.0
Population outlook (Greater Bridgeport County) Hauer SSP2
- By 2040
- 365,581
Race, ethnicity, and origin ACS 2023
- Neighborhood character
- Predominantly Hispanic (69%)
- Race & ethnicity
- Hispanic / Latino 69% Black 22% Two or more races 19% White 4% Asian 4%
- Hispanic origin (detail)
- Mexican 5% Puerto Rican 32% Cuban 1% Dominican 14%
- Common ancestry
- Hispanic 1% Russian 1% Estonian 0%
- Foreign-born
- 34% · Canada, Jamaica
- Languages at home
- 33% English-only · Spanish 56% French/Haitian/Cajun 4% Other Asian/Pacific 3%
Political lean MEDSL · Greater Bridgeport
- 2024 margin
- Strong D (+23.3) · D 60.9% · R 37.6% · Other 1.5%
- All cycles
- 2024: D+23.3
Not yet ingested
- Civics
- —
Market trends
- HPI YoY
- ▲ 18.29%
- Current HPI
- 530.5125
- Rent YoY
- ▲ 4.35%
- Metro
- Bridgeport-Stamford-Norwalk, CT
- State GDP YoY
- ▲ 1.06%
- F500 in state
- 38
Industry mix (Fortune 500 HQ in CT)
| Industry | F500 HQs | Revenue |
|---|---|---|
| Industrial Machinery | 4 | $38B |
|
||
| Insurance | 3 | $71B |
|
||
| Financial Services | 2 | $25B |
|
||
| Transportation / Logistics | 2 | $18B |
|
||
| Healthcare | 1 | $247B |
|
||
| Telecommunications | 1 | $55B |
|
||
Price history
+731.7% since first listed4 events — show timeline
- 2026-05-09 Pending — Smart MLS
- 2026-05-04 Listed $499,000 Smart MLS
- 1997-12-22 Listing Removed — Smart MLS
- 1997-09-25 Listed $60,000 Smart MLS
Property tax history
+1.8%/yrLatest (2023): $6,053 · +0.0% YoY. Source: county tax records.
Cash-flow waterfall
monthlySold comps — $/sqft
last 12 mo · ≤1 miLoading sold comps…