 Duplex
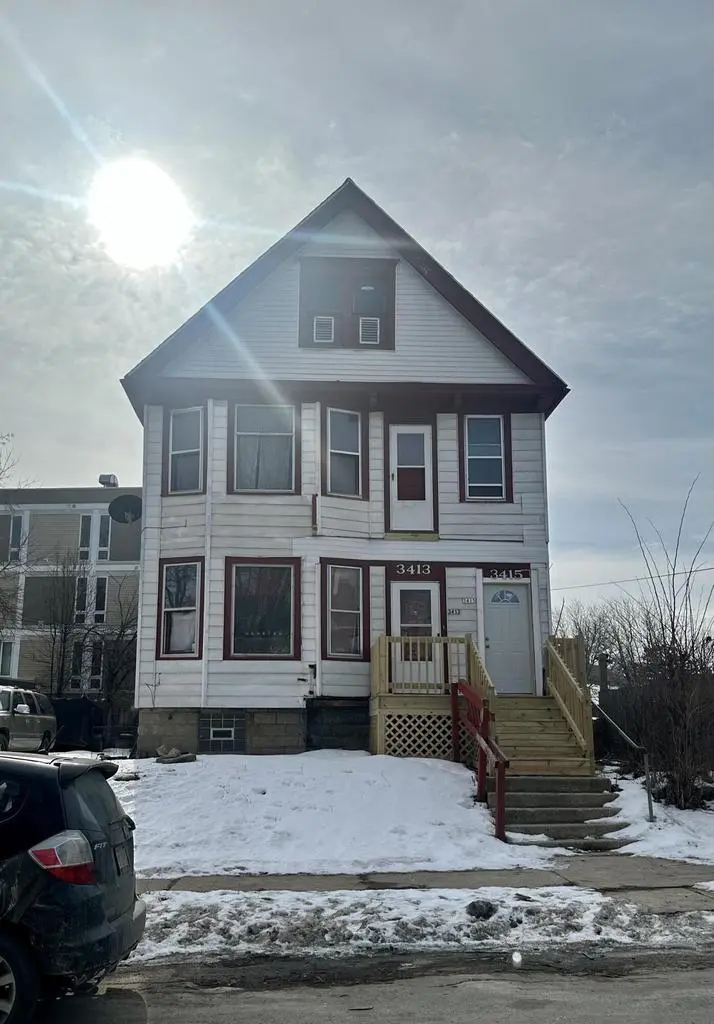
3413 W Vine St #3415 · Milwaukee, WI
Flood risk 1/10 · Minimal
- FEMA flood zone
- X (unshaded)
- Chance of flooding over 30 yrs
- 0.0%
- Est. flood insurance / yr
- $473 – $860
Fire risk 1/10 · Minimal
- Est. fire insurance / yr
- $636 – $1,182
Heat risk 2/10 · Minimal
- Hot days now (above 98°F)
- 7 days/yr
- Hot days in 30 yrs
- 13 days/yr
Wind risk 2/10 · Minimal
- Chance of severe wind over 30 yrs
- —
Air-quality risk 2/10 · Minimal
- Unhealthy air days now
- 2 days/yr
- Unhealthy air days in 30 yrs
- 2 days/yr
Risk factors via First Street. Map © Google.
Why this score? — see what drove the B- grade
The composite is a weighted blend of 9 inputs, each scored 0–100. Each bar is that input's sub-score; the figure is the points it added to the 100-point composite (weight × sub-score).
- Cash flow +30.0/30.0
- 1% rule +10.0/10.0
- DSCR +10.0/10.0
- Rent growth +5.0/5.0
- Livability +4.0/5.0
- Condition / age +3.8/5.0
- ARV discount +1.5/15.0
- Schools +1.2/10.0
- Appreciation +0.0/10.0
$110,000
🖨 Deal sheet 📄 Offer letter ✓ Due diligence
Multi-family units
County records classify this as Multi-Family (2-4 Unit). Listing-text estimate: 2 units. confirmed
Listing remarks MLS
Welcome to your next investment opportunity in Walnut Hill! Spacious, fully-occupied duplex with 2 bed, 1 bath units completely turnkey for the next owner. This duplex boasts a combined rental income of $20,000/year, providing a solid foundation for immediate cash flow. Both units have been renovated including flooring, updated windows, kitchen cabinets, bathrooms, new roof (2024), and new porch (2025). Don't miss out, Schedule your showing today. Pair this property with: MLS #1950250 and #1950252
Key facts
- 2,178 sq ft lot
- Built 1909
- Listed 120 days
Neighborhood map
What this means for you Summary
Snapshot
- This is a 2 × 2-bed/1.0-bath units multifamily listed at $110k. Condition is rated good.
Deal economics
- At list price, monthly cash flow is $1k ($12k/yr) — positive. Per door: $507/mo.
- The deal already cash-flows at list — no discount required.
- Meets the 1% rule at list price ($2k rent vs $110k).
- Recommended offer: $100k (9.0% below list) — sets the bar for market timing.
- Cap rate 17.3% vs local median 5.1% in Milwaukee — top-decile yield for the area; either an underpriced asset or a hidden risk that comps aren't pricing in. Stress-test before assuming the spread holds.
Location & tenants
- Location reads 81/100 on livability (#55 in WI, #1,534 nationally) — a professional / high-income tenant draw. Strengths: amenities A+, commute A+, cost of living A+; Watch: employment D+, schools F, crime F.
- Milwaukee School District (urban): math 10% / reading 18% proficiency, ranked #337 of 342 in WI (top 98%) — low school quality limits family demand, transient renter base, plan for 1-2y turnover; 77% free/reduced lunch — lower-income household profile, screen leases tightly.
- Market conditions: Rents rising fast (+10.8%/yr); 92 active listings in the ZIP; 8 comparable units currently listed for rent nearby; rentals at typical pace (median 24d on market — plan ~3-4 weeks tenant-placement turnaround); 1,017 units permitted in Milwaukee County in 2024 (803 in 5+ unit buildings).
- At $2,245/mo this rent would consume 51% of the median local household income ($53k/yr) (locally 1568% of renters already pay >50% of income on rent) — very limited rent-growth headroom before tenants either downsize or default.
Forward outlook
- Local home prices are declining (-3.0%/yr); year-one equity from $761 of loan paydown is wiped out by about $3k of value loss. Plan a longer hold.
- Milwaukee County population projected at +4% by 2050 — modest demand growth; plan on rents tracking national, not racing it.
- At projected returns (-3.0% appreciation + 8.0% rent growth), your $31k cash investment doubles in ~3 years — after that, you're playing with house money.
Negotiation context
- It's been on market 120 days — a 9% lower offer ($100k) is reasonable based on typical stale-listing flexibility.
- 6 sale attempts since 4y ago with the ask held roughly flat each time — persistent listings suggest the price (not the market) is what's stuck; bring a comps-based counter.
- Current owner paid $79k; 39% above their basis — modest negotiation headroom, anchor on the comps not their cost.
Risks & watch-outs
- Watch-outs: built in 1909 — expect roof / HVAC / electrical / plumbing capex.
Questions for the listing agent
- It's been on market 120 days. Have you received any prior offers? Is the seller open to a 9% concession, seller financing, or rate buy-down credit?
- Can we see the unit-by-unit rent roll, current vacancy, and any below-market leases? What's the average tenancy length?
- What capital expenditures (roof, boiler, parking lot, exteriors) have been made in the last 5 years, and what's planned in the next 2?
- Built in 1909 — when were the roof, HVAC, electrical panel, plumbing, and water heater last replaced?
- Why hasn't it sold? Are there any deal-killer items the seller is aware of (foundation, flood, title, zoning, code violations)?
- Is there a deadline driving the sale (1031 exchange, divorce, estate, relocation)? That informs how much negotiation room exists.
- Schools are F-rated, which usually means shorter tenancies and higher turnover. Who's the typical renter profile here, and what's been the actual vacancy rate?
- Crime grade is F in this area — have there been break-ins, vandalism, or insurance claims at this property in the last 3 years? What carrier currently insures it and at what premium?
- What's the average days-on-market for RENTAL listings here right now (not sales)? A rising rental-DOM trend means longer vacancies and softer asking-rent achievability than the comps imply.
- What's the recent tenant-quality profile in this submarket — average credit score on applications, eviction rate, late-payment / NSF rate, and stable-employment percentage? A property-management company in the area should have these aggregated.
- How much new apartment / multifamily construction is in the pipeline within 1–3 miles? Heavy new supply (>2% of stock underway) typically softens rents 12–24 months out; light construction supports rent growth.
Investment metrics
- 1% rule
- 2.04% ✓
- Cap rate
- 17.35%
- Cash-on-cash
- 39.48%
- DSCR
- 2.76
- GRM
- 4.1
CMA / ARV
- ARV (median comp)
- $96,970
- List price
- $110,000
- Delta
- 13.44%
- Verdict
- OVERPRICED
- Comps
- 20 within 1.0 mi
Show comp detail 12 sales within ~0.75 mi
| Address | Dist | Beds/Ba | Sqft | Sold | Price | $/sf | Match |
|---|---|---|---|---|---|---|---|
| 2014 N 35th St #2016 | 0.13mi | 4/2.0 | 2,208 (+7%) | 2mo | $72,000 | $33 | 80 |
| 1713 N 29th St #1715 | 0.36mi | 4/2.0 | 2,191 (+6%) | 3mo | $97,000 | $44 | 71 |
| 3733 W Sarnow St #3735 | 0.21mi | 4/2.0 | 2,288 (+11%) | 2mo | $157,000 | $69 | 70 |
| 2137 N 31st St | 0.33mi | 5/2.0 (+1) | 1,919 (-7%) | 1mo | $138,500 | $72 | 67 |
| 2149 N 41st St | 0.47mi | 4/2.0 | 1,931 (-6%) | 1mo | $33,000 | $17 | 67 |
| 2118 N 38th St #2120 | 0.29mi | 4/2.0 | 2,341 (+13%) | 0mo | $62,500 | $27 | 64 |
| 2400 N 35th St #2402 | 0.53mi | 5/2.0 (+1) | 1,994 (-3%) | 1mo | $65,000 | $33 | 64 |
| 1925 N 27th St #1927 | 0.46mi | 4/2.0 | 2,266 (+10%) | 4mo | $90,000 | $40 | 59 |
| 1440 N 28th St | 0.56mi | 5/2.0 (+1) | 1,982 (-4%) | 5mo | $95,000 | $48 | 58 |
| 3127 W Garfield Ave #3129 | 0.33mi | 5/2.0 (+1) | 2,332 (+13%) | 0mo | $130,000 | $56 | 58 |
| 2229 N 41st St #2231 | 0.53mi | 4/2.0 | 2,346 (+14%) | 5mo | $139,500 | $59 | 49 |
| 4324 W Lisbon Ave | 0.63mi | 3/2.0 (-1) | 1,777 (-14%) | 0mo | $36,000 | $20 | 42 |
Match score weights: distance 35% · size 25% · config 20% · recency 20%. Top-matched comps best support the ARV.
Projected returns pro-forma
-3.0% appreciation · 8.0% rent growth · sell at horizon
- IRR
- 41.3%
- Equity multiple
- 2.90×
- Total profit
- $58,615
- Equity at exit
- $16,401
- IRR
- 49.9%
- Equity multiple
- 7.11×
- Total profit
- $188,286
- Equity at exit
- $9,511
Cash invested: $30,800 (down + closing). Projections, not guarantees.
Landlord ↔ Tenant lean methodology
- Overall (STATE)
- 73 Landlord-Friendly
- State Wisconsin
- 73 Landlord-Friendly · R+2
- County
- — inherits STATE
- City
- — inherits STATE
ZIP-level market 53208
- Home prices YoY
- -27.1%
- Rents YoY
- 10.8%
- Active inventory
- 92
- Price-to-rent
- 8.2×
Monthly cashflow live
- Estimated rent
- $2,245 high interval (Pro) →
- Mortgage (P&I)
- −$577
- Tax est. 1.5%
- −$138 /mo · $1,650/yr
- Insurance
- −$46
- HOA
- −$0
- Vacancy / Maint / Mgmt
- −$471
- Net cashflow
- $1,013
Break-even live
2-unit breakdown (identical units grouped — click to expand)
| Units | Beds | Baths | Est. rent |
|---|---|---|---|
| 2× units | 2 | 1 | $2,246 |
| #1 | 2 | 1 | $1,123 |
| #2 | 2 | 1 | $1,123 |
| Total (2 units) | $2,245 | ||
UW: 25.0% down · 7.5% · 30yr · 1.5% tax · 5.0% vac · 8.0% maint · 8.0% mgmt
Financing live
Cash to close
- Down payment
- $27,500
- Closing costs
- $3,300
- Reserves months
- —
- Total cash needed
- —
Loan-product check · same deal, 3 products live
Conventional
25% down · 7.5% · 30yr
- Down + closing
- —
- Monthly P&I
- —
- Monthly cashflow
- —
- DSCR
- —
- Eligible?
- —
Personal DTI + credit; lowest rate.
DSCR
20% down · 8.5% · 30yr
- Down + closing
- —
- Monthly P&I
- —
- Monthly cashflow
- —
- DSCR
- —
- Eligible?
- —
No personal income docs; deal must DSCR.
Hard money
10% down · 12.0% · 12mo
- Down + closing
- —
- Monthly P&I
- —
- Monthly cashflow
- —
- DSCR
- —
- Eligible?
- —
Short-term bridge; refi at stabilization.
Rent comps 8 comps
| Address | Beds | Baths | Sqft | Rent | $/sqft | DOM | Units | Dist |
|---|---|---|---|---|---|---|---|---|
| 1639 N 33rd St Milwaukee, WI | 3.0 | 1.0 | 1424 | $950 | $0.67 | 23d | 1 | 0.20mi |
| 2432 N 28th St Milwaukee, WI | 5.0 | 1.5 | 1876 | $1,600 | $0.85 | 44d | 1 | 0.71mi |
| 2137 N 47th St Milwaukee, WI | 5.0 | 2.0 | 1723 | $1,850 | $1.07 | 14d | 1 | 0.82mi |
| 2809 W Clarke St Unit 12811 Milwaukee, WI | 3.0 | 1.0 | 1400 | $1,200 | $0.86 | 17d | 1 | 0.85mi |
| 2119 W Brown St Milwaukee, WI | 3.0 | 1.0 | 1754 | $995 | $0.57 | 3d | 1 | 0.88mi |
| 2308 W Clarke St Milwaukee, WI | 4.0 | 2.0 | 1545 | $1,750 | $1.13 | 23d | 1 | 1.10mi |
| 2713 N 44th St Milwaukee, WI | 3.0 | 1.0 | 1450 | $1,350 | $0.93 | 44d | 1 | 1.10mi |
| 4802 W Wells St Unit 4802-1 Milwaukee, WI | 3.0 | 2.0 | 1700 | $1,799 | $1.06 | 44d | 1 | 1.35mi |
Listing history 31 events
-
2026-06-18days on market $110,000 Active 120 DOM
-
2026-06-17days on market $110,000 Active 119 DOM
-
2026-06-16days on market $110,000 Active 118 DOM
-
2026-06-15days on market $110,000 Active 117 DOM
-
2026-06-13days on market $110,000 Active 115 DOM
-
2026-06-13days on market $110,000 Active 114 DOM
-
2026-06-09days on market $110,000 Active 111 DOM
-
2026-06-08days on market $110,000 Active 110 DOM
-
2026-06-07days on market $110,000 Active 109 DOM
-
2026-06-05days on market $110,000 Active 106 DOM
-
2026-06-03days on market $110,000 Active 105 DOM
-
2026-06-02days on market $110,000 Active 104 DOM
-
2026-06-01days on market $110,000 Active 103 DOM
-
2026-05-31days on market $110,000 Active 102 DOM
-
2026-02-18$110,000 Active 504-char remark
Show marketing remark (504 chars)
Welcome to your next investment opportunity in Walnut Hill! Spacious, fully-occupied duplex with 2 bed, 1 bath units completely turnkey for the next owner. This duplex boasts a combined rental income of $20,000/year, providing a solid foundation for immediate cash flow. Both units have been renovated including flooring, updated windows, kitchen cabinets, bathrooms, new roof (2024), and new porch (2025). Don't miss out, Schedule your showing today. Pair this property with: MLS #1950250 and #1950252
-
2026-02-13historical $110,000 504-char remark
Show marketing remark (504 chars)
Welcome to your next investment opportunity in Walnut Hill! Spacious, fully-occupied duplex with 2 bed, 1 bath units completely turnkey for the next owner. This duplex boasts a combined rental income of $20,000/year, providing a solid foundation for immediate cash flow. Both units have been renovated including flooring, updated windows, kitchen cabinets, bathrooms, new roof (2024), and new porch (2025). Don't miss out, Schedule your showing today. Pair this property with: MLS #1950250 and #1950252
-
2024-11-17historical 446-char remark
Show marketing remark (446 chars)
Welcome to your next investment opportunity in Walnut Hill! Spacious, fully-occupied duplex with 2 bed, 1 bath units completely turnkey for the next owner. This duplex boasts a combined rental income of $20,000 last year, providing a solid foundation for immediate cash flow. Both units have been fully renovated including flooring, updated windows, kitchen cabinets, bathrooms, and a new roof (2024). Don't miss out, Schedule your showing today
-
2024-09-23price $110,000 446-char remark
Show marketing remark (446 chars)
Welcome to your next investment opportunity in Walnut Hill! Spacious, fully-occupied duplex with 2 bed, 1 bath units completely turnkey for the next owner. This duplex boasts a combined rental income of $20,000 last year, providing a solid foundation for immediate cash flow. Both units have been fully renovated including flooring, updated windows, kitchen cabinets, bathrooms, and a new roof (2024). Don't miss out, Schedule your showing today
-
2024-08-28$115,000 Active 446-char remark
Show marketing remark (446 chars)
Welcome to your next investment opportunity in Walnut Hill! Spacious, fully-occupied duplex with 2 bed, 1 bath units completely turnkey for the next owner. This duplex boasts a combined rental income of $20,000 last year, providing a solid foundation for immediate cash flow. Both units have been fully renovated including flooring, updated windows, kitchen cabinets, bathrooms, and a new roof (2024). Don't miss out, Schedule your showing today
-
2024-07-10historical
-
2024-06-15price $110,000
-
2024-06-06$115,000 Active
-
2024-06-05historical
-
2024-05-14historical Contingent
-
2024-05-02status Active
-
2024-04-18historical Contingent
-
2024-04-12price $125,000
-
2024-03-21$130,000 Active
-
2022-07-20soldstatus $79,000 Sold
-
2022-04-17historical Contingent
-
2022-04-05$80,000 Active
ⓘ Source: listings_history table (triggers on properties + properties_extension) + one-shot
backfill from property_details.listing_events for pre-trigger history.
Climate risk First Street
- Flood 1/10 Low FEMA zone X (unshaded) · 0% chance over 30 yrs
- Wildfire 1/10 Low
- Heat 2/10 Low 7 d/yr ≥98°F today · 13 d/yr by 30 yrs out
- Wind 2/10 Low
- Air quality 2/10 Low 2 unhealthy d/yr today · 2 by 30 yrs out
Nearby sold comps map
Loading sold comps map…
Walkable amenities ~0.75 mi
Loading nearby amenities…
Taxation est. · year 1
- Rental income
- $26,940
- − Mortgage interest
- −$6,162
- − Property taxes
- −$1,650
- − Insurance
- −$550
- − Repairs & maintenance
- −$2,155
- − Management
- −$2,155
- − Depreciation
- −$3,200
- Taxable income
- $11,068
- Est. tax owed @ 24.0%
- −$2,656
- After-tax cash flow
- $9,504/yr
For passive investors: Depreciation is non-cash, so a rental often shows a tax loss while cash-flowing — sheltering income. Rental losses are passive: they offset passive income freely, and up to $25,000/yr can offset ordinary (W-2) income if you actively participate and your MAGI is under $100k (phasing out to $0 by $150k); unused losses carry forward. On sale, claimed depreciation is recaptured at up to 25%, and gains may owe capital-gains tax (a 1031 exchange can defer both). Figures are a year-1 estimate at your 24.0% rate — not tax advice; consult a CPA.
Condition & rehab AI · 13 photos
This fully-renovated and move-in-ready duplex is in excellent condition with updated kitchens, bathrooms, and exterior. It offers a solid investment opportunity with a combined rental income of $20,000/year.
Value-add opportunities
- Both Painting exterior siding — Enhances curb appeal and property value.
- Both Landscaping improvements — Enhances curb appeal and property value.
Renovation cost estimate screening
Value-add ROI direction
- Both Painting exterior siding — Enhances curb appeal and property value. ↑
- Both Landscaping improvements — Enhances curb appeal and property value. ↑
ⓘ Cost ranges are severity-bucket heuristics (US national rule-of-thumb). Get contractor quotes + a written scope before underwriting a rehab budget.
Schools (NCES district)
- District
- Milwaukee School District
- NCES district ID
- 5509600
- Math proficiency
- 10% ▼ -5.00%
- Reading proficiency
- 18% ▬ 0.00%
- Median HH income
- $36,339
- Composite
- 11.61/100
- National rank
- #9696
- State rank
- #337 of 342 in WI
Livability — Milwaukee
- Score
- 81/100
- State rank
- #55
- US rank
- #1534
Category grades
Schools grade is shown separately in the Schools card above.
Census & demographics
- Census place
- Milwaukee, WI
- County
- Milwaukee County · 926,379 people
- City population
- 573,768
- Metro
- Milwaukee-Waukesha, WI
- Population (ZIP)
- 27,201
- Household income
- $52,690
- Rent vs Own
- Severe rent burden
- 1568.0
Population outlook (Milwaukee County) Hauer SSP2
- Today (2025)
- 995,758 people
- By 2030
- 1,009,124 · +1.3%
- By 2040
- 1,028,128 · +3.3%
- By 2050
- 1,040,066 · +4.4%
- By 2075
- 1,057,849 · +6.2%
- By 2100
- 1,039,774 · +4.4%
Race, ethnicity, and origin ACS 2023
- Neighborhood character
- Diverse neighborhood (Simpson 0.69)
- Race & ethnicity
- Black 41% White 36% Hispanic / Latino 10% Asian 9% Two or more races 6%
- Hispanic origin (detail)
- Mexican 7% Puerto Rican 2%
- Common ancestry
- Romanian 5% Italian 2% Lithuanian 2%
- Foreign-born
- 9% · Canada, Philippines
- Languages at home
- 84% English-only · Other Asian/Pacific 6% Spanish 6% French/Haitian/Cajun 1%
Political lean MEDSL · Milwaukee
- 2024 margin
- Solid D (+38.5) · D 68.3% · R 29.8% · Other 1.8%
- 2008→2024 swing
- +2.7pp toward D · 2008: 35.9pp · 2024: 38.5pp
- All cycles
- 2024: D+38.5 2020: D+39.9 2016: D+37.5 2012: D+34.6 2008: D+35.9
Not yet ingested
- Civics
- —
Market trends
- HPI YoY
- ▼ -123.92%
- Current HPI
- 333.7268
- Rent YoY
- ▲ 10.78%
- Metro
- Milwaukee-Waukesha, WI
- State GDP YoY
- ▲ 2.10%
- F500 in state
- 20
Industry mix (Fortune 500 HQ in WI)
| Industry | F500 HQs | Revenue |
|---|---|---|
| Industrial Machinery | 4 | $23B |
|
||
| Industrial Technology | 2 | $36B |
|
||
| Insurance | 1 | $36B |
|
||
| Professional Services | 1 | $19B |
|
||
| Utilities | 1 | $9B |
|
||
| Consumer Goods | 1 | $3B |
|
||
Price history
+37.5% since first listed17 events — show timeline
- 2026-02-18 Listed $110,000 METROMLS
- 2026-02-13 Coming Soon $110,000 METROMLS
- 2024-11-17 Listing Removed — METROMLS
- 2024-09-23 Price Changed $110,000 METROMLS
- 2024-08-28 Listed $115,000 METROMLS
- 2024-07-10 Listing Removed — METROMLS
- 2024-06-15 Price Changed $110,000 METROMLS
- 2024-06-06 Listed $115,000 METROMLS
- 2024-06-05 Listing Removed — METROMLS
- 2024-05-14 Contingent — METROMLS
- 2024-05-02 Relisted — METROMLS
- 2024-04-18 Contingent — METROMLS
- 2024-04-12 Price Changed $125,000 METROMLS
- 2024-03-21 Listed $130,000 METROMLS
- 2022-07-20 Sold (MLS) $79,000 METROMLS
- 2022-04-17 Contingent — METROMLS
- 2022-04-05 Listed $80,000 METROMLS
Cash-flow waterfall
monthlySold comps — $/sqft
last 12 mo · ≤1 miLoading sold comps…