 20-Plex
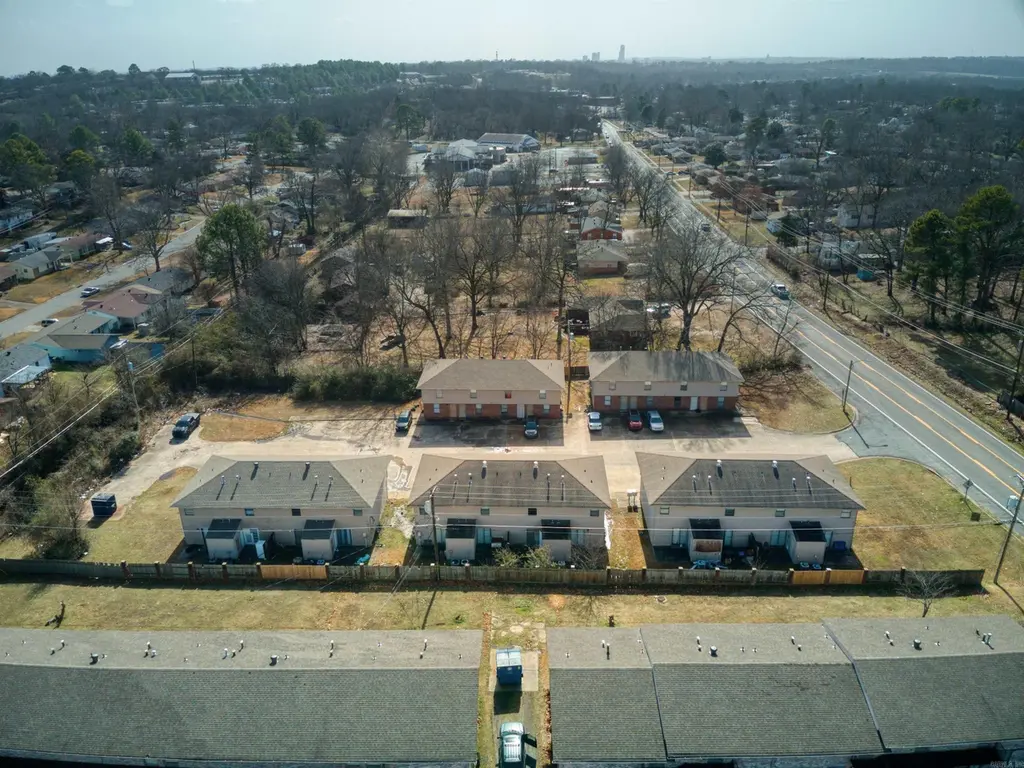
5732 Camp Robinson Rd · North Little Rock, AR
Flood risk 8/10 · Major
- FEMA flood zone
- X (unshaded)
- Chance of flooding over 30 yrs
- 0.99%
- Est. flood insurance / yr
- $507 – $1,088
Fire risk 3/10 · Minor
- Est. fire insurance / yr
- $1,499 – $2,785
Heat risk 7/10 · Major
- Hot days now (above 112°F)
- 7 days/yr
- Hot days in 30 yrs
- 19 days/yr
Wind risk 4/10 · Minor
- Chance of severe wind over 30 yrs
- 9.0%
Air-quality risk 2/10 · Minimal
- Unhealthy air days now
- 1 days/yr
- Unhealthy air days in 30 yrs
- 1 days/yr
Risk factors via First Street. Map © Google.
Why this score? — see what drove the C grade
The composite is a weighted blend of 9 inputs, each scored 0–100. Each bar is that input's sub-score; the figure is the points it added to the 100-point composite (weight × sub-score).
- Cash flow +23.5/30.0
- DSCR +7.6/10.0
- ARV discount +7.5/15.0
- 1% rule +6.1/10.0
- Rent growth +3.9/5.0
- Condition / age +3.8/5.0
- Livability +3.7/5.0
- Schools +2.0/10.0
- Appreciation +0.0/10.0
$1,850,000
🖨 Deal sheet 📄 Offer letter ✓ Due diligence
Multi-family units
County records classify this as Multi-Family (5+ Unit). Listing-text estimate: 20 units. confirmed
5+ unit building — per-unit beds/baths from public records are typically unavailable; the breakdown below (if shown) is an estimate from the listing text.
Listing remarks MLS
Strong addition to any portfolio—this 20-unit income-producing property in North Little Rock features 5 buildings on nearly 1.5 acres. All units are 2 bed, 1.5 bath with in-unit laundry. Tenants pay all utilities except water. Roofs are less than 5 years old; low-maintenance exteriors. Several units have been updated with new flooring, fixtures, cabinets, appliances, and granite countertops. Plenty of parking. Consistent cash flow with value-add potential—don’t miss this opportunity! See agent remarks.
Key facts
- Updated cabinets
- In unit laundry
- Updated flooring
Tags
Neighborhood map
What this means for you Summary
Snapshot
- This is a 20 × 2.0-bed/1.5-bath units multifamily listed at $1.85M. Condition is rated good.
Deal economics
- At list price, monthly cash flow is $3k ($41k/yr) — positive. Per door: $170/mo.
- The deal already cash-flows at list — no discount required.
- Meets the 1% rule at list price ($21k rent vs $1.85M).
- Recommended offer: $1.74M (6.0% below list) — sets the bar for market timing.
- Cap rate 8.5% vs local median 5.1% in North Little Rock — top-decile yield for the area; either an underpriced asset or a hidden risk that comps aren't pricing in. Stress-test before assuming the spread holds.
Location & tenants
- Location reads 73/100 on livability (#24 in AR) — a middle-class / working-renter tenant base. Strengths: commute A+, cost of living A+, housing A+; Watch: schools D+, crime F, amenities F.
- N. Little Rock School District (urban): math 21% / reading 26% proficiency, ranked #191 of 238 in AR (top 80%) — low school quality limits family demand, transient renter base, plan for 1-2y turnover; 66% free/reduced lunch — lower-income household profile, screen leases tightly.
- Market conditions: Rents rising fast (+5.5%/yr); 105 active listings in the ZIP; 1,006 units permitted in Pulaski County in 2024 (0 in 5+ unit buildings).
- At $20,575/mo this rent would consume 498% of the median local household income ($50k/yr) (locally 1149% of renters already pay >50% of income on rent) — very limited rent-growth headroom before tenants either downsize or default.
Forward outlook
- Local home prices are declining (-3.0%/yr); year-one equity from $13k of loan paydown is wiped out by about $56k of value loss. Plan a longer hold.
- Pulaski County population projected at +6% by 2050 — modest demand growth; plan on rents tracking national, not racing it.
- At projected returns (-3.0% appreciation + 5.5% rent growth), your $518k cash investment doubles in ~10 years — after that, you're playing with house money.
Negotiation context
- It's been on market 63 days — a 6% lower offer ($1.74M) is reasonable based on typical stale-listing flexibility.
- 8 sale attempts since 2y ago with the ask held roughly flat each time — persistent listings suggest the price (not the market) is what's stuck; bring a comps-based counter.
Risks & watch-outs
- Watch-outs: flood insurance adds $66/mo.
- Climate carrying-cost: severe flood risk; extreme-heat days projected 7→19/yr by 2055 (HVAC capex compounding) — expect insurance premiums to compound above CPI over the hold.
Questions for the listing agent
- It's been on market 63 days. Have you received any prior offers? Is the seller open to a 6% concession, seller financing, or rate buy-down credit?
- Can we see the unit-by-unit rent roll, current vacancy, and any below-market leases? What's the average tenancy length?
- What capital expenditures (roof, boiler, parking lot, exteriors) have been made in the last 5 years, and what's planned in the next 2?
- What's the actual annual flood-insurance premium (NFIP or private), and is the property in a SFHA with mandatory coverage?
- Why hasn't it sold? Are there any deal-killer items the seller is aware of (foundation, flood, title, zoning, code violations)?
- Is there a deadline driving the sale (1031 exchange, divorce, estate, relocation)? That informs how much negotiation room exists.
- Schools are D-rated, which usually means shorter tenancies and higher turnover. Who's the typical renter profile here, and what's been the actual vacancy rate?
- Crime grade is F in this area — have there been break-ins, vandalism, or insurance claims at this property in the last 3 years? What carrier currently insures it and at what premium?
- What's the average days-on-market for RENTAL listings here right now (not sales)? A rising rental-DOM trend means longer vacancies and softer asking-rent achievability than the comps imply.
- What's the recent tenant-quality profile in this submarket — average credit score on applications, eviction rate, late-payment / NSF rate, and stable-employment percentage? A property-management company in the area should have these aggregated.
- How much new apartment / multifamily construction is in the pipeline within 1–3 miles? Heavy new supply (>2% of stock underway) typically softens rents 12–24 months out; light construction supports rent growth.
Investment metrics
- 1% rule
- 1.11% ✓
- Cap rate
- 8.54%
- Cash-on-cash
- 8.04%
- DSCR
- 1.36
- GRM
- 7.5
CMA / ARV
- ARV (median comp)
- $279,634
- List price
- $1,850,000
- Delta
- 561.58%
- Verdict
- OVERPRICED
- Comps
- 4 within 2.0 mi
Projected returns pro-forma
-3.0% appreciation · 5.47% rent growth · sell at horizon
- IRR
- -1.5%
- Equity multiple
- 0.94×
- Total profit
- $-30,305
- Equity at exit
- $275,841
- IRR
- 10.7%
- Equity multiple
- 1.93×
- Total profit
- $480,274
- Equity at exit
- $159,954
Cash invested: $518,000 (down + closing). Projections, not guarantees.
Landlord ↔ Tenant lean methodology
- Overall (STATE)
- 92 Strongly Landlord-Friendly
- State Arkansas
- 92 Strongly Landlord-Friendly · R+14
- County
- — inherits STATE
- City
- — inherits STATE
ZIP-level market 72118
- Home prices YoY
- -17.9%
- Rents YoY
- 5.5%
- Active inventory
- 105
- Price-to-rent
- 149.9×
Monthly cashflow live
- Estimated rent
- $20,575 high interval (Pro) →
- Mortgage (P&I)
- −$9,702
- Tax est. 1.5%
- −$2,312 /mo · $27,750/yr
- Insurance
- −$771
- Flood insurance flood zone
- −$66 /mo · $798/yr
- HOA
- −$0
- Vacancy / Maint / Mgmt
- −$4,321
- Net cashflow
- $3,403
Break-even live
20-unit breakdown (identical units grouped — click to expand)
| Units | Beds | Baths | Est. rent |
|---|---|---|---|
| 20× units | 2.0 | 1.5 | $20,580 |
| #1 | 2.0 | 1.5 | $1,029 |
| #2 | 2.0 | 1.5 | $1,029 |
| #3 | 2.0 | 1.5 | $1,029 |
| #4 | 2.0 | 1.5 | $1,029 |
| #5 | 2.0 | 1.5 | $1,029 |
| #6 | 2.0 | 1.5 | $1,029 |
| #7 | 2.0 | 1.5 | $1,029 |
| #8 | 2.0 | 1.5 | $1,029 |
| #9 | 2.0 | 1.5 | $1,029 |
| #10 | 2.0 | 1.5 | $1,029 |
| #11 | 2.0 | 1.5 | $1,029 |
| #12 | 2.0 | 1.5 | $1,029 |
| #13 | 2.0 | 1.5 | $1,029 |
| #14 | 2.0 | 1.5 | $1,029 |
| #15 | 2.0 | 1.5 | $1,029 |
| #16 | 2.0 | 1.5 | $1,029 |
| #17 | 2.0 | 1.5 | $1,029 |
| #18 | 2.0 | 1.5 | $1,029 |
| #19 | 2.0 | 1.5 | $1,029 |
| #20 | 2.0 | 1.5 | $1,029 |
| Total (20 units) | $20,575 | ||
UW: 25.0% down · 7.5% · 30yr · 1.5% tax · 5.0% vac · 8.0% maint · 8.0% mgmt
Financing live
Cash to close
- Down payment
- $462,500
- Closing costs
- $55,500
- Reserves months
- —
- Total cash needed
- —
Loan-product check · same deal, 3 products live
Conventional
25% down · 7.5% · 30yr
- Down + closing
- —
- Monthly P&I
- —
- Monthly cashflow
- —
- DSCR
- —
- Eligible?
- —
Personal DTI + credit; lowest rate.
DSCR
20% down · 8.5% · 30yr
- Down + closing
- —
- Monthly P&I
- —
- Monthly cashflow
- —
- DSCR
- —
- Eligible?
- —
No personal income docs; deal must DSCR.
Hard money
10% down · 12.0% · 12mo
- Down + closing
- —
- Monthly P&I
- —
- Monthly cashflow
- —
- DSCR
- —
- Eligible?
- —
Short-term bridge; refi at stabilization.
Listing history 32 events
-
2026-06-18days on market $1,850,000 Active 63 DOM
-
2026-06-17days on market $1,850,000 Active 62 DOM
-
2026-06-16days on market $1,850,000 Active 61 DOM
-
2026-06-15days on market $1,850,000 Active 60 DOM
-
2026-06-14days on market $1,850,000 Active 58 DOM
-
2026-06-13days on market $1,850,000 Active 57 DOM
-
2026-06-10days on market $1,850,000 Active 55 DOM
-
2026-06-09days on market $1,850,000 Active 54 DOM
-
2026-06-08days on market $1,850,000 Active 53 DOM
-
2026-06-07days on market $1,850,000 Active 52 DOM
-
2026-06-05days on market $1,850,000 Active 49 DOM
-
2026-06-03days on market $1,850,000 Active 48 DOM
-
2026-06-02days on market $1,850,000 Active 47 DOM
-
2026-06-01days on market $1,850,000 Active 46 DOM
-
2026-05-31days on market $1,850,000 Active 45 DOM
-
2026-05-31days on market $1,850,000 Active 44 DOM
-
2026-04-16$1,850,000 New Listing 526-char remark
Show marketing remark (526 chars)
Strong addition to any portfolio—this 20-unit income-producing property in North Little Rock features 5 buildings on nearly 1.5 acres. All units are 2 bed, 1.5 bath with in-unit laundry. Tenants pay all utilities except water. Roofs are less than 5 years old; low-maintenance exteriors. Several units have been updated with new flooring, fixtures, cabinets, appliances, and granite countertops. Plenty of parking. Consistent cash flow with value-add potential—don’t miss this opportunity! See agent remarks.
-
2025-12-04historical
-
2025-09-03$1,625,000 New Listing
-
2025-08-08historical
-
2025-07-16price $1,675,000
-
2025-05-06$1,850,000 New Listing
-
2024-08-31historical $800
-
2024-08-28$800
-
2024-08-17historical $800
-
2024-07-03historical $800
-
2024-07-03$800
-
2024-07-03$800
-
2024-05-16historical $775
-
2024-04-10$775
-
2024-04-10historical $800
-
2024-01-05$800
ⓘ Source: listings_history table (triggers on properties + properties_extension) + one-shot
backfill from property_details.listing_events for pre-trigger history.
Climate risk First Street
- Flood 8/10 Severe FEMA zone X (unshaded) · 99% chance over 30 yrs
- Wildfire 3/10 Moderate
- Heat 7/10 Severe 7 d/yr ≥112°F today · 19 d/yr by 30 yrs out
- Wind 4/10 Moderate 9% chance of damaging wind over 30 yrs
- Air quality 2/10 Low 1 unhealthy d/yr today · 1 by 30 yrs out
Nearby sold comps map
Loading sold comps map…
Walkable amenities ~0.75 mi
Loading nearby amenities…
Taxation est. · year 1
- Rental income
- $246,900
- − Mortgage interest
- −$103,629
- − Property taxes
- −$27,750
- − Insurance
- −$10,048
- − Repairs & maintenance
- −$19,752
- − Management
- −$19,752
- − Depreciation
- −$53,818
- Taxable income
- $12,152
- Est. tax owed @ 24.0%
- −$2,916
- After-tax cash flow
- $37,918/yr
For passive investors: Depreciation is non-cash, so a rental often shows a tax loss while cash-flowing — sheltering income. Rental losses are passive: they offset passive income freely, and up to $25,000/yr can offset ordinary (W-2) income if you actively participate and your MAGI is under $100k (phasing out to $0 by $150k); unused losses carry forward. On sale, claimed depreciation is recaptured at up to 25%, and gains may owe capital-gains tax (a 1031 exchange can defer both). Figures are a year-1 estimate at your 24.0% rate — not tax advice; consult a CPA.
Condition & rehab AI · 12 photos
This 20-unit income-producing property in North Little Rock is in good condition with updated kitchens and bathrooms. It has low-maintenance exteriors and ample parking. The property is ready for immediate rental or resale.
Value-add opportunities
- Both landscaping — improves curb appeal and enhances property value
- Both exterior paint — enhances curb appeal and property value
- Both landscaping — improves curb appeal and enhances property value
Renovation cost estimate screening
Value-add ROI direction
- Both landscaping — improves curb appeal and enhances property value ↑
- Both exterior paint — enhances curb appeal and property value ↑
- Both landscaping — improves curb appeal and enhances property value ↑
ⓘ Cost ranges are severity-bucket heuristics (US national rule-of-thumb). Get contractor quotes + a written scope before underwriting a rehab budget.
Schools (NCES district)
- District
- N. Little Rock School District
- NCES district ID
- 0510680
- Math proficiency
- 21% ▼ -11.00%
- Reading proficiency
- 26% ▼ -9.00%
- Median HH income
- $38,325
- Composite
- 19.69/100
- National rank
- #8728
- State rank
- #191 of 238 in AR
Livability — North Little Rock
- Score
- 73/100
- State rank
- #24
- US rank
- #5452
Category grades
Schools grade is shown separately in the Schools card above.
Census & demographics
- Census place
- North Little Rock, AR
- County
- Pulaski County · 372,764 people
- City population
- 55,470
- Metro
- Little Rock-North Little Rock-Conway, AR
- Population (ZIP)
- 22,913
- Household income
- $49,559
- Rent vs Own
- Severe rent burden
- 1149.0
Population outlook (Pulaski County) Hauer SSP2
- Today (2025)
- 415,378 people
- By 2030
- 423,720 · +2.0%
- By 2040
- 435,182 · +4.8%
- By 2050
- 440,904 · +6.1%
- By 2075
- 445,521 · +7.3%
- By 2100
- 419,173 · +0.9%
Race, ethnicity, and origin ACS 2023
- Neighborhood character
- Diverse neighborhood (Simpson 0.64)
- Race & ethnicity
- Black 42% White 42% Hispanic / Latino 11% Two or more races 5%
- Hispanic origin (detail)
- Mexican 6%
- Common ancestry
- Lithuanian 2% Slovak 1% Italian 1%
- Foreign-born
- 7% · Canada
- Languages at home
- 89% English-only · Spanish 10%
Political lean MEDSL · Pulaski
- 2024 margin
- Strong D (+22.1) · D 59.8% · R 37.7% · Other 2.5%
- 2008→2024 swing
- +10.6pp toward D · 2008: 11.6pp · 2024: 22.1pp
- All cycles
- 2024: D+22.1 2020: D+22.5 2016: D+17.9 2012: D+11.4 2008: D+11.6
Not yet ingested
- Civics
- —
Market trends
- HPI YoY
- ▼ -39.32%
- Current HPI
- 180.6901
- Rent YoY
- ▲ 5.47%
- Metro
- Little Rock-North Little Rock-Conway, AR
- State GDP YoY
- ▲ 3.80%
- F500 in state
- 10
Industry mix (Fortune 500 HQ in AR)
| Industry | F500 HQs | Revenue |
|---|---|---|
| Retail | 1 | $681B |
|
||
| Food / Agriculture | 1 | $53B |
|
||
| Retail / Energy | 1 | $22B |
|
||
| Transportation / Logistics | 1 | $12B |
|
||
| Energy | 1 | $4B |
|
||
Price history
+0.0% since first listed16 events — show timeline
- 2026-04-16 Listed $1,850,000 CARMLS
- 2025-12-04 Listing Removed — CARMLS
- 2025-09-03 Listed $1,625,000 CARMLS
- 2025-08-08 Listing Removed — CARMLS
- 2025-07-16 Price Changed $1,675,000 CARMLS
- 2025-05-06 Listed $1,850,000 CARMLS
- 2024-08-31 Rental Removed $800 APPFOLIO
- 2024-08-28 Listed for Rent $800 APPFOLIO
- 2024-08-17 Rental Removed $800 APPFOLIO
- 2024-07-03 Rental Removed $800 APPFOLIO
- 2024-07-03 Listed for Rent $800 APPFOLIO
- 2024-07-03 Listed for Rent $800 APPFOLIO
- 2024-05-16 Rental Removed $775 APPFOLIO
- 2024-04-10 Listed for Rent $775 APPFOLIO
- 2024-04-10 Rental Removed $800 APPFOLIO
- 2024-01-05 Listed for Rent $800 APPFOLIO
Cash-flow waterfall
monthlySold comps — $/sqft
last 12 mo · ≤1 miLoading sold comps…