 Fourplex
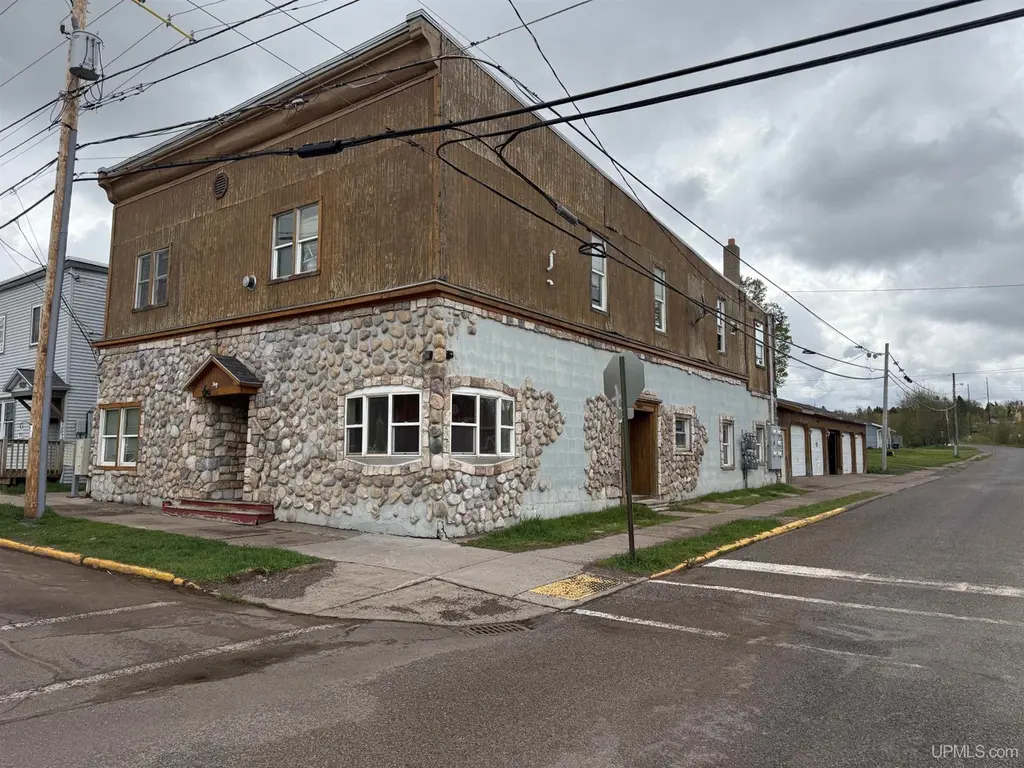
205/207 E Vaughn St · Ironwood, MI
Flood risk No data
- FEMA flood zone
- —
- Chance of flooding over 30 yrs
- —
- Est. flood insurance / yr
- —
Fire risk No data
- Est. fire insurance / yr
- —
Heat risk No data
- Hot days now (above threshold)
- —
- Hot days in 30 yrs
- —
Wind risk No data
- Chance of severe wind over 30 yrs
- —
Air-quality risk No data
- Unhealthy air days now
- —
- Unhealthy air days in 30 yrs
- —
Risk factors via First Street. Map © Google.
Why this score? — see what drove the B grade
The composite is a weighted blend of 9 inputs, each scored 0–100. Each bar is that input's sub-score; the figure is the points it added to the 100-point composite (weight × sub-score).
- Cash flow +30.0/30.0
- 1% rule +10.0/10.0
- DSCR +10.0/10.0
- ARV discount +7.5/15.0
- Appreciation +5.0/10.0
- Livability +3.5/5.0
- Schools +2.6/10.0
- Rent growth +2.5/5.0
- Condition / age +1.0/5.0
$299,000
🖨 Deal sheet 📄 Offer letter ✓ Due diligence
Multi-family units
County records classify this as Multi-Family (5+ Unit). Listing-text estimate: 4 units. estimate disagrees with records
5+ unit building — per-unit beds/baths from public records are typically unavailable; the breakdown below (if shown) is an estimate from the listing text.
Listing remarks MLS
Fantastic investment! 10 units, eight rented and two under construction to be brand new. 11 garage spaces are included. There are two buildings, one with four units and the other building has 6 units. The second building had 7 units but a conversion was done to create a three bedroom apartment. Nice Common area outside for gathering. Great Location.
Key facts
- Great location
- Two buildings
- Common area
Tags
Property features AI
Finance
- Financial info: Ten total units (multifamily); Several units occupied with listed rents (examples): $550, $750, $1,075, $600, $600
- HOA & community: Association fees cover exterior and grounds maintenance; Association/landlord pays lawn maintenance, electric, gas, snow removal, trash removal, and water/sewer
Exterior
- Parking: Attached garage plus additional garage space; Garage parking (11 spaces in garage)
- Utilities: Electricity connected; Natural gas connected; Public water at street; Public sewer at street; Separate heat for units; Separate water, electric and gas for units
- Home design: Multi-family property (1 to 4 units); Apartment/Investment style; Condo/Apt 2nd floor or above (structure style); Other style; Built in 1986
- Construction: Built in 1986; Foundation types include basement, crawl and slab
- Exterior features: Stone, wood and vinyl trim exterior; Corner lot; Large lot (65+ ft. frontage noted)
Interior
- Kitchen: Microwave; Range/Oven; Refrigerator; Freezer
- Bedrooms: At least one bedroom on the first floor
- Bathrooms: Eleven full bathrooms (total listed as 11)
- Heating & cooling: Forced air heating; Gas water heater; Electric fuel type
- Interior features: Includes a partial basement; First-floor bedroom
- Laundry & utility: Washer; Dryer
Neighborhood map
What this means for you Summary
Snapshot
- This is a 4 × 3-bed/?-bath units multifamily listed at $299k. Condition is rated poor.
Deal economics
- At list price, monthly cash flow is $2k ($21k/yr) — positive. Per door: $445/mo.
- The deal already cash-flows at list — no discount required.
- Meets the 1% rule at list price ($5k rent vs $299k).
- Cap rate 13.4% vs local median 5.8% in Ironwood — top-decile yield for the area; either an underpriced asset or a hidden risk that comps aren't pricing in. Stress-test before assuming the spread holds.
Location & tenants
- Location reads 70/100 on livability (#325 in MI) — a middle-class / working-renter tenant base. Strengths: cost of living A+, crime A, housing A; Watch: health & safety C-, schools D+, amenities F.
- Ironwood Area Schools Of Gogebic County (town): math 23% / reading 40% proficiency, ranked #361 of 540 in MI (top 67%) — families likely to look elsewhere, expect single-tenant / working-renter base with shorter leases.
- Market conditions: 1 active listings in the ZIP; 28 units permitted in Gogebic County in 2024 (0 in 5+ unit buildings).
Forward outlook
- In year one you build about $11k of equity ($2k loan paydown + $9k appreciation (3.0% local appreciation)).
- Gogebic County population projected at -24% by 2050 — secular population decline; favor cash flow + early exit over multi-decade hold.
- At projected returns (3.0% appreciation + 3.0% rent growth), your $84k cash investment doubles in ~3 years — after that, you're playing with house money.
- By year 4, paydown + projected appreciation supports a ~$37k cash-out refi (75% LTV) — recoverable capital for the next deal without selling this one.
Negotiation context
- Only 9 days on market — expect competitive offers; lowballing is unlikely to land.
- 3 sale attempts since 10y ago with the ask held roughly flat each time — persistent listings suggest the price (not the market) is what's stuck; bring a comps-based counter.
- Current owner paid $45k; list at $299k implies a 564% gain — meaningful room to come down on a strong offer.
Questions for the listing agent
- Can we see the unit-by-unit rent roll, current vacancy, and any below-market leases? What's the average tenancy length?
- What capital expenditures (roof, boiler, parking lot, exteriors) have been made in the last 5 years, and what's planned in the next 2?
- Have any recent inspections been done? Can we get a copy of the seller's disclosures and any deferred-maintenance estimates?
- Is there a deadline driving the sale (1031 exchange, divorce, estate, relocation)? That informs how much negotiation room exists.
- Schools are D-rated, which usually means shorter tenancies and higher turnover. Who's the typical renter profile here, and what's been the actual vacancy rate?
- What's the average days-on-market for RENTAL listings here right now (not sales)? A rising rental-DOM trend means longer vacancies and softer asking-rent achievability than the comps imply.
- What's the recent tenant-quality profile in this submarket — average credit score on applications, eviction rate, late-payment / NSF rate, and stable-employment percentage? A property-management company in the area should have these aggregated.
- How much new apartment / multifamily construction is in the pipeline within 1–3 miles? Heavy new supply (>2% of stock underway) typically softens rents 12–24 months out; light construction supports rent growth.
Investment metrics
- 1% rule
- 1.63% ✓
- Cap rate
- 13.43%
- Cash-on-cash
- 25.49%
- DSCR
- 2.13
- GRM
- 5.1
CMA / ARV
No comps found within radius.
Projected returns pro-forma
3.0% appreciation · 3.0% rent growth · sell at horizon
- IRR
- 31.6%
- Equity multiple
- 2.78×
- Total profit
- $149,373
- Equity at exit
- $134,443
- IRR
- 31.9%
- Equity multiple
- 5.46×
- Total profit
- $373,142
- Equity at exit
- $207,193
Cash invested: $83,720 (down + closing). Projections, not guarantees.
Landlord ↔ Tenant lean methodology
- Overall (STATE)
- 62 Landlord-Friendly
- State Michigan
- 62 Landlord-Friendly · EVEN
- County
- — inherits STATE
- City
- — inherits STATE
ZIP-level market 49993
- Active inventory
- 1
- Price-to-rent
- 20.5×
Monthly cashflow live
- Estimated rent
- $4,867 medium interval (Pro) →
- Mortgage (P&I)
- −$1,568
- Tax est. 1.5%
- −$374 /mo · $4,485/yr
- Insurance
- −$125
- HOA
- −$0
- Vacancy / Maint / Mgmt
- −$1,022
- Net cashflow
- $1,779
Break-even live
4-unit breakdown (identical units grouped — click to expand)
| Units | Beds | Baths | Est. rent |
|---|---|---|---|
| 4× units | 3 | — | $4,868 |
| #1 | 3 | — | $1,217 |
| #2 | 3 | — | $1,217 |
| #3 | 3 | — | $1,217 |
| #4 | 3 | — | $1,217 |
| Total (4 units) | $4,867 | ||
UW: 25.0% down · 7.5% · 30yr · 1.5% tax · 5.0% vac · 8.0% maint · 8.0% mgmt
Financing live
Cash to close
- Down payment
- $74,750
- Closing costs
- $8,970
- Reserves months
- —
- Total cash needed
- —
Loan-product check · same deal, 3 products live
Conventional
25% down · 7.5% · 30yr
- Down + closing
- —
- Monthly P&I
- —
- Monthly cashflow
- —
- DSCR
- —
- Eligible?
- —
Personal DTI + credit; lowest rate.
DSCR
20% down · 8.5% · 30yr
- Down + closing
- —
- Monthly P&I
- —
- Monthly cashflow
- —
- DSCR
- —
- Eligible?
- —
No personal income docs; deal must DSCR.
Hard money
10% down · 12.0% · 12mo
- Down + closing
- —
- Monthly P&I
- —
- Monthly cashflow
- —
- DSCR
- —
- Eligible?
- —
Short-term bridge; refi at stabilization.
Listing history 8 events
-
2026-06-18days on market $299,000 Active 9 DOM
-
2026-06-17days on market $299,000 Active 8 DOM
-
2026-06-16days on market $299,000 Active 7 DOM
-
2026-06-15days on market $299,000 Active 6 DOM
-
2026-06-13days on market $299,000 Active 4 DOM
-
2026-06-12days on market $299,000 Active 3 DOM
-
2026-06-09remarks 352-char remark
Show marketing remark (352 chars)
Fantastic investment! 10 units, eight rented and two under construction to be brand new. 11 garage spaces are included. There are two buildings, one with four units and the other building has 6 units. The second building had 7 units but a conversion was done to create a three bedroom apartment. Nice Common area outside for gathering. Great Location.
-
2026-06-09$299,000 Active 1 DOM
Show marketing remark (352 chars)
Fantastic investment! 10 units, eight rented and two under construction to be brand new. 11 garage spaces are included. There are two buildings, one with four units and the other building has 6 units. The second building had 7 units but a conversion was done to create a three bedroom apartment. Nice Common area outside for gathering. Great Location.
ⓘ Source: listings_history table (triggers on properties + properties_extension) + one-shot
backfill from property_details.listing_events for pre-trigger history.
Nearby sold comps map
Loading sold comps map…
Walkable amenities ~0.75 mi
Loading nearby amenities…
Taxation est. · year 1
- Rental income
- $58,404
- − Mortgage interest
- −$16,749
- − Property taxes
- −$4,485
- − Insurance
- −$1,495
- − Repairs & maintenance
- −$4,672
- − Management
- −$4,672
- − Depreciation
- −$8,698
- Taxable income
- $17,633
- Est. tax owed @ 24.0%
- −$4,232
- After-tax cash flow
- $17,111/yr
For passive investors: Depreciation is non-cash, so a rental often shows a tax loss while cash-flowing — sheltering income. Rental losses are passive: they offset passive income freely, and up to $25,000/yr can offset ordinary (W-2) income if you actively participate and your MAGI is under $100k (phasing out to $0 by $150k); unused losses carry forward. On sale, claimed depreciation is recaptured at up to 25%, and gains may owe capital-gains tax (a 1031 exchange can defer both). Figures are a year-1 estimate at your 24.0% rate — not tax advice; consult a CPA.
Condition & rehab AI · 12 photos
This multi-family property requires extensive repairs and maintenance to improve its condition and increase its resale and rental value.
Repairs flagged
- Major exterior siding — Weathered and in need of replacement
- Major interior walls — Paint chipped and dirty
- Major kitchen appliances — Scattered and need cleaning
- Major bathroom fixtures — Scattered and need cleaning
- Major landscaping — Unkempt and needs trimming
Value-add opportunities
- Both exterior siding replacement — Improves curb appeal and value
- Both interior painting — Enhances interior and rental appeal
- Both landscaping — Enhances curb appeal and rental appeal
Renovation cost estimate screening
| Repair item | Severity | Est. cost |
|---|---|---|
| exterior siding · Weathered and in need of replacement | Major | $15,000–50,000 |
| interior walls · Paint chipped and dirty | Major | $15,000–50,000 |
| kitchen appliances · Scattered and need cleaning | Major | $15,000–50,000 |
| bathroom fixtures · Scattered and need cleaning | Major | $15,000–50,000 |
| landscaping · Unkempt and needs trimming | Major | $15,000–50,000 |
| Total estimated repair cost · 5 items | $75,000–250,000 |
Value-add ROI direction
- Both exterior siding replacement — Improves curb appeal and value ↑
- Both interior painting — Enhances interior and rental appeal ↑
- Both landscaping — Enhances curb appeal and rental appeal ↑
ⓘ Cost ranges are severity-bucket heuristics (US national rule-of-thumb). Get contractor quotes + a written scope before underwriting a rehab budget.
Schools (NCES district)
- District
- Ironwood Area Schools Of Gogebic County
- NCES district ID
- 2619470
- Math proficiency
- 23% ▼ -13.00%
- Reading proficiency
- 40% ▼ -5.00%
- Median HH income
- $33,313
- Composite
- 25.78/100
- National rank
- #7369
- State rank
- #361 of 540 in MI
Livability — Ironwood
- Score
- 70/100
- State rank
- #325
- US rank
- #8024
Category grades
Schools grade is shown separately in the Schools card above.
Census & demographics
- Census place
- Ironwood, MI
Population outlook (Gogebic County) Hauer SSP2
- Today (2025)
- 13,951 people
- By 2030
- 13,191 · -5.4%
- By 2040
- 11,739 · -15.9%
- By 2050
- 10,580 · -24.2%
- By 2075
- 8,530 · -38.9%
- By 2100
- 6,903 · -50.5%
Not yet ingested
- Political lean
- —
- Race & ethnicity
- —
- Common origin
- —
- Civics
- —
Market trends
- HPI YoY
- —
- Current HPI
- —
- Rent YoY
- —
- Metro
- —
- State GDP YoY
- ▲ 1.37%
- F500 in state
- 28
Industry mix (Fortune 500 HQ in MI)
| Industry | F500 HQs | Revenue |
|---|---|---|
| Automotive Parts | 3 | $48B |
|
||
| Automotive | 2 | $372B |
|
||
| Chemicals | 1 | $45B |
|
||
| Automotive Retail | 1 | $29B |
|
||
| Healthcare / Medical Devices | 1 | $23B |
|
||
| Automotive Technology | 1 | $20B |
|
||
Price history
+360.0% since first listed4 events — show timeline
- 2026-06-09 Listed $299,000 UPAR
- 2026-06-09 Listed $299,000 MiRealSource-MiMLS
- 2017-09-21 Sold (MLS) $45,000 UPAR
- 2016-07-01 Listed $65,000 UPAR
Cash-flow waterfall
monthlySold comps — $/sqft
last 12 mo · ≤1 miLoading sold comps…