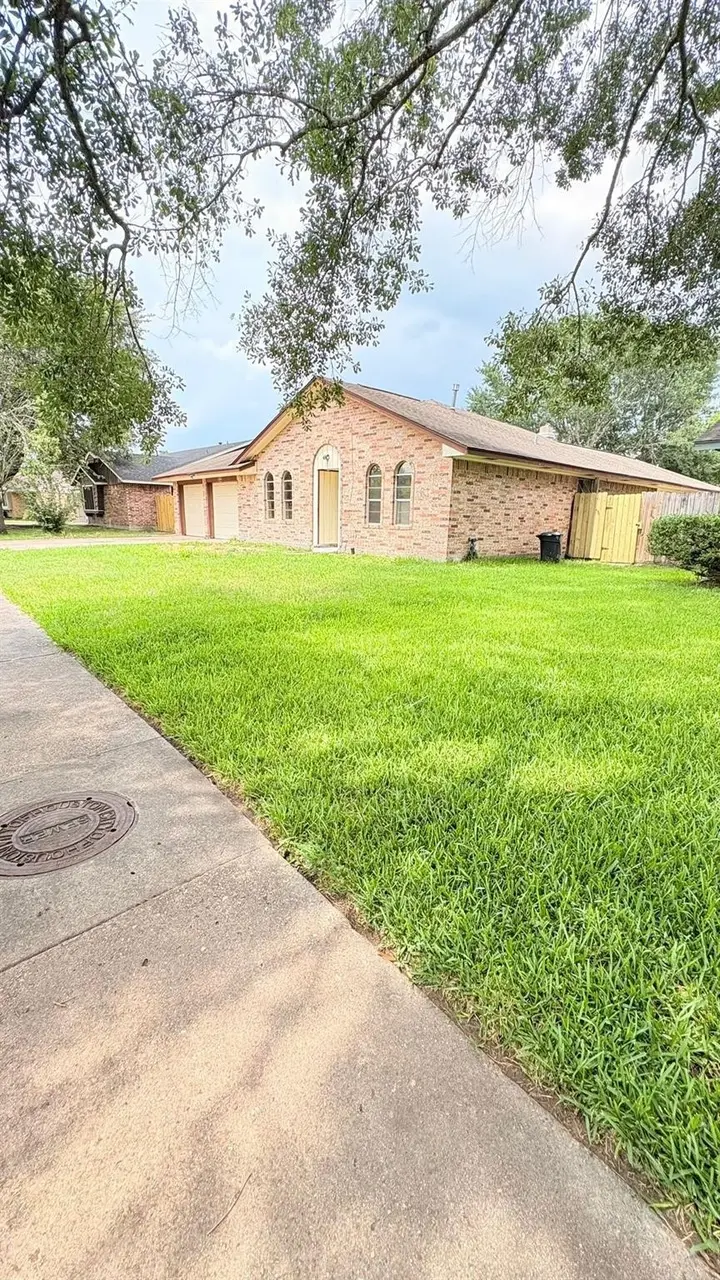
21514 Greenham Dr · Houston, TX
Flood risk 1/10 · Minimal
- FEMA flood zone
- X (unshaded)
- Chance of flooding over 30 yrs
- 0.0%
- Est. flood insurance / yr
- $507 – $1,088
Fire risk 2/10 · Minimal
- Est. fire insurance / yr
- $1,222 – $2,270
Heat risk 9/10 · Severe
- Hot days now (above 110°F)
- 7 days/yr
- Hot days in 30 yrs
- 24 days/yr
Wind risk 8/10 · Major
- Chance of severe wind over 30 yrs
- 99.0%
Air-quality risk 3/10 · Minor
- Unhealthy air days now
- 3 days/yr
- Unhealthy air days in 30 yrs
- 3 days/yr
Risk factors via First Street. Map © Google.
Why this score? — see what drove the C- grade
The composite is a weighted blend of 9 inputs, each scored 0–100. Each bar is that input's sub-score; the figure is the points it added to the 100-point composite (weight × sub-score).
- ARV discount +15.0/15.0
- Cash flow +14.4/30.0
- 1% rule +5.4/10.0
- DSCR +4.4/10.0
- Schools +4.1/10.0
- Livability +3.7/5.0
- Condition / age +2.5/5.0
- Rent growth +2.2/5.0
- Appreciation +0.0/10.0
$209,500
🖨 Deal sheet 📄 Offer letter ✓ Due diligence
Listing remarks MLS
This property is currently tenant-occupied—please do not disturb the tenants. Submit a reasonable price offer for consideration. Don't miss this well-maintained and updated home in a quiet, established neighborhood in Spring, TX. Recent upgrades include new vinyl flooring, fully renovated bathroom wall and floor tiles, a new fence, and new vinyl siding, making this a turnkey investment or future personal residence. This charming home offers great curb appeal and low-maintenance finishes, with close proximity to schools, parks, shopping centers, and major commuter routes. Excellent opportunity for investors or buyers looking for a move-in ready home with current rental income potential.
Key facts
- Turnkey investment
- Updated home
- New vinyl siding
Tags
Neighborhood map
What this means for you Summary
Snapshot
- This is a 3-bed/2.0-bath single-family listed at $210k.
Deal economics
- At list price, monthly cash flow is $41 ($495/yr) — positive.
- The deal already cash-flows at list — no discount required.
- Meets the 1% rule at list price ($2k rent vs $210k).
- Recommended offer: $184k (12.0% below list) — sets the bar for market timing.
- Cap rate 6.5% vs local median 3.2% in Houston — top-decile yield for the area; either an underpriced asset or a hidden risk that comps aren't pricing in. Stress-test before assuming the spread holds.
Location & tenants
- Location reads 74/100 on livability (#184 in TX, #4,771 nationally) — a middle-class / working-renter tenant base. Strengths: amenities A+, cost of living A+, housing A+; Watch: schools D, crime F.
- Klein ISD (suburban): math 41% / reading 48% proficiency, ranked #213 of 826 in TX (top 26%) — families likely to look elsewhere, expect single-tenant / working-renter base with shorter leases.
- Market conditions: Rents soft (-1.1%/yr); 325 active listings in the ZIP; 12 comparable units currently listed for rent nearby; rentals leasing fast (median 13d on market — plan ~1-2 weeks tenant-placement turnaround); solid renter incomes; 29,883 units permitted in Harris County in 2024 (8,621 in 5+ unit buildings).
Forward outlook
- Local home prices are declining (-3.0%/yr); year-one equity from $1k of loan paydown is wiped out by about $6k of value loss. Plan a longer hold.
- Harris County population projected at +47% by 2050 — long-run rental-demand tailwind backs the buy-and-hold thesis.
Negotiation context
- It's been on market 303 days — a 12% lower offer ($184k) is reasonable based on typical stale-listing flexibility.
- 13 sale attempts since 13y ago; this cycle's ask is 12296% above the opening price — seller raised mid-cycle; expect resistance to lowballs.
Risks & watch-outs
- Watch-outs: property tax is 2.7% of price.
- Climate carrying-cost: severe wind risk, 99% chance of damaging wind over 30y; extreme-heat days projected 7→24/yr by 2055 (HVAC capex compounding) — expect insurance premiums to compound above CPI over the hold.
Questions for the listing agent
- It's been on market 303 days. Have you received any prior offers? Is the seller open to a 12% concession, seller financing, or rate buy-down credit?
- Built in 1977 — when were the roof, HVAC, electrical panel, plumbing, and water heater last replaced?
- Property tax is high relative to price — has the assessment been appealed recently, and will the sale trigger a re-assessment?
- What does the HOA fee cover, when was the last increase, and are there any pending special assessments or reserve-fund shortfalls?
- Why hasn't it sold? Are there any deal-killer items the seller is aware of (foundation, flood, title, zoning, code violations)?
- Is there a deadline driving the sale (1031 exchange, divorce, estate, relocation)? That informs how much negotiation room exists.
- Schools are D-rated, which usually means shorter tenancies and higher turnover. Who's the typical renter profile here, and what's been the actual vacancy rate?
- Crime grade is F in this area — have there been break-ins, vandalism, or insurance claims at this property in the last 3 years? What carrier currently insures it and at what premium?
- What's the average days-on-market for RENTAL listings here right now (not sales)? A rising rental-DOM trend means longer vacancies and softer asking-rent achievability than the comps imply.
- What's the recent tenant-quality profile in this submarket — average credit score on applications, eviction rate, late-payment / NSF rate, and stable-employment percentage? A property-management company in the area should have these aggregated.
- How much new for-sale + rental construction is in the pipeline within 1–3 miles? Heavy new supply typically softens prices + rents 12–24 months out; constrained supply supports both.
Investment metrics
- 1% rule
- 1.04% ✓
- Cap rate
- 6.53%
- Cash-on-cash
- 0.84%
- DSCR
- 1.04
- GRM
- 8.0
CMA / ARV
- ARV (median comp)
- $251,298
- List price
- $209,500
- Delta
- -16.63%
- Verdict
- UNDERPRICED
- Comps
- 20 within 1.0 mi
Show comp detail 12 sales within ~0.75 mi
| Address | Dist | Beds/Ba | Sqft | Sold | Price | $/sf | Match |
|---|---|---|---|---|---|---|---|
| 21514 Greenham Dr | 0.00mi | 3/2.0 | 2,070 (0%) | 0mo | $209,500 | $101 | 100 |
| 3310 Keygate Dr | 0.32mi | 4/2.0 (+1) | 2,181 (+5%) | 1mo | $264,900 | $121 | 71 |
| 21807 Greengate Dr | 0.30mi | 3/2.0 | 1,882 (-9%) | 1mo | $368,900 | $196 | 70 |
| 21626 Long Castle Dr | 0.34mi | 4/3.5 (+1) | 2,094 (+1%) | 3mo | $319,500 | $153 | 69 |
| 21330 Greenham Dr | 0.14mi | 4/2.0 (+1) | 1,782 (-14%) | 2mo | $309,900 | $174 | 64 |
| 2423 Daneswood Ct | 0.54mi | 4/2.0 (+1) | 2,140 (+3%) | 2mo | $295,000 | $138 | 63 |
| 21907 Hannover Ridge Dr | 0.64mi | 3/2.0 | 2,164 (+4%) | 0mo | $286,900 | $133 | 62 |
| 21823 Hannover Village Dr | 0.48mi | 4/2.0 (+1) | 2,199 (+6%) | 2mo | $324,500 | $148 | 61 |
| 21411 Delridge Dr | 0.55mi | 3/2.0 | 1,874 (-10%) | 1mo | $295,000 | $157 | 58 |
| 2314 Hannover Way | 0.63mi | 4/2.0 (+1) | 2,156 (+4%) | 2mo | $294,900 | $137 | 57 |
| 3411 La Mer Ln | 0.62mi | 4/2.5 (+1) | 2,292 (+11%) | 1mo | $285,000 | $124 | 46 |
| 21611 Falvel Misty Dr | 0.75mi | 4/2.5 (+1) | 1,920 (-7%) | 2mo | $269,000 | $140 | 45 |
Match score weights: distance 35% · size 25% · config 20% · recency 20%. Top-matched comps best support the ARV.
Projected returns pro-forma
-3.0% appreciation · 0.0% rent growth · sell at horizon
- IRR
- -18.8%
- Equity multiple
- 0.36×
- Total profit
- $-37,523
- Equity at exit
- $31,237
- IRR
- -20.6%
- Equity multiple
- 0.09×
- Total profit
- $-53,230
- Equity at exit
- $18,114
Cash invested: $58,660 (down + closing). Projections, not guarantees.
Landlord ↔ Tenant lean methodology
- Overall (STATE)
- 87 Strongly Landlord-Friendly
- State Texas
- 87 Strongly Landlord-Friendly · R+5
- County
- — inherits STATE
- City
- — inherits STATE
ZIP-level market 77388
- Home prices YoY
- -34.8%
- Rents YoY
- -1.1%
- Active inventory
- 325
- Price-to-rent
- 8.0×
Monthly cashflow live
- Estimated rent
- $2,176 high interval (Pro) →
- Mortgage (P&I)
- −$1,099
- Tax from tax record
- −$465 /mo · $5,582/yr
- Insurance
- −$87
- HOA
- −$27
- Vacancy / Maint / Mgmt
- −$457
- Net cashflow
- $41
Break-even live
UW: 25.0% down · 7.5% · 30yr · 1.5% tax · 5.0% vac · 8.0% maint · 8.0% mgmt
Financing live
Cash to close
- Down payment
- $52,375
- Closing costs
- $6,285
- Reserves months
- —
- Total cash needed
- —
Loan-product check · same deal, 3 products live
Conventional
25% down · 7.5% · 30yr
- Down + closing
- —
- Monthly P&I
- —
- Monthly cashflow
- —
- DSCR
- —
- Eligible?
- —
Personal DTI + credit; lowest rate.
DSCR
20% down · 8.5% · 30yr
- Down + closing
- —
- Monthly P&I
- —
- Monthly cashflow
- —
- DSCR
- —
- Eligible?
- —
No personal income docs; deal must DSCR.
Hard money
10% down · 12.0% · 12mo
- Down + closing
- —
- Monthly P&I
- —
- Monthly cashflow
- —
- DSCR
- —
- Eligible?
- —
Short-term bridge; refi at stabilization.
Rent comps 12 comps
| Address | Beds | Baths | Sqft | Rent | $/sqft | DOM | Units | Dist |
|---|---|---|---|---|---|---|---|---|
| 21400 Big Spring Valley Ave Spring, TX | 1.0–3.0 | 1.0–2.5 | 1074 | $2,370 | $2.21 | 2d | 67 | 0.39mi |
| 3402 Almondwood Dr Spring, TX | 3.0 | 2.0 | 1414 | $1,795 | $1.27 | 13d | 1 | 0.66mi |
| 21771 Mossy Field Ln Spring, TX | 3.0 | 3.0 | 1631 | $2,150 | $1.32 | 44d | 1 | 0.82mi |
| 4018 Falvel Shadow Creek Dr Spring, TX | 4.0 | 2.0 | 1458 | $1,960 | $1.34 | 11d | 1 | 0.86mi |
| 3880 Farm to Market 2920 Spring, TX | 1.0–3.0 | 1.0–2.0 | 1037 | $2,536 | $2.45 | 2d | 29 | 0.87mi |
| 2539 Spring Cypress Rd Spring, TX | 1.0–3.0 | 1.0–3.0 | 1086 | $2,214 | $2.04 | 2d | 20 | 0.95mi |
| 3123 Spring Ranch Ln Spring, TX | 3.0 | 2.0 | 1619 | $1,819 | $1.12 | 44d | 1 | 1.01mi |
| 4209 Spring Stuebner Rd Unit 3228 Spring, TX | 3.0 | 2.0 | 1584 | $2,178 | $1.38 | 3d | 1 | 1.04mi |
| 4209 Spring Stuebner Rd Unit 4242 Spring, TX | 3.0 | 2.0 | 1584 | $2,210 | $1.40 | 11d | 1 | 1.04mi |
| 4310 Stallion Brook Ln Spring, TX | 4.0 | 2.0 | 2096 | $2,175 | $1.04 | 21d | 1 | 1.36mi |
| 4614 Bridgestone Path Dr Spring, TX | 4.0 | 2.5 | 2450 | $2,325 | $0.95 | 17d | 1 | 1.41mi |
| 22418 Bridgestone Ridge Dr Spring, TX | 4.0 | 3.5 | 2932 | $2,695 | $0.92 | 24d | 1 | 1.47mi |
HOA detail
- Monthly dues
- $27 · $324/yr
Listing history 40 events
-
2026-05-20status Pending 700-char remark
Show marketing remark (700 chars)
This property is currently tenant-occupied—please do not disturb the tenants. Submit a reasonable price offer for consideration. Don't miss this well-maintained and updated home in a quiet, established neighborhood in Spring, TX. Recent upgrades include new vinyl flooring, fully renovated bathroom wall and floor tiles, a new fence, and new vinyl siding, making this a turnkey investment or future personal residence. This charming home offers great curb appeal and low-maintenance finishes, with close proximity to schools, parks, shopping centers, and major commuter routes. Excellent opportunity for investors or buyers looking for a move-in ready home with current rental income potential.
-
2026-05-14status Pending 700-char remark
Show marketing remark (700 chars)
This property is currently tenant-occupied—please do not disturb the tenants. Submit a reasonable price offer for consideration. Don't miss this well-maintained and updated home in a quiet, established neighborhood in Spring, TX. Recent upgrades include new vinyl flooring, fully renovated bathroom wall and floor tiles, a new fence, and new vinyl siding, making this a turnkey investment or future personal residence. This charming home offers great curb appeal and low-maintenance finishes, with close proximity to schools, parks, shopping centers, and major commuter routes. Excellent opportunity for investors or buyers looking for a move-in ready home with current rental income potential.
-
2026-01-23price $209,500 700-char remark
Show marketing remark (700 chars)
This property is currently tenant-occupied—please do not disturb the tenants. Submit a reasonable price offer for consideration. Don't miss this well-maintained and updated home in a quiet, established neighborhood in Spring, TX. Recent upgrades include new vinyl flooring, fully renovated bathroom wall and floor tiles, a new fence, and new vinyl siding, making this a turnkey investment or future personal residence. This charming home offers great curb appeal and low-maintenance finishes, with close proximity to schools, parks, shopping centers, and major commuter routes. Excellent opportunity for investors or buyers looking for a move-in ready home with current rental income potential.
-
2025-12-26historical $1,690
-
2025-12-19$1,690
-
2025-11-07price $218,000 700-char remark
Show marketing remark (700 chars)
This property is currently tenant-occupied—please do not disturb the tenants. Submit a reasonable price offer for consideration. Don't miss this well-maintained and updated home in a quiet, established neighborhood in Spring, TX. Recent upgrades include new vinyl flooring, fully renovated bathroom wall and floor tiles, a new fence, and new vinyl siding, making this a turnkey investment or future personal residence. This charming home offers great curb appeal and low-maintenance finishes, with close proximity to schools, parks, shopping centers, and major commuter routes. Excellent opportunity for investors or buyers looking for a move-in ready home with current rental income potential.
-
2025-10-09historical $1,690
-
2025-09-23$1,690
-
2025-07-21$238,000 Active 700-char remark
Show marketing remark (700 chars)
This property is currently tenant-occupied—please do not disturb the tenants. Submit a reasonable price offer for consideration. Don't miss this well-maintained and updated home in a quiet, established neighborhood in Spring, TX. Recent upgrades include new vinyl flooring, fully renovated bathroom wall and floor tiles, a new fence, and new vinyl siding, making this a turnkey investment or future personal residence. This charming home offers great curb appeal and low-maintenance finishes, with close proximity to schools, parks, shopping centers, and major commuter routes. Excellent opportunity for investors or buyers looking for a move-in ready home with current rental income potential.
-
2025-07-18historical
-
2025-06-05$239,000 Active
-
2021-12-10status Pending
-
2021-12-09historical
-
2021-12-03$248,000 Active
-
2020-01-03historical
-
2019-12-25$189,000 Active
-
2014-09-06historical
-
2014-09-02status Active
-
2014-09-02historical
-
2014-06-06price $134,000
-
2014-05-29$139,000 Active
-
2014-04-17historical
-
2014-04-17status Active
-
2014-04-17historical
-
2014-04-17price $139,000
-
2014-04-10price $144,400
-
2014-02-24price $144,900
-
2014-02-18price $146,970
-
2014-02-14$155,980 Active
-
2013-11-11historical
-
2013-11-07soldstatus Sold
-
2013-11-04status Pending
-
2013-10-01status Pending, Continue to Show
-
2013-09-26status Active
-
2013-09-23status Pending, Continue to Show
-
2013-08-31status Active
-
2013-08-10status Pending
-
2013-08-09status Pending, Continue to Show
-
2013-07-25$97,000 Active
-
2000-11-17soldstatus
ⓘ Source: listings_history table (triggers on properties + properties_extension) + one-shot
backfill from property_details.listing_events for pre-trigger history.
Tax reassessment forecast TX · Resets to sale price
- Current annual tax
- $5,582 · $465/mo
- Projected year-2 tax
- $5,582 · $465/mo
- Expected delta
- $0/yr ($0/mo · 0.0%)
ⓘ Screening estimate from a state-policy table — verify with the county assessor before closing.
Climate risk First Street
- Flood 1/10 Low FEMA zone X (unshaded) · 0% chance over 30 yrs
- Wildfire 2/10 Low
- Heat 9/10 Extreme 7 d/yr ≥110°F today · 24 d/yr by 30 yrs out
- Wind 8/10 Severe 99% chance of damaging wind over 30 yrs
- Air quality 3/10 Moderate 3 unhealthy d/yr today · 3 by 30 yrs out
Nearby sold comps map
Loading sold comps map…
Walkable amenities ~0.75 mi
Loading nearby amenities…
Taxation est. · year 1
- Rental income
- $26,117
- − Mortgage interest
- −$11,735
- − Property taxes
- −$5,582
- − Insurance
- −$1,048
- − Repairs & maintenance
- −$2,089
- − Management
- −$2,089
- − HOA
- −$324
- − Depreciation
- −$6,095
- Taxable loss
- −$2,845
- Est. tax savings @ 24.0%
- +$683
- After-tax cash flow
- $1,178/yr
For passive investors: Depreciation is non-cash, so a rental often shows a tax loss while cash-flowing — sheltering income. Rental losses are passive: they offset passive income freely, and up to $25,000/yr can offset ordinary (W-2) income if you actively participate and your MAGI is under $100k (phasing out to $0 by $150k); unused losses carry forward. On sale, claimed depreciation is recaptured at up to 25%, and gains may owe capital-gains tax (a 1031 exchange can defer both). Figures are a year-1 estimate at your 24.0% rate — not tax advice; consult a CPA.
Schools (NCES district)
- District
- Klein ISD
- NCES district ID
- 4825740
- Math proficiency
- 41% ▼ -12.00%
- Reading proficiency
- 48% ▼ -3.00%
- Median HH income
- $78,288
- Composite
- 40.91/100
- National rank
- #3615
- State rank
- #213 of 826 in TX
Livability — Houston
- Score
- 74/100
- State rank
- #184
- US rank
- #4771
Category grades
Schools grade is shown separately in the Schools card above.
Census & demographics
- County
- Harris County · 4,702,590 people
- City population
- 3,226,434
- Metro
- Houston-The Woodlands-Sugar Land, TX
- Population (ZIP)
- 53,425
- Household income
- $102,323
- Rent vs Own
- Severe rent burden
- 1419.0
Population outlook (Harris County) Hauer SSP2
- Today (2025)
- 5,571,493 people
- By 2030
- 6,089,821 · +9.3%
- By 2040
- 7,142,806 · +28.2%
- By 2050
- 8,185,864 · +46.9%
- By 2075
- 10,574,329 · +89.8%
- By 2100
- 12,109,958 · +117.4%
Race, ethnicity, and origin ACS 2023
- Neighborhood character
- Diverse neighborhood (Simpson 0.70)
- Race & ethnicity
- White 45% Hispanic / Latino 25% Black 18% Two or more races 12% Asian 8%
- Hispanic origin (detail)
- Mexican 15%
- Common ancestry
- Slovak 2% Lithuanian 2% Romanian 1%
- Foreign-born
- 15% · Canada, Vietnam, China
- Languages at home
- 74% English-only · Spanish 18% Other Indo-European 2% Other Asian/Pacific 1%
Political lean MEDSL · Harris
- 2024 margin
- Lean D (+5.5) · D 52.0% · R 46.4% · Other 1.6%
- 2008→2024 swing
- +3.9pp toward D · 2008: 1.6pp · 2024: 5.5pp
- All cycles
- 2024: D+5.5 2020: D+13.3 2016: D+12.4 2012: D+0.1 2008: D+1.6
Not yet ingested
- Civics
- —
Market trends
- HPI YoY
- ▼ -121.68%
- Current HPI
- 228.128
- Rent YoY
- ▼ -1.08%
- Metro
- Houston-The Woodlands-Sugar Land, TX
- State GDP YoY
- ▲ 3.95%
- F500 in state
- 110
Industry mix (Fortune 500 HQ in TX)
| Industry | F500 HQs | Revenue |
|---|---|---|
| Energy | 16 | $1,198B |
|
||
| Technology | 5 | $198B |
|
||
| Engineering / Construction | 4 | $72B |
|
||
| Energy Services | 3 | $60B |
|
||
| Utilities | 3 | $41B |
|
||
| Healthcare | 2 | $330B |
|
||
Price history
+116.0% since first listed40 events — show timeline
- 2026-05-20 Pending — HARMLS
- 2026-05-14 Pending — HARMLS
- 2026-01-23 Price Changed $209,500 HARMLS
- 2025-12-26 Rental Removed $1,690 Avail
- 2025-12-19 Listed for Rent $1,690 Avail
- 2025-11-07 Price Changed $218,000 HARMLS
- 2025-10-09 Rental Removed $1,690 Avail
- 2025-09-23 Listed for Rent $1,690 Avail
- 2025-07-21 Listed $238,000 HARMLS
- 2025-07-18 Listing Removed — HARMLS
- 2025-06-05 Listed $239,000 HARMLS
- 2021-12-10 Pending — HARMLS
- 2021-12-09 Listing Removed — HARMLS
- 2021-12-03 Listed $248,000 HARMLS
- 2020-01-03 Listing Removed — HARMLS
- 2019-12-25 Listed $189,000 HARMLS
- 2014-09-06 Listing Removed — HARMLS
- 2014-09-02 Relisted — HARMLS
- 2014-09-02 Listing Removed — HARMLS
- 2014-06-06 Price Changed $134,000 HARMLS
- 2014-05-29 Listed $139,000 HARMLS
- 2014-04-17 Listing Removed — HARMLS
- 2014-04-17 Relisted — HARMLS
- 2014-04-17 Listing Removed — HARMLS
- 2014-04-17 Price Changed $139,000 HARMLS
- 2014-04-10 Price Changed $144,400 HARMLS
- 2014-02-24 Price Changed $144,900 HARMLS
- 2014-02-18 Price Changed $146,970 HARMLS
- 2014-02-14 Listed $155,980 HARMLS
- 2013-11-11 Listing Removed — HARMLS
- 2013-11-07 Sold (MLS) — HARMLS
- 2013-11-04 Pending — HARMLS
- 2013-10-01 Pending — HARMLS
- 2013-09-26 Relisted — HARMLS
- 2013-09-23 Pending — HARMLS
- 2013-08-31 Relisted — HARMLS
- 2013-08-10 Pending — HARMLS
- 2013-08-09 Pending — HARMLS
- 2013-07-25 Listed $97,000 HARMLS
- 2000-11-17 Sold (Public Records) — Public Records
Property tax history
+5.6%/yrLatest (2025): $5,582 · -7.1% YoY. Source: county tax records.
Cash-flow waterfall
monthlySold comps — $/sqft
last 12 mo · ≤1 miLoading sold comps…