 Duplex
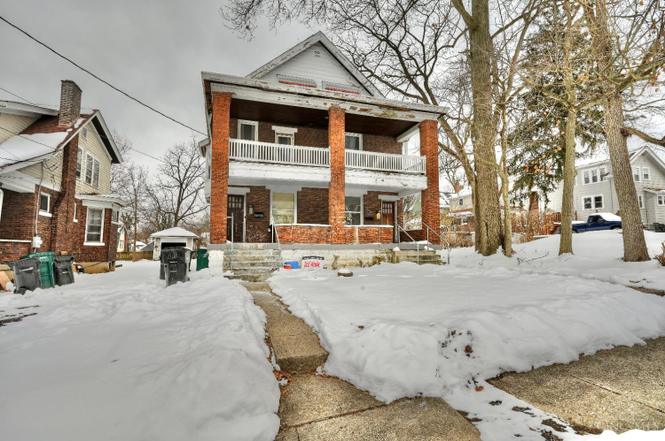
3460 Bevis Ave · Cincinnati, OH
Flood risk 1/10 · Minimal
- FEMA flood zone
- X (unshaded)
- Chance of flooding over 30 yrs
- 0.0%
- Est. flood insurance / yr
- $473 – $860
Fire risk 1/10 · Minimal
- Est. fire insurance / yr
- $713 – $1,323
Heat risk 5/10 · Moderate
- Hot days now (above 103°F)
- 7 days/yr
- Hot days in 30 yrs
- 19 days/yr
Wind risk 2/10 · Minimal
- Chance of severe wind over 30 yrs
- 1.0%
Air-quality risk 3/10 · Minor
- Unhealthy air days now
- 2 days/yr
- Unhealthy air days in 30 yrs
- 3 days/yr
Risk factors via First Street. Map © Google.
Why this score? — see what drove the B grade
The composite is a weighted blend of 9 inputs, each scored 0–100. Each bar is that input's sub-score; the figure is the points it added to the 100-point composite (weight × sub-score).
- Cash flow +28.8/30.0
- ARV discount +15.0/15.0
- DSCR +10.0/10.0
- 1% rule +7.7/10.0
- Livability +4.0/5.0
- Rent growth +2.5/5.0
- Schools +2.5/10.0
- Condition / age +2.5/5.0
- Appreciation +0.0/10.0
$280,000
🖨 Deal sheet 📄 Offer letter ✓ Due diligence
Multi-family units
County records classify this as Multi-Family (2-4 Unit). Listing-text estimate: 2 units. confirmed
Listing remarks MLS
Fannie Mae owned, all buyer's must be pre-approved in writing.
Key facts
- 2 garage spots
- Built 1917
- Listed 128 days
Property features AI
Finance
- Other: Owner pays water; tenants pay heat
- Financial info: Property configured as a 2-unit building; Unit 1 rent listed at $1,500; Unit 2 rent listed at $1,500
- HOA & community: No HOA information provided
Exterior
- Parking: Attached or detached garage with 2 garage spaces; 2 open parking spaces; Driveway
- Security: No security features provided
- Utilities: Public water; Public sewer; Natural gas
- Home design: Duplex; Three or more levels; Zoned for multi-family
- Construction: Brick construction; Shingle roof; Poured foundation; Built on multiple levels (Three+)
- Exterior features: Front porch; Two inoperable fireplaces noted on the property
Interior
- Kitchen: No specific kitchen appliance details provided
- Bedrooms: One 2-bedroom unit; One 3-bedroom unit
- Flooring: No flooring details provided
- Bathrooms: Each unit has one full bathroom
- Heating & cooling: Gas heating; Window air conditioning units; Separate furnace for units; Separate A/C for units; Separate gas and electric meters
- Interior features: Full basement; Inoperable fireplaces (2)
- Laundry & utility: No laundry details provided
Neighborhood map
What this means for you Summary
Snapshot
- This is a 2 × 2-bed/1.0-bath units multifamily listed at $280k.
Deal economics
- At list price, monthly cash flow is $940 ($11k/yr) — positive. Per door: $470/mo.
- The deal already cash-flows at list — no discount required.
- Meets the 1% rule at list price ($4k rent vs $280k).
- Recommended offer: $246k (12.0% below list) — sets the bar for market timing.
- Cap rate 10.3% vs local median 3.9% in Cincinnati — top-decile yield for the area; either an underpriced asset or a hidden risk that comps aren't pricing in. Stress-test before assuming the spread holds.
Location & tenants
- Location reads 80/100 on livability (#130 in OH, #1,856 nationally) — a professional / high-income tenant draw. Strengths: amenities A+, commute A+, cost of living A+; Watch: employment D, crime F.
- Cincinnati Public Schools (urban): math 25% / reading 36% proficiency, ranked #581 of 656 in OH (top 89%) — families likely to look elsewhere, expect single-tenant / working-renter base with shorter leases; 70% free/reduced lunch — lower-income household profile, screen leases tightly.
- Market conditions: 51 active listings in the ZIP; 3 comparable units currently listed for rent nearby; rentals lingering (median 44d on market — plan ~5-8 weeks vacancy on turnover, expect pricing pressure); 67% of comp listings sitting > 30 days — soft ceiling on asking rent; 801 units permitted in Hamilton County in 2024 (190 in 5+ unit buildings).
- At $3,559/mo this rent would consume 86% of the median local household income ($50k/yr) (locally 422% of renters already pay >50% of income on rent) — very limited rent-growth headroom before tenants either downsize or default.
Forward outlook
- Local home prices are declining (-3.0%/yr); year-one equity from $2k of loan paydown is wiped out by about $8k of value loss. Plan a longer hold.
- At projected returns (-3.0% appreciation + 3.0% rent growth), your $78k cash investment doubles in ~9 years — after that, you're playing with house money.
Negotiation context
- It's been on market 128 days — a 12% lower offer ($246k) is reasonable based on typical stale-listing flexibility.
- 3 sale attempts since 27y ago with the ask held roughly flat each time — persistent listings suggest the price (not the market) is what's stuck; bring a comps-based counter.
- Current owner paid $60k; list at $280k implies a 366% gain — meaningful room to come down on a strong offer.
Risks & watch-outs
- Watch-outs: built in 1917 — expect roof / HVAC / electrical / plumbing capex.
- Climate carrying-cost: extreme-heat days projected 7→19/yr by 2055 (HVAC capex compounding) — expect insurance premiums to compound above CPI over the hold.
Questions for the listing agent
- It's been on market 128 days. Have you received any prior offers? Is the seller open to a 12% concession, seller financing, or rate buy-down credit?
- Can we see the unit-by-unit rent roll, current vacancy, and any below-market leases? What's the average tenancy length?
- What capital expenditures (roof, boiler, parking lot, exteriors) have been made in the last 5 years, and what's planned in the next 2?
- Built in 1917 — when were the roof, HVAC, electrical panel, plumbing, and water heater last replaced?
- Why hasn't it sold? Are there any deal-killer items the seller is aware of (foundation, flood, title, zoning, code violations)?
- Is there a deadline driving the sale (1031 exchange, divorce, estate, relocation)? That informs how much negotiation room exists.
- Schools are B-rated — typically a magnet for longer-tenancy family renters. What's the average tenant stay here, and is there a school-zone premium baked into asking?
- Crime grade is F in this area — have there been break-ins, vandalism, or insurance claims at this property in the last 3 years? What carrier currently insures it and at what premium?
- What's the average days-on-market for RENTAL listings here right now (not sales)? A rising rental-DOM trend means longer vacancies and softer asking-rent achievability than the comps imply.
- What's the recent tenant-quality profile in this submarket — average credit score on applications, eviction rate, late-payment / NSF rate, and stable-employment percentage? A property-management company in the area should have these aggregated.
- How much new apartment / multifamily construction is in the pipeline within 1–3 miles? Heavy new supply (>2% of stock underway) typically softens rents 12–24 months out; light construction supports rent growth.
Investment metrics
- 1% rule
- 1.27% ✓
- Cap rate
- 10.32%
- Cash-on-cash
- 14.39%
- DSCR
- 1.64
- GRM
- 6.6
CMA / ARV
- ARV (on-the-fly)
- $348,000
- Comps found
- 11
Show comp detail 11 sales within ~0.75 mi
| Address | Dist | Beds/Ba | Sqft | Sold | Price | $/sf | Match |
|---|---|---|---|---|---|---|---|
| 1820 Kinney Ave | 0.44mi | 5/2.0 | 2,924 (-2%) | 5mo | $175,000 | $60 | 67 |
| 3553 Bevis Ave | 0.20mi | 5/3.0 | 2,739 (-9%) | 16mo | $235,000 | $86 | 63 |
| 3610 Bevis Ave | 0.27mi | 6/3.0 (+1) | 3,338 (+11%) | 4mo | $225,000 | $67 | 60 |
| 1949 Hudson Ave | 0.59mi | 5/3.5 | 2,820 (-6%) | 4mo | $429,000 | $152 | 57 |
| 1929 Kinney Ave | 0.37mi | 5/3.0 | 2,644 (-12%) | 13mo | $316,250 | $120 | 52 |
| 1927 Kinney Ave | 0.37mi | 5/4.0 | 2,644 (-12%) | 13mo | $316,250 | $120 | 48 |
| 1874 Fairfax Ave | 0.42mi | 4/3.0 (-1) | 2,577 (-14%) | 4mo | $293,000 | $114 | 48 |
| 1854 Kinney Ave | 0.38mi | 4/— (-1) | 2,700 (-10%) | 18mo | $445,000 | $165 | 46 |
| 1535 Blair Ave | 0.65mi | 4/3.0 (-1) | 2,772 (-8%) | 10mo | $322,000 | $116 | 44 |
| 1930 Hudson Ave | 0.61mi | 4/3.0 (-1) | 2,590 (-14%) | 2mo | $370,000 | $143 | 42 |
| 3923 Spencer Ave | 0.72mi | 5/2.0 | 2,567 (-14%) | 6mo | $287,000 | $112 | 33 |
Match score weights: distance 35% · size 25% · config 20% · recency 20%. Top-matched comps best support the ARV.
Projected returns pro-forma
-3.0% appreciation · 3.0% rent growth · sell at horizon
- IRR
- 4.8%
- Equity multiple
- 1.19×
- Total profit
- $14,533
- Equity at exit
- $41,749
- IRR
- 14.2%
- Equity multiple
- 2.15×
- Total profit
- $89,833
- Equity at exit
- $24,209
Cash invested: $78,400 (down + closing). Projections, not guarantees.
Landlord ↔ Tenant lean methodology
- Overall (STATE)
- 73 Landlord-Friendly
- State Ohio
- 73 Landlord-Friendly · R+6
- County
- — inherits STATE
- City
- — inherits STATE
ZIP-level market 45207
- Home prices YoY
- -34.6%
- Active inventory
- 51
- Price-to-rent
- 13.1×
Monthly cashflow live
- Estimated rent
- $3,559 high interval (Pro) →
- Mortgage (P&I)
- −$1,468
- Tax from tax record
- −$286 /mo · $3,435/yr
- Insurance
- −$117
- HOA
- −$0
- Vacancy / Maint / Mgmt
- −$747
- Net cashflow
- $940
Break-even live
2-unit breakdown (identical units grouped — click to expand)
| Units | Beds | Baths | Est. rent |
|---|---|---|---|
| 2× units | 2 | 1 | $3,560 |
| #1 | 2 | 1 | $1,780 |
| #2 | 2 | 1 | $1,780 |
| Total (2 units) | $3,559 | ||
UW: 25.0% down · 7.5% · 30yr · 1.5% tax · 5.0% vac · 8.0% maint · 8.0% mgmt
Financing live
Cash to close
- Down payment
- $70,000
- Closing costs
- $8,400
- Reserves months
- —
- Total cash needed
- —
Loan-product check · same deal, 3 products live
Conventional
25% down · 7.5% · 30yr
- Down + closing
- —
- Monthly P&I
- —
- Monthly cashflow
- —
- DSCR
- —
- Eligible?
- —
Personal DTI + credit; lowest rate.
DSCR
20% down · 8.5% · 30yr
- Down + closing
- —
- Monthly P&I
- —
- Monthly cashflow
- —
- DSCR
- —
- Eligible?
- —
No personal income docs; deal must DSCR.
Hard money
10% down · 12.0% · 12mo
- Down + closing
- —
- Monthly P&I
- —
- Monthly cashflow
- —
- DSCR
- —
- Eligible?
- —
Short-term bridge; refi at stabilization.
Rent comps 3 comps
| Address | Beds | Baths | Sqft | Rent | $/sqft | DOM | Units | Dist |
|---|---|---|---|---|---|---|---|---|
| 1718 Dexter Ave Cincinnati, OH | 4.0 | 2.0 | 2539 | $2,100 | $0.83 | 23d | 1 | 0.66mi |
| 1768 Williams Ave Cincinnati, OH | 6.0 | 3.0 | 2594 | $3,000 | $1.16 | 44d | 1 | 0.84mi |
| 2123 Cameron Ave Cincinnati, OH | 4.0 | 2.5 | 2165 | $4,500 | $2.08 | 43d | 1 | 0.97mi |
Listing history 21 events
-
2026-06-18days on market $280,000 Active 128 DOM
-
2026-06-17days on market $280,000 Active 127 DOM
-
2026-06-16days on market $280,000 Active 126 DOM
-
2026-06-15days on market $280,000 Active 125 DOM
-
2026-06-13days on market $280,000 Active 123 DOM
-
2026-06-13days on market $280,000 Active 122 DOM
-
2026-06-09days on market $280,000 Active 119 DOM
-
2026-06-08days on market $280,000 Active 118 DOM
-
2026-06-07days on market $280,000 Active 117 DOM
-
2026-06-03days on market $280,000 Active 113 DOM
-
2026-06-02days on market $280,000 Active 112 DOM
-
2026-06-01days on market $280,000 Active 111 DOM
-
2026-05-31days on market $280,000 Active 110 DOM
-
2026-02-10$280,000 Active
-
2011-02-22soldstatus $60,100
-
2010-09-08soldstatus $20,000
-
2008-12-03soldstatus $36,000
-
2005-06-30soldstatus $35,000 62-char remark
Show marketing remark (62 chars)
Fannie Mae owned, all buyer's must be pre-approved in writing.
-
2005-03-08$35,000 62-char remark
Show marketing remark (62 chars)
Fannie Mae owned, all buyer's must be pre-approved in writing.
-
2000-01-21historical
-
1999-12-20$85,000
ⓘ Source: listings_history table (triggers on properties + properties_extension) + one-shot
backfill from property_details.listing_events for pre-trigger history.
Tax reassessment forecast OH · Partial reset (capped growth)
- Current annual tax
- $3,435 · $286/mo
- Projected year-2 tax
- $3,902 · $325/mo
- Expected delta
- +$466/yr (+$39/mo · 13.6%)
ⓘ Screening estimate from a state-policy table — verify with the county assessor before closing.
Climate risk First Street
- Flood 1/10 Low FEMA zone X (unshaded) · 0% chance over 30 yrs
- Wildfire 1/10 Low
- Heat 5/10 Major 7 d/yr ≥103°F today · 19 d/yr by 30 yrs out
- Wind 2/10 Low 100% chance of damaging wind over 30 yrs
- Air quality 3/10 Moderate 2 unhealthy d/yr today · 3 by 30 yrs out
Nearby sold comps map
Loading sold comps map…
Walkable amenities ~0.75 mi
Loading nearby amenities…
Taxation est. · year 1
- Rental income
- $42,708
- − Mortgage interest
- −$15,684
- − Property taxes
- −$3,435
- − Insurance
- −$1,400
- − Repairs & maintenance
- −$3,417
- − Management
- −$3,417
- − Depreciation
- −$8,145
- Taxable income
- $7,210
- Est. tax owed @ 24.0%
- −$1,730
- After-tax cash flow
- $9,554/yr
For passive investors: Depreciation is non-cash, so a rental often shows a tax loss while cash-flowing — sheltering income. Rental losses are passive: they offset passive income freely, and up to $25,000/yr can offset ordinary (W-2) income if you actively participate and your MAGI is under $100k (phasing out to $0 by $150k); unused losses carry forward. On sale, claimed depreciation is recaptured at up to 25%, and gains may owe capital-gains tax (a 1031 exchange can defer both). Figures are a year-1 estimate at your 24.0% rate — not tax advice; consult a CPA.
Schools (NCES district)
- District
- Cincinnati Public Schools
- NCES district ID
- 3904375
- Math proficiency
- 25% ▼ -19.00%
- Reading proficiency
- 36% ▼ -14.00%
- Median HH income
- $35,743
- Composite
- 25.21/100
- National rank
- #7508
- State rank
- #581 of 656 in OH
Livability — Cincinnati
- Score
- 80/100
- State rank
- #130
- US rank
- #1856
Category grades
Schools grade is shown separately in the Schools card above.
Census & demographics
- Census place
- Cincinnati, OH
- County
- Hamilton County · 701,295 people
- City population
- 505,555
- Metro
- Cincinnati, OH-KY-IN
- Population (ZIP)
- 6,983
- Household income
- $49,801
- Rent vs Own
- Severe rent burden
- 422.0
Population outlook (Hamilton County) Hauer SSP2
- Today (2025)
- 826,054 people
- By 2030
- 830,947 · +0.6%
- By 2040
- 832,319 · +0.8%
- By 2050
- 822,428 · -0.4%
- By 2075
- 788,688 · -4.5%
- By 2100
- 710,674 · -14.0%
Race, ethnicity, and origin ACS 2023
- Neighborhood character
- Diverse neighborhood (Simpson 0.58)
- Race & ethnicity
- Black 51% White 39% Hispanic / Latino 6% Two or more races 4% Asian 2%
- Hispanic origin (detail)
- Mexican 3%
- Common ancestry
- Portuguese 1% Serbian 1% Romanian 1%
- Foreign-born
- 8% · Canada, China, South Korea
- Languages at home
- 88% English-only · Spanish 5% French/Haitian/Cajun 4% Chinese 1%
Political lean MEDSL · Hamilton
- 2024 margin
- D (+14.9) · D 57.0% · R 42.1%
- 2008→2024 swing
- +7.9pp toward D · 2008: 7.0pp · 2024: 14.9pp
- All cycles
- 2024: D+14.9 2020: D+15.9 2016: D+9.5 2012: D+4.9 2008: D+7.0
Not yet ingested
- Civics
- —
Market trends
- HPI YoY
- ▼ -144.98%
- Current HPI
- 273.9444
- Rent YoY
- —
- Metro
- Cincinnati, OH-KY-IN
- State GDP YoY
- ▲ 1.98%
- F500 in state
- 48
Industry mix (Fortune 500 HQ in OH)
| Industry | F500 HQs | Revenue |
|---|---|---|
| Insurance | 3 | $145B |
|
||
| Industrial Machinery | 3 | $49B |
|
||
| Financial Services | 3 | $24B |
|
||
| Consumer Goods | 2 | $93B |
|
||
| Aerospace / Defense | 2 | $47B |
|
||
| Utilities | 2 | $33B |
|
||
Price history
+229.4% since first listed8 events — show timeline
- 2026-02-10 Listed $280,000 Cincy MLS
- 2011-02-22 Sold (Public Records) $60,100 Public Records
- 2010-09-08 Sold (Public Records) $20,000 Public Records
- 2008-12-03 Sold (Public Records) $36,000 Public Records
- 2005-06-30 Sold (MLS) $35,000 Cincy MLS
- 2005-03-08 Listed $35,000 Cincy MLS
- 2000-01-21 Listing Removed — Cincy MLS
- 1999-12-20 Listed $85,000 Cincy MLS
Property tax history
+8.8%/yrLatest (2025): $3,435 · +1.8% YoY. Source: county tax records.
Cash-flow waterfall
monthlySold comps — $/sqft
last 12 mo · ≤1 miLoading sold comps…