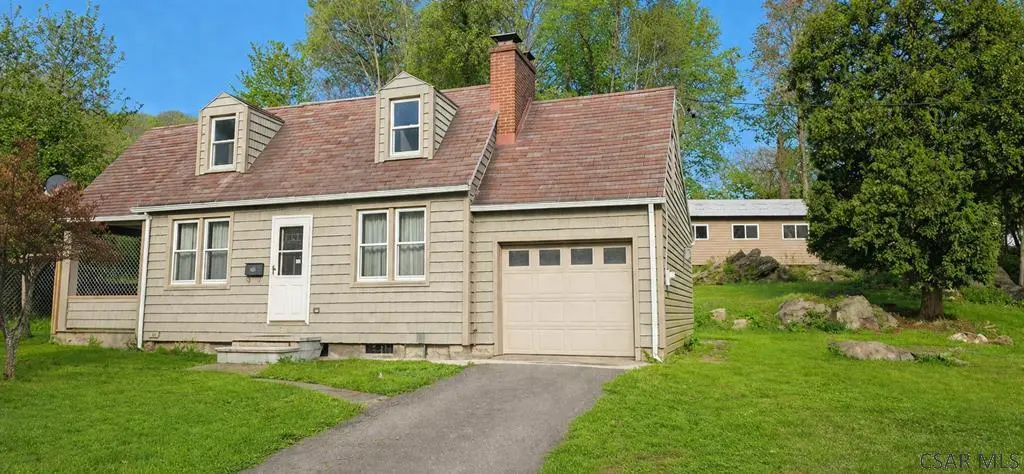
640 Fairfield Ave · Westwood, PA
Flood risk 7/10 · Major
- FEMA flood zone
- X (unshaded)
- Chance of flooding over 30 yrs
- 0.76%
- Est. flood insurance / yr
- $473 – $860
Fire risk 1/10 · Minimal
- Est. fire insurance / yr
- $511 – $949
Heat risk 3/10 · Minor
- Hot days now (above 96°F)
- 7 days/yr
- Hot days in 30 yrs
- 18 days/yr
Wind risk 2/10 · Minimal
- Chance of severe wind over 30 yrs
- —
Air-quality risk 2/10 · Minimal
- Unhealthy air days now
- 1 days/yr
- Unhealthy air days in 30 yrs
- 2 days/yr
Risk factors via First Street. Map © Google.
Why this score? — see what drove the B grade
The composite is a weighted blend of 9 inputs, each scored 0–100. Each bar is that input's sub-score; the figure is the points it added to the 100-point composite (weight × sub-score).
- Cash flow +29.2/30.0
- ARV discount +13.1/15.0
- DSCR +10.0/10.0
- 1% rule +9.3/10.0
- Appreciation +3.4/10.0
- Livability +3.2/5.0
- Rent growth +2.5/5.0
- Condition / age +2.5/5.0
- Schools +1.3/10.0
$59,900
🖨 Deal sheet 📄 Offer letter ✓ Due diligence
Listing remarks MLS
Really cute house!!! Move in condition! Sellers have done numerous updates! Pretty Hard wood floors! Large Liv R with working wood Fire Place! Mud R off Din area, into att garage. Lrg side porch to enjoy the outdoors! Sets on a private big lot. One extra parking space, besides the driveway. Large 24 x 28 shed in back. Street behind shed, makes it convenient to haul anything to the shed!
Key facts
- 1/2 acre
- Breakfast nook
- 24 x 28 shed
Tags
Property features AI
Exterior
- Parking: Attached garage (1 car)
- Utilities: Public water; Public sewer; Sewer available
- Home design: Single family residence; One-and-a-half to two levels; 2 total stories; Vinyl siding
- Construction: Shingle roof
- Exterior features: Covered patio and porch
Interior
- Kitchen: Range; Oven; Refrigerator; Dishwasher
- Flooring: Hardwood; Vinyl; Wood
- Bathrooms: 1 full bathroom
- Heating & cooling: Hot water heating (natural gas); Ceiling fan cooling
- Interior features: Wood-burning fireplace (1); Full basement
- Laundry & utility: Washer; Dryer (laundry located in basement)
Neighborhood map
What this means for you Summary
Snapshot
- This is a 3-bed/1.0-bath single-family listed at $60k.
Deal economics
- At list price, monthly cash flow is $153 ($2k/yr) — positive.
- The deal already cash-flows at list — no discount required.
- Meets the 1% rule at list price ($856 rent vs $60k).
- Recommended offer: $59k (1.5% below list) — sets the bar for market timing.
Location & tenants
- Location reads 63/100 on livability (#1,263 in PA) — a middle-class / working-renter tenant base. Strengths: crime A+, cost of living A+; Watch: schools F, amenities F, commute F.
- Greater Johnstown SD (urban): math 9% / reading 25% proficiency, ranked #509 of 539 in PA (top 94%) — low school quality limits family demand, transient renter base, plan for 1-2y turnover; 80% free/reduced lunch — lower-income household profile, screen leases tightly.
- Market conditions: 47 active listings in the ZIP; 5 comparable units currently listed for rent nearby; rentals at typical pace (median 24d on market — plan ~3-4 weeks tenant-placement turnaround); 64 units permitted in Cambria County in 2024 (0 in 5+ unit buildings).
Forward outlook
- Local home prices are declining (-3.0%/yr); year-one equity from $414 of loan paydown is wiped out by about $2k of value loss. Plan a longer hold.
- Cambria County population projected at -28% by 2050 — secular population decline; favor cash flow + early exit over multi-decade hold.
- At projected returns (-3.0% appreciation + 3.0% rent growth), your $17k cash investment doubles in ~10 years — after that, you're playing with house money.
Negotiation context
- It's been on market 20 days — a 2% lower offer ($59k) is reasonable based on typical stale-listing flexibility.
- 4 sale attempts since 22y ago with the ask held roughly flat each time — persistent listings suggest the price (not the market) is what's stuck; bring a comps-based counter.
- Current owner paid $50k; 20% above their basis — modest negotiation headroom, anchor on the comps not their cost.
Risks & watch-outs
- Watch-outs: property tax is 2.6% of price; flood insurance adds $56/mo.
- Climate carrying-cost: major flood risk — expect insurance premiums to compound above CPI over the hold.
Questions for the listing agent
- Property tax is high relative to price — has the assessment been appealed recently, and will the sale trigger a re-assessment?
- What's the actual annual flood-insurance premium (NFIP or private), and is the property in a SFHA with mandatory coverage?
- Is there a deadline driving the sale (1031 exchange, divorce, estate, relocation)? That informs how much negotiation room exists.
- Schools are F-rated, which usually means shorter tenancies and higher turnover. Who's the typical renter profile here, and what's been the actual vacancy rate?
- What's the average days-on-market for RENTAL listings here right now (not sales)? A rising rental-DOM trend means longer vacancies and softer asking-rent achievability than the comps imply.
- What's the recent tenant-quality profile in this submarket — average credit score on applications, eviction rate, late-payment / NSF rate, and stable-employment percentage? A property-management company in the area should have these aggregated.
- How much new for-sale + rental construction is in the pipeline within 1–3 miles? Heavy new supply typically softens prices + rents 12–24 months out; constrained supply supports both.
Investment metrics
- 1% rule
- 1.43% ✓
- Cap rate
- 10.46%
- Cash-on-cash
- 14.90%
- DSCR
- 1.66
- GRM
- 5.8
CMA / ARV
- ARV (median comp)
- $68,482
- List price
- $59,900
- Delta
- -12.53%
- Verdict
- UNDERPRICED
- Comps
- 20 within 1.0 mi
Show comp detail 12 sales within ~0.75 mi
| Address | Dist | Beds/Ba | Sqft | Sold | Price | $/sf | Match |
|---|---|---|---|---|---|---|---|
| 640 Fairfield Ave | 0.00mi | 3/1.0 | 1,110 (0%) | 0mo | $50,000 | $45 | 100 |
| 109 Lancer Ct | 0.07mi | 3/1.0 | 1,072 (-3%) | 9mo | $82,500 | $77 | 84 |
| 116 Blawn St | 0.25mi | 3/1.5 | 1,088 (-2%) | 8mo | $30,000 | $28 | 77 |
| 284 Wilson St | 0.59mi | 2/1.0 (-1) | 1,104 (-0%) | 3mo | $49,900 | $45 | 64 |
| 205 Sauers Ave | 0.20mi | 3/1.5 | 1,236 (+11%) | 13mo | $139,500 | $113 | 60 |
| 405 Chandler Ave | 0.60mi | 2/1.0 (-1) | 1,056 (-5%) | 3mo | $22,500 | $21 | 56 |
| 217 Olds Ave | 0.60mi | 3/2.0 | 1,148 (+3%) | 8mo | $50,000 | $44 | 56 |
| 222 Strayer St | 0.58mi | 3/1.0 | 1,160 (+4%) | 15mo | $34,900 | $30 | 53 |
| 420 Orange Ave | 0.42mi | 2/1.0 (-1) | 960 (-14%) | 14mo | $45,000 | $47 | 41 |
| 161.5 Barron Ave | 0.69mi | 2/1.0 (-1) | 968 (-13%) | 6mo | $25,000 | $26 | 36 |
| 149 Stone St | 0.72mi | 3/1.0 | 1,232 (+11%) | 15mo | $50,000 | $41 | 36 |
| 211 Comet Ct | 0.74mi | 3/1.0 | 1,248 (+12%) | 16mo | $72,500 | $58 | 31 |
Match score weights: distance 35% · size 25% · config 20% · recency 20%. Top-matched comps best support the ARV.
Projected returns pro-forma
-3.0% appreciation · 3.0% rent growth · sell at horizon
- IRR
- 0.2%
- Equity multiple
- 1.01×
- Total profit
- $97
- Equity at exit
- $8,931
- IRR
- 9.9%
- Equity multiple
- 1.77×
- Total profit
- $12,932
- Equity at exit
- $5,179
Cash invested: $16,772 (down + closing). Projections, not guarantees.
Landlord ↔ Tenant lean methodology
- Overall (STATE)
- 62 Landlord-Friendly
- State Pennsylvania
- 62 Landlord-Friendly · EVEN
- County
- — inherits STATE
- City
- — inherits STATE
ZIP-level market 15906
- Home prices YoY
- -4.0%
- Active inventory
- 47
- Price-to-rent
- 5.8×
Monthly cashflow live
- Estimated rent
- $856 high interval (Pro) →
- Mortgage (P&I)
- −$314
- Tax from tax record
- −$129 /mo · $1,552/yr
- Insurance
- −$25
- Flood insurance flood zone
- −$56 /mo · $666/yr
- HOA
- −$0
- Vacancy / Maint / Mgmt
- −$180
- Net cashflow
- $153
Break-even live
UW: 25.0% down · 7.5% · 30yr · 1.5% tax · 5.0% vac · 8.0% maint · 8.0% mgmt
Financing live
Cash to close
- Down payment
- $14,975
- Closing costs
- $1,797
- Reserves months
- —
- Total cash needed
- —
Loan-product check · same deal, 3 products live
Conventional
25% down · 7.5% · 30yr
- Down + closing
- —
- Monthly P&I
- —
- Monthly cashflow
- —
- DSCR
- —
- Eligible?
- —
Personal DTI + credit; lowest rate.
DSCR
20% down · 8.5% · 30yr
- Down + closing
- —
- Monthly P&I
- —
- Monthly cashflow
- —
- DSCR
- —
- Eligible?
- —
No personal income docs; deal must DSCR.
Hard money
10% down · 12.0% · 12mo
- Down + closing
- —
- Monthly P&I
- —
- Monthly cashflow
- —
- DSCR
- —
- Eligible?
- —
Short-term bridge; refi at stabilization.
Rent comps 5 comps
| Address | Beds | Baths | Sqft | Rent | $/sqft | DOM | Units | Dist |
|---|---|---|---|---|---|---|---|---|
| 207 Burkhard St Johnstown, PA | 2.0 | 1.0 | 856 | $825 | $0.96 | 23d | 1 | 0.62mi |
| 213 Stone St Johnstown, PA | 2.0 | 1.0 | 989 | $1,100 | $1.11 | 23d | 1 | 0.85mi |
| 444 Stone St Johnstown, PA | 2.0 | 1.0 | 908 | $700 | $0.77 | 43d | 1 | 1.01mi |
| 444 Stone St Unit 444 Johnstown, PA | 2.0 | 1.0 | 950 | $700 | $0.74 | 23d | 1 | 1.01mi |
| 459 Stone St Johnstown, PA | 3.0 | 1.0 | 1120 | $900 | $0.80 | 23d | 1 | 1.03mi |
Listing history 11 events
-
2026-05-01$59,900 Active 375-char remark
-
2014-02-07soldstatus $46,000 389-char remark
Show marketing remark (389 chars)
Really cute house!!! Move in condition! Sellers have done numerous updates! Pretty Hard wood floors! Large Liv R with working wood Fire Place! Mud R off Din area, into att garage. Lrg side porch to enjoy the outdoors! Sets on a private big lot. One extra parking space, besides the driveway. Large 24 x 28 shed in back. Street behind shed, makes it convenient to haul anything to the shed!
-
2014-01-30soldstatus $46,000
-
2013-05-29$46,000 389-char remark
Show marketing remark (389 chars)
Really cute house!!! Move in condition! Sellers have done numerous updates! Pretty Hard wood floors! Large Liv R with working wood Fire Place! Mud R off Din area, into att garage. Lrg side porch to enjoy the outdoors! Sets on a private big lot. One extra parking space, besides the driveway. Large 24 x 28 shed in back. Street behind shed, makes it convenient to haul anything to the shed!
-
2011-11-23soldstatus $48,000
-
2006-07-12soldstatus $69,300
Show marketing remark (317 chars)
You will love realxing on the 8' x 15' porch after a hard days work in this lovely 3 bedroom 1 3/4 bath with charm and character situated on beautiful private oversized lot (almost 1/2 acre) with BONUS 23' x 28' Out-Building which would be great for a workshop or storage. Hurry. .. .Call today to tour! A rare find!
-
2006-06-15soldstatus $69,300
-
2006-05-04$67,500
Show marketing remark (317 chars)
You will love realxing on the 8' x 15' porch after a hard days work in this lovely 3 bedroom 1 3/4 bath with charm and character situated on beautiful private oversized lot (almost 1/2 acre) with BONUS 23' x 28' Out-Building which would be great for a workshop or storage. Hurry. .. .Call today to tour! A rare find!
-
2004-10-21soldstatus $57,500
-
2004-10-14soldstatus $57,500
-
2004-08-24$54,900
ⓘ Source: listings_history table (triggers on properties + properties_extension) + one-shot
backfill from property_details.listing_events for pre-trigger history.
Tax reassessment forecast PA · Partial reset (capped growth)
- Current annual tax
- $1,552 · $129/mo
- Projected year-2 tax
- $1,552 · $129/mo
- Expected delta
- $0/yr ($0/mo · 0.0%)
ⓘ Screening estimate from a state-policy table — verify with the county assessor before closing.
Climate risk First Street
- Flood 7/10 Severe FEMA zone X (unshaded) · 76% chance over 30 yrs
- Wildfire 1/10 Low
- Heat 3/10 Moderate 7 d/yr ≥96°F today · 18 d/yr by 30 yrs out
- Wind 2/10 Low
- Air quality 2/10 Low 1 unhealthy d/yr today · 2 by 30 yrs out
Nearby sold comps map
Loading sold comps map…
Walkable amenities ~0.75 mi
Loading nearby amenities…
Taxation est. · year 1
- Rental income
- $10,278
- − Mortgage interest
- −$3,355
- − Property taxes
- −$1,552
- − Insurance
- −$966
- − Repairs & maintenance
- −$822
- − Management
- −$822
- − Depreciation
- −$1,743
- Taxable income
- $1,017
- Est. tax owed @ 24.0%
- −$244
- After-tax cash flow
- $1,588/yr
For passive investors: Depreciation is non-cash, so a rental often shows a tax loss while cash-flowing — sheltering income. Rental losses are passive: they offset passive income freely, and up to $25,000/yr can offset ordinary (W-2) income if you actively participate and your MAGI is under $100k (phasing out to $0 by $150k); unused losses carry forward. On sale, claimed depreciation is recaptured at up to 25%, and gains may owe capital-gains tax (a 1031 exchange can defer both). Figures are a year-1 estimate at your 24.0% rate — not tax advice; consult a CPA.
Schools (NCES district)
- District
- Greater Johnstown SD
- NCES district ID
- 4210950
- Math proficiency
- 9% ▼ -6.00%
- Reading proficiency
- 25% ▼ -6.00%
- Median HH income
- $27,890
- Composite
- 13.25/100
- National rank
- #9550
- State rank
- #509 of 539 in PA
Livability — Westwood
- Score
- 63/100
- State rank
- #1263
- US rank
- #15213
Category grades
Schools grade is shown separately in the Schools card above.
Census & demographics
- Population (ZIP)
- 9,654
Population outlook (Cambria County) Hauer SSP2
- Today (2025)
- 122,754 people
- By 2030
- 115,827 · -5.6%
- By 2040
- 101,309 · -17.5%
- By 2050
- 88,379 · -28.0%
- By 2075
- 65,237 · -46.9%
- By 2100
- 46,909 · -61.8%
Race, ethnicity, and origin ACS 2023
- Neighborhood character
- Predominantly White (79%)
- Race & ethnicity
- White 79% Black 11% Two or more races 7% Hispanic / Latino 3%
- Common ancestry
- Romanian 8% Polish 2% Slovak 2%
- Foreign-born
- 1% · Canada
- Languages at home
- 98% English-only · Spanish 1%
Political lean MEDSL · Cambria
- 2024 margin
- Solid R (+39.7) · D 29.8% · R 69.5%
- 2008→2024 swing
- -40.4pp toward R · 2008: 0.7pp · 2024: -39.7pp
- All cycles
- 2024: R+39.7 2020: R+37.3 2016: R+37.8 2012: R+17.8 2008: D+0.7
Not yet ingested
- Civics
- —
Market trends
- HPI YoY
- ▼ -3.26%
- Current HPI
- 77.6797
- Rent YoY
- —
- Metro
- —
- State GDP YoY
- ▲ 1.68%
- F500 in state
- 34
Industry mix (Fortune 500 HQ in PA)
| Industry | F500 HQs | Revenue |
|---|---|---|
| Healthcare | 2 | $309B |
|
||
| Insurance | 2 | $27B |
|
||
| Telecommunications / Media | 1 | $124B |
|
||
| Industrial Distribution | 1 | $22B |
|
||
| Financial Services | 1 | $20B |
|
||
| Chemicals / Materials | 1 | $18B |
|
||
Price history
-8.9% since first listed13 events — show timeline
- 2026-06-05 Sold (MLS) $50,000 CSMLS
- 2026-05-21 Pending — CSMLS
- 2026-05-01 Listed $59,900 CSMLS
- 2014-02-07 Sold (MLS) $46,000 CSMLS
- 2014-01-30 Sold (Public Records) $46,000 Public Records
- 2013-05-29 Listed $46,000 CSMLS
- 2011-11-23 Sold (Public Records) $48,000 Public Records
- 2006-07-12 Sold (MLS) $69,300 CSMLS
- 2006-06-15 Sold (Public Records) $69,300 Public Records
- 2006-05-04 Listed $67,500 CSMLS
- 2004-10-21 Sold (MLS) $57,500 CSMLS
- 2004-10-14 Sold (Public Records) $57,500 Public Records
- 2004-08-24 Listed $54,900 CSMLS
Property tax history
+0.6%/yrLatest (2026): $1,552 · +0.0% YoY. Source: county tax records.
Cash-flow waterfall
monthlySold comps — $/sqft
last 12 mo · ≤1 miLoading sold comps…