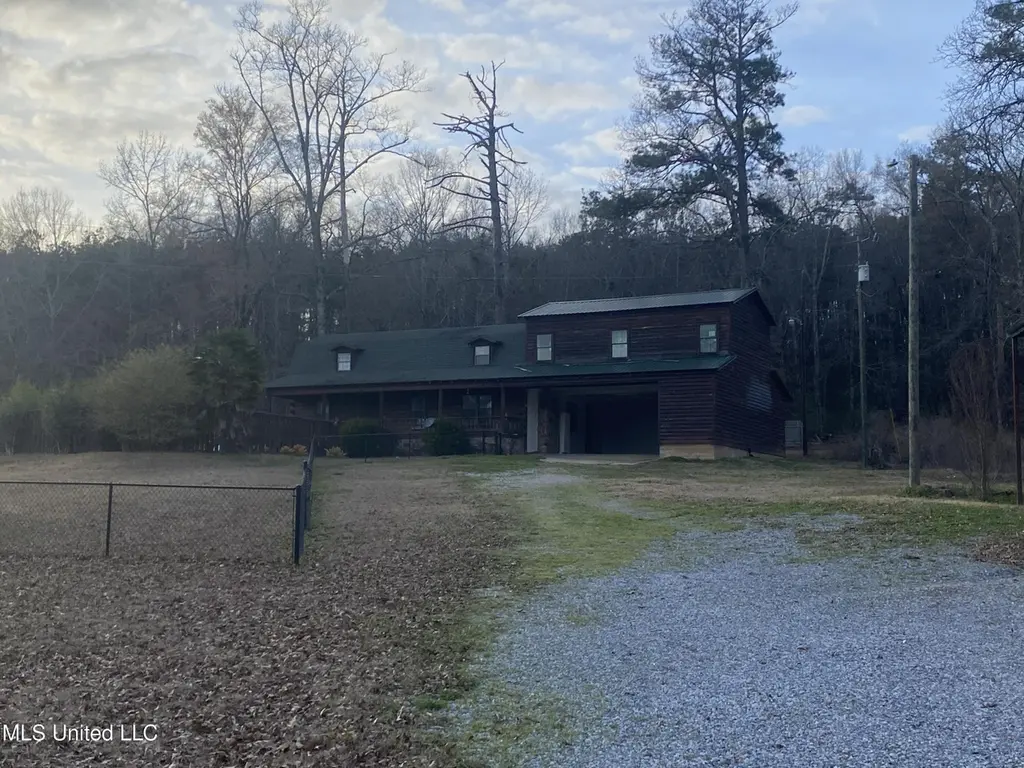
3070 Louisiana 8 · Sicily Island, LA
Flood risk 1/10 · Minimal
- FEMA flood zone
- —
- Chance of flooding over 30 yrs
- 0.0%
- Est. flood insurance / yr
- —
Fire risk 3/10 · Minor
- Est. fire insurance / yr
- $1,269 – $2,357
Heat risk 7/10 · Major
- Hot days now (above 109°F)
- 7 days/yr
- Hot days in 30 yrs
- 19 days/yr
Wind risk 8/10 · Major
- Chance of severe wind over 30 yrs
- 80.0%
Air-quality risk 1/10 · Minimal
- Unhealthy air days now
- 0 days/yr
- Unhealthy air days in 30 yrs
- 0 days/yr
Risk factors via First Street. Map © Google.
Why this score? — see what drove the D- grade
The composite is a weighted blend of 9 inputs, each scored 0–100. Each bar is that input's sub-score; the figure is the points it added to the 100-point composite (weight × sub-score).
- Cash flow +11.9/30.0
- ARV discount +7.5/15.0
- Appreciation +5.0/10.0
- DSCR +3.5/10.0
- Livability +2.8/5.0
- Rent growth +2.5/5.0
- Condition / age +2.5/5.0
- 1% rule +2.2/10.0
- Schools +2.1/10.0
$173,000
🖨 Deal sheet (PDF) 📄 Offer letter ✓ Due diligence
Listing remarks MLS
Looking for your piece of paradise in the country? Look no further! With 3,025 square feet of living space, an in ground, salt water pool, 30x40 shop and 2.67 acres to roam, you will find what you're looking for! There is also an extra ''pool house'', ''beauty shop'', ''bait shop'' or whatever you want it to be! You have to see this one for yourself! All measurements are estimated. Buyer is encouraged to measure.
Key facts
- 2.67 acres
- 30x40 shop
- Pool house
Tags
Neighborhood map
What this means for you Summary
Snapshot
- This is a 4-bed/3.5-bath other listed at $173k.
Deal economics
- At list price, monthly cash flow is $-44 ($-523/yr) — negative.
- To cash-flow at today's rent, offer at most $165k (4.4% below list).
- To meet the 1% rule (rent ≥ 1% of price), the offer needs to be $124k (28.3% below list).
- Recommended offer: $124k (28.3% below list) — sets the bar for 1% rule.
Location & tenants
- Location reads 55/100 on livability (#360 in LA) — a working-class tenant base; expect higher turnover. Strengths: cost of living A+, housing A+; Watch: health & safety D, crime F, amenities F.
- Catahoula Parish (rural): math 17% / reading 34% proficiency, ranked #58 of 98 in LA (top 59%) — low school quality limits family demand, transient renter base, plan for 1-2y turnover; 69% free/reduced lunch — lower-income household profile, screen leases tightly.
- Zoned schools: Jonesville Elementary School (math 17% / reading 22%, grade F, #448 of 646 statewide, top 71%, 259 students, 51% FRL); Block High School (math 2% / reading 27%, grade F, #221 of 265 statewide, top 84%, 218 students, 80% FRL) — zoned schools at 66% FRL track the district average.
- Market conditions: 6 active listings in the ZIP; 60 units permitted in Catahoula Parish in 2024 (0 in 5+ unit buildings).
Forward outlook
- In year one you build about $6k of equity ($1k loan paydown + $5k appreciation (3.0% local appreciation)).
- Catahoula County population projected at -17% by 2050 — secular population decline; favor cash flow + early exit over multi-decade hold.
- At projected returns (3.0% appreciation + 3.0% rent growth), your $48k cash investment doubles in ~7 years — after that, you're playing with house money.
- By year 6, paydown + projected appreciation supports a ~$34k cash-out refi (75% LTV) — recoverable capital for the next deal without selling this one.
Negotiation context
- It's been on market 122 days — a 12% lower offer ($152k) is reasonable based on typical stale-listing flexibility.
- 2 sale attempts since 14y ago with the ask held roughly flat each time — persistent listings suggest the price (not the market) is what's stuck; bring a comps-based counter.
- Current owner paid $115k; list at $173k implies a 50% gain — meaningful room to come down on a strong offer.
Risks & watch-outs
- Climate carrying-cost: severe wind risk, 80% chance of damaging wind over 30y; extreme-heat days projected 7→19/yr by 2055 (HVAC capex compounding) — expect insurance premiums to compound above CPI over the hold.
Questions for the listing agent
- What do current leases actually rent for vs. the listed asking? Can we see a recent rent roll and the last 12 months of T-12 income?
- It's been on market 122 days. Have you received any prior offers? Is the seller open to a 28% concession, seller financing, or rate buy-down credit?
- Why hasn't it sold? Are there any deal-killer items the seller is aware of (foundation, flood, title, zoning, code violations)?
- Is there a deadline driving the sale (1031 exchange, divorce, estate, relocation)? That informs how much negotiation room exists.
- Crime grade is F in this area — have there been break-ins, vandalism, or insurance claims at this property in the last 3 years? What carrier currently insures it and at what premium?
- The area grade is low — what's the realistic commute time and amenity access for the typical tenant pool here? Any planned neighborhood developments (good or bad) we should know about?
- What's the average days-on-market for RENTAL listings here right now (not sales)? A rising rental-DOM trend means longer vacancies and softer asking-rent achievability than the comps imply.
- What's the recent tenant-quality profile in this submarket — average credit score on applications, eviction rate, late-payment / NSF rate, and stable-employment percentage? A property-management company in the area should have these aggregated.
- How much new for-sale + rental construction is in the pipeline within 1–3 miles? Heavy new supply typically softens prices + rents 12–24 months out; constrained supply supports both.
Investment metrics
- 1% rule
- 0.72% ✗
- Cap rate
- 5.99%
- Cash-on-cash
- -1.08%
- DSCR
- 0.95
- GRM
- 11.6
CMA / ARV
No comps found within radius.
Projected returns pro-forma
3.0% appreciation · 3.0% rent growth · sell at horizon
- IRR
- 6.5%
- Equity multiple
- 1.37×
- Total profit
- $17,979
- Equity at exit
- $77,788
- IRR
- 9.3%
- Equity multiple
- 2.40×
- Total profit
- $67,799
- Equity at exit
- $119,881
Cash invested: $48,440 (down + closing). Projections, not guarantees.
Landlord ↔ Tenant lean methodology
- Overall (STATE)
- 90 Strongly Landlord-Friendly
- State Louisiana
- 90 Strongly Landlord-Friendly · R+12
- County
- — inherits STATE
- City
- — inherits STATE
ZIP-level market 71368
- Active inventory
- 6
- Price-to-rent
- 11.6×
Monthly cashflow live
- Estimated rent
- $1,240 medium interval (Pro) →
- Mortgage (P&I)
- −$907
- Tax from tax record
- −$44 /mo · $527/yr
- Insurance
- −$72
- HOA
- −$0
- Vacancy / Maint / Mgmt
- −$260
- Net cashflow
- $-44
Break-even live
Sensitivity live
| Price | -10% $54 | -5% $5 | +0% $-44 | +5% $-93 | +10% $-141 |
|---|---|---|---|---|---|
| Rent | -10% $-142 | -5% $-93 | +0% $-44 | +5% $5 | +10% $54 |
| Rate | -1.0pp $44 | -0.5pp $0 | base $-44 | +0.5pp $-88 | +1.0pp $-134 |
UW: 25.0% down · 7.5% · 30yr · 1.5% tax · 5.0% vac · 8.0% maint · 8.0% mgmt
Financing live
Cash to close
- Down payment
- $43,250
- Closing costs
- $5,190
- Reserves months
- —
- Total cash needed
- —
Loan-product check · same deal, 3 products live
Conventional
25% down · 7.5% · 30yr
- Down + closing
- —
- Monthly P&I
- —
- Monthly cashflow
- —
- DSCR
- —
- Eligible?
- —
Personal DTI + credit; lowest rate.
DSCR
20% down · 8.5% · 30yr
- Down + closing
- —
- Monthly P&I
- —
- Monthly cashflow
- —
- DSCR
- —
- Eligible?
- —
No personal income docs; deal must DSCR.
Hard money
10% down · 12.0% · 12mo
- Down + closing
- —
- Monthly P&I
- —
- Monthly cashflow
- —
- DSCR
- —
- Eligible?
- —
Short-term bridge; refi at stabilization.
Listing history 22 events
-
2026-06-21days on market $173,000 Active 122 DOM
-
2026-06-21days on market $173,000 Active 121 DOM
-
2026-06-18days on market $173,000 Active 119 DOM
-
2026-06-17days on market $173,000 Active 118 DOM
-
2026-06-16days on market $173,000 Active 117 DOM
-
2026-06-15days on market $173,000 Active 116 DOM
-
2026-06-13days on market $173,000 Active 114 DOM
-
2026-06-12days on market $173,000 Active 113 DOM
-
2026-06-09days on market $173,000 Active 110 DOM
-
2026-06-08days on market $173,000 Active 109 DOM
-
2026-06-07days on market $173,000 Active 108 DOM
-
2026-06-07days on market $173,000 Active 107 DOM
-
2026-06-04days on market $173,000 Active 104 DOM
-
2026-06-02days on market $173,000 Active 103 DOM
-
2026-06-01days on market $173,000 Active 102 DOM
-
2026-05-31days on market $173,000 Active 101 DOM
-
2026-05-31days on market $173,000 Active 100 DOM
-
2026-02-18$173,000 Active 420-char remark
Show marketing remark (420 chars)
Looking for your piece of paradise in the country? Look no further! With 3,025 square feet of living space, an in ground, salt water pool, 30x40 shop and 2.67 acres to roam, you will find what you're looking for! There is also an extra ''pool house'', ''beauty shop'', ''bait shop'' or whatever you want it to be! You have to see this one for yourself! All measurements are estimated. Buyer is encouraged to measure.
-
2013-11-05soldstatus $115,000
-
2013-02-15soldstatus $94,000
-
2013-02-08soldstatus 275-char remark
Show marketing remark (275 chars)
This is a well built log home. Beautiful wood floors in the living area with wood walls and ceiling throughout. Master bedroom and bath are upstairs just off large loft. Two bedrooms and a bath are downstairs. Large yard. Deck with hot tub. To be sold in AS IS Condition.
-
2012-11-06$104,900 275-char remark
Show marketing remark (275 chars)
This is a well built log home. Beautiful wood floors in the living area with wood walls and ceiling throughout. Master bedroom and bath are upstairs just off large loft. Two bedrooms and a bath are downstairs. Large yard. Deck with hot tub. To be sold in AS IS Condition.
ⓘ Source: listings_history table (triggers on properties + properties_extension) + one-shot
backfill from property_details.listing_events for pre-trigger history.
Tax reassessment forecast LA · Resets to sale price
- Current annual tax
- $527 · $44/mo
- Projected year-2 tax
- $952 · $79/mo
- Expected delta
- +$425/yr (+$35/mo · 80.6%)
ⓘ Screening estimate from a state-policy table — verify with the county assessor before closing.
Climate risk First Street
- Flood 1/10 Low 0% chance over 30 yrs
- Wildfire 3/10 Moderate
- Heat 7/10 Severe 7 d/yr ≥109°F today · 19 d/yr by 30 yrs out
- Wind 8/10 Severe 80% chance of damaging wind over 30 yrs
- Air quality 1/10 Low 0 unhealthy d/yr today · 0 by 30 yrs out
Nearby sold comps map
Loading sold comps map…
Walkable amenities ~0.75 mi
Loading nearby amenities…
Taxation est. · year 1
- Rental income
- $14,881
- − Mortgage interest
- −$9,691
- − Property taxes
- −$527
- − Insurance
- −$865
- − Repairs & maintenance
- −$1,190
- − Management
- −$1,190
- − Depreciation
- −$5,033
- Taxable loss
- −$3,615
- Est. tax savings @ 24.0%
- +$868
- After-tax cash flow
- $345/yr
For passive investors: Depreciation is non-cash, so a rental often shows a tax loss while cash-flowing — sheltering income. Rental losses are passive: they offset passive income freely, and up to $25,000/yr can offset ordinary (W-2) income if you actively participate and your MAGI is under $100k (phasing out to $0 by $150k); unused losses carry forward. On sale, claimed depreciation is recaptured at up to 25%, and gains may owe capital-gains tax (a 1031 exchange can defer both). Figures are a year-1 estimate at your 24.0% rate — not tax advice; consult a CPA.
Schools (NCES district)
- District
- Catahoula Parish
- NCES district ID
- 2200420
- Math proficiency
- 17% ▼ -44.00%
- Reading proficiency
- 34% ▼ -40.00%
- Median HH income
- $36,659
- Composite
- 21.13/100
- National rank
- #8435
- State rank
- #58 of 98 in LA
Livability — Sicily Island
- Score
- 55/100
- State rank
- #360
- US rank
- #23235
Category grades
Schools grade is shown separately in the Schools card above.
Census & demographics
- Population (ZIP)
- 1,313
Population outlook (Catahoula County) Hauer SSP2
- Today (2025)
- 9,498 people
- By 2030
- 9,137 · -3.8%
- By 2040
- 8,428 · -11.3%
- By 2050
- 7,845 · -17.4%
- By 2075
- 6,875 · -27.6%
- By 2100
- 5,953 · -37.3%
Race, ethnicity, and origin ACS 2023
- Neighborhood character
- Diverse neighborhood (Simpson 0.56)
- Race & ethnicity
- Black 54% White 39% Two or more races 5% Hispanic / Latino 3%
- Common ancestry
- Serbian 1% Portuguese 1% Italian 1%
Political lean MEDSL · Catahoula
- 2024 margin
- Solid R (+50.5) · D 24.4% · R 74.9%
- 2008→2024 swing
- -15.6pp toward R · 2008: -35.0pp · 2024: -50.5pp
- All cycles
- 2024: R+50.5 2020: R+46.8 2016: R+44.4 2012: R+31.9 2008: R+35.0
Not yet ingested
- Civics
- —
Market trends
- HPI YoY
- —
- Current HPI
- —
- Rent YoY
- —
- Metro
- —
- State GDP YoY
- ▲ 3.29%
- F500 in state
- 10
Industry mix (Fortune 500 HQ in LA)
| Industry | F500 HQs | Revenue |
|---|---|---|
| Telecommunications | 2 | $23B |
|
||
| Utilities | 1 | $12B |
|
||
| Wholesale / Distribution | 1 | $5B |
|
||
| Advertising | 1 | $2B |
|
||
Price history
+64.9% since first listed5 events — show timeline
- 2026-02-18 Listed $173,000 MLSU
- 2013-11-05 Sold (Public Records) $115,000 Public Records
- 2013-02-15 Sold (Public Records) $94,000 Public Records
- 2013-02-08 Sold (MLS) — MLSU
- 2012-11-06 Listed $104,900 MLSU
Property tax history
-0.0%/yrLatest (2025): $527 · +0.0% YoY. Source: county tax records.
Cash-flow waterfall
monthlySold comps — $/sqft
last 12 mo · ≤1 miLoading sold comps…