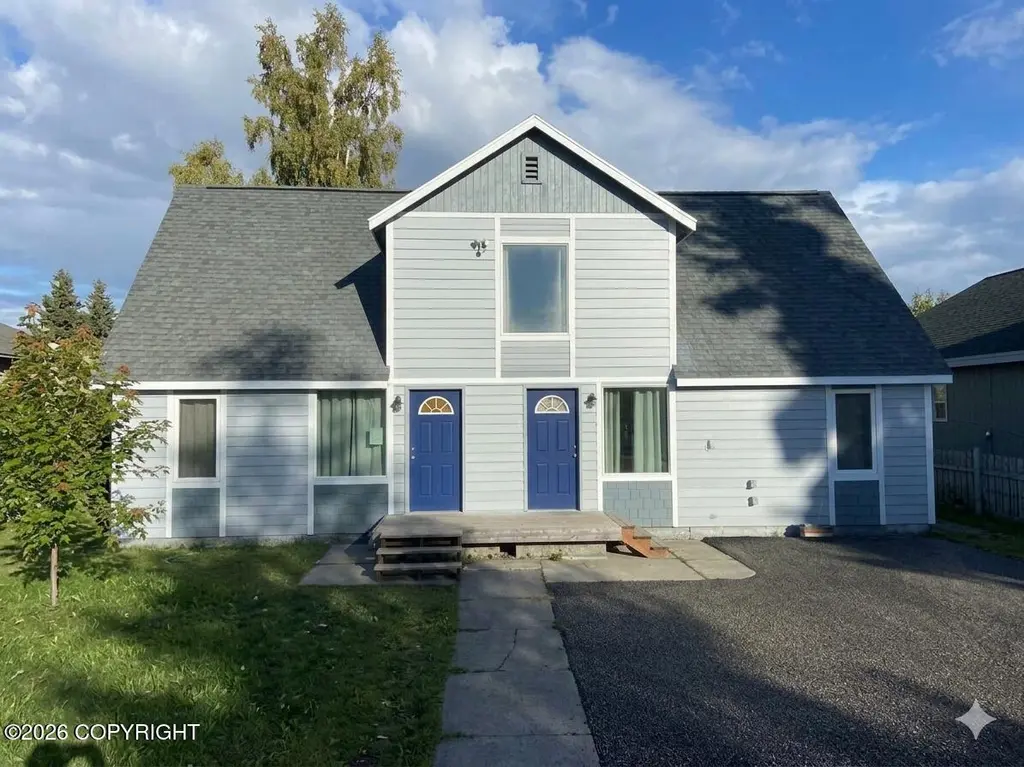
 Triplex
203 N Hoyt St · Anchorage, AK
Flood risk 1/10 · Minimal
- FEMA flood zone
- X (unshaded)
- Chance of flooding over 30 yrs
- 0.0%
- Est. flood insurance / yr
- $507 – $1,088
Fire risk No data
- Est. fire insurance / yr
- —
Heat risk No data
- Hot days now (above threshold)
- —
- Hot days in 30 yrs
- —
Wind risk No data
- Chance of severe wind over 30 yrs
- —
Air-quality risk 1/10 · Minimal
- Unhealthy air days now
- —
- Unhealthy air days in 30 yrs
- —
Risk factors via First Street. Map © Google.
Why this score? — see what drove the D grade
The composite is a weighted blend of 9 inputs, each scored 0–100. Each bar is that input's sub-score; the figure is the points it added to the 100-point composite (weight × sub-score).
- Cash flow +17.3/30.0
- DSCR +5.4/10.0
- 1% rule +4.0/10.0
- Livability +3.9/5.0
- Rent growth +3.7/5.0
- Schools +3.7/10.0
- Condition / age +2.5/5.0
- ARV discount +0.5/15.0
- Appreciation +0.0/10.0
$449,000
🖨 Deal sheet 📄 Offer letter ✓ Due diligence
Multi-family units
County records classify this as Multi-Family (2-4 Unit). Listing-text estimate: 3 units. confirmed
Listing remarks MLS
Don't miss this exceptional opportunity to own a well-maintained triplex with impressive income potential. This versatile property includes three thoughtfully designed units: one 1-bedroom, 1-bath--perfect for singles or couples--and two spacious 2-bedroom, 1-bath units. Each unit features comfortable living spaces, private entrances, and strong rental appeal, making this property ideal for consistent cash flow. Unit 1 is currently vacant and move-in ready, offering a prime opportunity for an owner-occupant or an investor looking to maximize returns from day one. The property also boasts a large backyard with mature apple and cherry trees, and currants adding charm and outdoor appeal for tenants. A detached grandfathered 3-car garage/shop provides additional value-add potential--while it currently needs renovation, it presents an excellent opportunity to increase rental income, create additional storage, or develop a highly desirable workspace to further enhance overall returns.
Key facts
- 6,098 sq ft lot
- 3 parking spots
- Built 1950
Neighborhood map
What this means for you Summary
Snapshot
- This is a 1×1bd/1ba + 2×2bd/1ba units multifamily listed at $449k.
Deal economics
- At list price, monthly cash flow is $327 ($4k/yr) — positive. Per door: $109/mo.
- The deal already cash-flows at list — no discount required.
- To meet the 1% rule (rent ≥ 1% of price), the offer needs to be $404k (10.0% below list).
- Recommended offer: $404k (10.0% below list) — sets the bar for 1% rule.
- Cap rate 7.2% vs local median 3.8% in Anchorage — top-decile yield for the area; either an underpriced asset or a hidden risk that comps aren't pricing in. Stress-test before assuming the spread holds.
Location & tenants
- Location reads 78/100 on livability (#6 in AK, #2,553 nationally) — a middle-class / working-renter tenant base. Strengths: amenities A+, commute A+, employment A+; Watch: crime F, cost of living F.
- Anchorage School District (urban): math 37% / reading 43% proficiency, ranked #6 of 21 in AK (top 29%) — families likely to look elsewhere, expect single-tenant / working-renter base with shorter leases.
- Market conditions: Rents rising fast (+4.9%/yr); 147 active listings in the ZIP; solid renter incomes; 306 units permitted in Anchorage Municipality in 2024 (90 in 5+ unit buildings).
- At $4,043/mo this rent would consume 61% of the median local household income ($79k/yr) (locally 1248% of renters already pay >50% of income on rent) — very limited rent-growth headroom before tenants either downsize or default.
Forward outlook
- Local home prices are declining (-3.0%/yr); year-one equity from $3k of loan paydown is wiped out by about $13k of value loss. Plan a longer hold.
- Anchorage County population projected at +12% by 2050 — modest demand growth; plan on rents tracking national, not racing it.
Negotiation context
- It's been on market 69 days — a 6% lower offer ($422k) is reasonable based on typical stale-listing flexibility.
- 5 sale attempts since 19y ago with the ask held roughly flat each time — persistent listings suggest the price (not the market) is what's stuck; bring a comps-based counter.
Risks & watch-outs
- Watch-outs: built in 1950 — expect roof / HVAC / electrical / plumbing capex.
Questions for the listing agent
- It's been on market 69 days. Have you received any prior offers? Is the seller open to a 10% concession, seller financing, or rate buy-down credit?
- Can we see the unit-by-unit rent roll, current vacancy, and any below-market leases? What's the average tenancy length?
- What capital expenditures (roof, boiler, parking lot, exteriors) have been made in the last 5 years, and what's planned in the next 2?
- Built in 1950 — when were the roof, HVAC, electrical panel, plumbing, and water heater last replaced?
- Why hasn't it sold? Are there any deal-killer items the seller is aware of (foundation, flood, title, zoning, code violations)?
- Is there a deadline driving the sale (1031 exchange, divorce, estate, relocation)? That informs how much negotiation room exists.
- Schools are B-rated — typically a magnet for longer-tenancy family renters. What's the average tenant stay here, and is there a school-zone premium baked into asking?
- Crime grade is F in this area — have there been break-ins, vandalism, or insurance claims at this property in the last 3 years? What carrier currently insures it and at what premium?
- The area grade is low — what's the realistic commute time and amenity access for the typical tenant pool here? Any planned neighborhood developments (good or bad) we should know about?
- What's the average days-on-market for RENTAL listings here right now (not sales)? A rising rental-DOM trend means longer vacancies and softer asking-rent achievability than the comps imply.
- What's the recent tenant-quality profile in this submarket — average credit score on applications, eviction rate, late-payment / NSF rate, and stable-employment percentage? A property-management company in the area should have these aggregated.
- How much new apartment / multifamily construction is in the pipeline within 1–3 miles? Heavy new supply (>2% of stock underway) typically softens rents 12–24 months out; light construction supports rent growth.
Investment metrics
- 1% rule
- 0.90% ✗
- Cap rate
- 7.17%
- Cash-on-cash
- 3.12%
- DSCR
- 1.14
- GRM
- 9.3
CMA / ARV
- ARV (median comp)
- $388,883
- List price
- $449,000
- Delta
- 15.46%
- Verdict
- OVERPRICED
- Comps
- 20 within 1.0 mi
Show comp detail 12 sales within ~0.75 mi
| Address | Dist | Beds/Ba | Sqft | Sold | Price | $/sf | Match |
|---|---|---|---|---|---|---|---|
| 524 N Klevin St | 0.27mi | 5/3.0 | 2,116 (+6%) | 5mo | $350,000 | $165 | 74 |
| 712 N Bragaw St | 0.43mi | 5/2.0 | 2,080 (+4%) | 9mo | $385,000 | $185 | 62 |
| 409 Schodde St | 0.64mi | 6/2.0 (+1) | 2,016 (+1%) | 7mo | $399,900 | $198 | 54 |
| 617 N Park St | 0.27mi | 6/2.0 (+1) | 2,224 (+11%) | 7mo | $350,000 | $157 | 54 |
| 4312 E 6th Ave | 0.58mi | 4/2.0 (-1) | 2,048 (+2%) | 10mo | $274,900 | $134 | 52 |
| 302 Lionheart Ct | 0.68mi | 4/4.0 (-1) | 2,008 (+0%) | 21mo | $459,900 | $229 | 42 |
| 5024 Klondike Ave | 0.62mi | 5/2.0 | 1,800 (-10%) | 11mo | $392,500 | $218 | 41 |
| 4313 E 8th Ave | 0.69mi | 5/2.0 | 1,920 (-4%) | 21mo | $419,900 | $219 | 39 |
| 4536 E 6th Ave | 0.61mi | 4/2.0 (-1) | 1,872 (-6%) | 20mo | $419,900 | $224 | 35 |
| 4301 E 7th Ave | 0.62mi | 5/2.0 | 1,840 (-8%) | 24mo | $395,000 | $215 | 34 |
| 4770 Klondike Ave | 0.52mi | 4/2.0 (-1) | 1,728 (-14%) | 16mo | $399,000 | $231 | 31 |
| 805 Lane St | 0.73mi | 6/2.5 (+1) | 2,208 (+10%) | 20mo | $470,000 | $213 | 25 |
Match score weights: distance 35% · size 25% · config 20% · recency 20%. Top-matched comps best support the ARV.
Projected returns pro-forma
-3.0% appreciation · 4.88% rent growth · sell at horizon
- IRR
- -9.4%
- Equity multiple
- 0.65×
- Total profit
- $-44,223
- Equity at exit
- $66,947
- IRR
- 2.2%
- Equity multiple
- 1.17×
- Total profit
- $21,190
- Equity at exit
- $38,821
Cash invested: $125,720 (down + closing). Projections, not guarantees.
Landlord ↔ Tenant lean methodology
- Overall (STATE)
- 80 Strongly Landlord-Friendly
- State Alaska
- 80 Strongly Landlord-Friendly · R+8
- County
- — inherits STATE
- City
- — inherits STATE
ZIP-level market 99508
- Rents YoY
- 4.9%
- Active inventory
- 147
- Price-to-rent
- 29.6×
Monthly cashflow live
- Estimated rent
- $4,043 high interval (Pro) →
- Mortgage (P&I)
- −$2,355
- Tax from tax record
- −$325 /mo · $3,903/yr
- Insurance
- −$187
- HOA
- −$0
- Vacancy / Maint / Mgmt
- −$849
- Net cashflow
- $327
Break-even live
3-unit breakdown (identical units grouped — click to expand)
| Units | Beds | Baths | Est. rent |
|---|---|---|---|
| 1× unit | 1 | 1 | $1,264 |
| 2× units | 2 | 1 | $2,780 |
| #2 | 2 | 1 | $1,390 |
| #3 | 2 | 1 | $1,390 |
| Total (3 units) | $4,043 | ||
UW: 25.0% down · 7.5% · 30yr · 1.5% tax · 5.0% vac · 8.0% maint · 8.0% mgmt
Financing live
Cash to close
- Down payment
- $112,250
- Closing costs
- $13,470
- Reserves months
- —
- Total cash needed
- —
Loan-product check · same deal, 3 products live
Conventional
25% down · 7.5% · 30yr
- Down + closing
- —
- Monthly P&I
- —
- Monthly cashflow
- —
- DSCR
- —
- Eligible?
- —
Personal DTI + credit; lowest rate.
DSCR
20% down · 8.5% · 30yr
- Down + closing
- —
- Monthly P&I
- —
- Monthly cashflow
- —
- DSCR
- —
- Eligible?
- —
No personal income docs; deal must DSCR.
Hard money
10% down · 12.0% · 12mo
- Down + closing
- —
- Monthly P&I
- —
- Monthly cashflow
- —
- DSCR
- —
- Eligible?
- —
Short-term bridge; refi at stabilization.
Listing history 23 events
-
2026-06-18days on market $449,000 Active 69 DOM
-
2026-06-17days on market $449,000 Active 68 DOM
-
2026-06-16days on market $449,000 Active 67 DOM
-
2026-06-15days on market $449,000 Active 66 DOM
-
2026-06-14days on market $449,000 Active 64 DOM
-
2026-06-13days on market $449,000 Active 63 DOM
-
2026-06-10days on market $449,000 Active 61 DOM
-
2026-06-09days on market $449,000 Active 60 DOM
-
2026-06-08days on market $449,000 Active 59 DOM
-
2026-06-07days on market $449,000 Active 58 DOM
-
2026-06-03days on market $449,000 Active 54 DOM
-
2026-06-02days on market $449,000 Active 53 DOM
-
2026-06-01days on market $449,000 Active 52 DOM
-
2026-05-31days on market $449,000 Active 51 DOM
-
2026-05-30days on market $449,000 Active 50 DOM
-
2026-04-10$449,000 Active 994-char remark
Show marketing remark (994 chars)
Don't miss this exceptional opportunity to own a well-maintained triplex with impressive income potential. This versatile property includes three thoughtfully designed units: one 1-bedroom, 1-bath--perfect for singles or couples--and two spacious 2-bedroom, 1-bath units. Each unit features comfortable living spaces, private entrances, and strong rental appeal, making this property ideal for consistent cash flow. Unit 1 is currently vacant and move-in ready, offering a prime opportunity for an owner-occupant or an investor looking to maximize returns from day one. The property also boasts a large backyard with mature apple and cherry trees, and currants adding charm and outdoor appeal for tenants. A detached grandfathered 3-car garage/shop provides additional value-add potential--while it currently needs renovation, it presents an excellent opportunity to increase rental income, create additional storage, or develop a highly desirable workspace to further enhance overall returns.
-
2025-10-14status Active
-
2025-10-07status Pending
-
2025-08-09$449,900 Active
-
2011-06-24soldstatus
-
2010-07-26$149,900
-
2007-12-13soldstatus
-
2007-07-09$137,000
ⓘ Source: listings_history table (triggers on properties + properties_extension) + one-shot
backfill from property_details.listing_events for pre-trigger history.
Tax reassessment forecast AK · Partial reset (capped growth)
- Current annual tax
- $3,903 · $325/mo
- Projected year-2 tax
- $4,623 · $385/mo
- Expected delta
- +$720/yr (+$60/mo · 18.4%)
ⓘ Screening estimate from a state-policy table — verify with the county assessor before closing.
Climate risk First Street
- Flood 1/10 Low FEMA zone X (unshaded) · 0% chance over 30 yrs
- Air quality 1/10 Low
Nearby sold comps map
Loading sold comps map…
Walkable amenities ~0.75 mi
Loading nearby amenities…
Taxation est. · year 1
- Rental income
- $48,516
- − Mortgage interest
- −$25,151
- − Property taxes
- −$3,903
- − Insurance
- −$2,245
- − Repairs & maintenance
- −$3,881
- − Management
- −$3,881
- − Depreciation
- −$13,062
- Taxable loss
- −$3,608
- Est. tax savings @ 24.0%
- +$866
- After-tax cash flow
- $4,790/yr
For passive investors: Depreciation is non-cash, so a rental often shows a tax loss while cash-flowing — sheltering income. Rental losses are passive: they offset passive income freely, and up to $25,000/yr can offset ordinary (W-2) income if you actively participate and your MAGI is under $100k (phasing out to $0 by $150k); unused losses carry forward. On sale, claimed depreciation is recaptured at up to 25%, and gains may owe capital-gains tax (a 1031 exchange can defer both). Figures are a year-1 estimate at your 24.0% rate — not tax advice; consult a CPA.
Schools (NCES district)
- District
- Anchorage School District
- NCES district ID
- 0200180
- Math proficiency
- 37% ▼ -2.00%
- Reading proficiency
- 43% ▲ 1.00%
- Median HH income
- $76,447
- Composite
- 37.0/100
- National rank
- #4523
- State rank
- #6 of 21 in AK
Livability — Anchorage
- Score
- 78/100
- State rank
- #6
- US rank
- #2553
Category grades
Schools grade is shown separately in the Schools card above.
Census & demographics
- Census place
- Anchorage, AK
- County
- Anchorage Borough · 246,594 people
- City population
- 218,117
- Metro
- Anchorage, AK
- Population (ZIP)
- 36,458
- Household income
- $79,314
- Rent vs Own
- Severe rent burden
- 1248.0
Population outlook (Anchorage County) Hauer SSP2
- Today (2025)
- 314,993 people
- By 2030
- 321,771 · +2.2%
- By 2040
- 335,493 · +6.5%
- By 2050
- 352,799 · +12.0%
- By 2075
- 414,771 · +31.7%
- By 2100
- 474,485 · +50.6%
Race, ethnicity, and origin ACS 2023
- Neighborhood character
- Highly diverse neighborhood (Simpson 0.82)
- Race & ethnicity
- White 38% Two or more races 14% Asian 13% Hispanic / Latino 13% Native American 10% Pacific Islander 8% Black 6%
- Hispanic origin (detail)
- Mexican 4% Puerto Rican 2% Cuban 1% Dominican 3%
- Common ancestry
- Portuguese 3% Iranian 2% Romanian 2%
- Foreign-born
- 15% · Canada, Jamaica, South Korea
- Languages at home
- 72% English-only · Other Asian/Pacific 11% Spanish 8% Tagalog/Filipino 4%
Political lean MEDSL · Anchorage
- 2024 margin
- D (+12.7) · D 56.3% · R 43.7%
- 2016→2024 swing
- +27.9pp toward D · 2016: -15.2pp · 2024: 12.7pp
- All cycles
- 2024: D+12.7 2016: R+15.2
Not yet ingested
- Civics
- —
Market trends
- HPI YoY
- ▼ -203.51%
- Current HPI
- 257.8807
- Rent YoY
- ▲ 4.88%
- Metro
- Anchorage, AK
- State GDP YoY
- —
- F500 in state
- 0
Price history
+227.7% since first listed8 events — show timeline
- 2026-04-10 Listed $449,000 AKMLS
- 2025-10-14 Relisted — AKMLS
- 2025-10-07 Pending — AKMLS
- 2025-08-09 Listed $449,900 AKMLS
- 2011-06-24 Sold (Public Records) — Public Records
- 2010-07-26 Listed $149,900 AKMLS
- 2007-12-13 Sold (Public Records) — Public Records
- 2007-07-09 Listed $137,000 AKMLS
Property tax history
+4.1%/yrLatest (2025): $3,903 · +4.3% YoY. Source: county tax records.
Cash-flow waterfall
monthlySold comps — $/sqft
last 12 mo · ≤1 miLoading sold comps…