 🏷️ Likely Rental
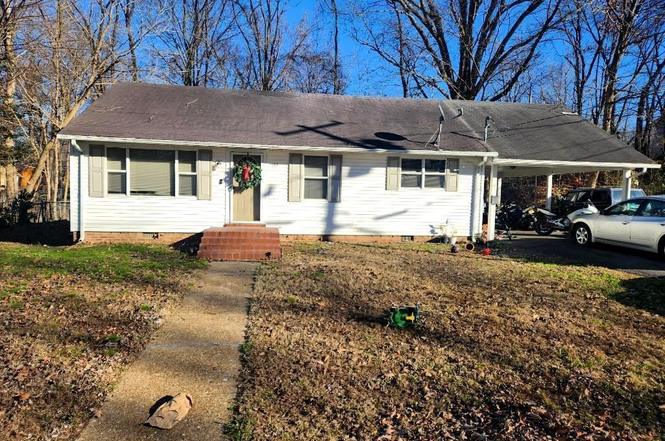
144 Beaumont Street St · Martin, TN
Flood risk 7/10 · Major
- FEMA flood zone
- X (unshaded)
- Chance of flooding over 30 yrs
- 0.77%
- Est. flood insurance / yr
- $507 – $1,088
Fire risk 1/10 · Minimal
- Est. fire insurance / yr
- $949 – $1,763
Heat risk 6/10 · Moderate
- Hot days now (above 108°F)
- 7 days/yr
- Hot days in 30 yrs
- 21 days/yr
Wind risk 4/10 · Minor
- Chance of severe wind over 30 yrs
- 8.0%
Air-quality risk 1/10 · Minimal
- Unhealthy air days now
- 0 days/yr
- Unhealthy air days in 30 yrs
- 0 days/yr
Risk factors via First Street. Map © Google.
Why this score? — see what drove the B- grade
The composite is a weighted blend of 9 inputs, each scored 0–100. Each bar is that input's sub-score; the figure is the points it added to the 100-point composite (weight × sub-score).
- Cash flow +25.3/30.0
- ARV discount +15.0/15.0
- DSCR +8.3/10.0
- 1% rule +5.5/10.0
- Livability +3.8/5.0
- Schools +3.0/10.0
- Rent growth +2.5/5.0
- Condition / age +2.5/5.0
- Appreciation +0.0/10.0
$115,900
🖨 Deal sheet 📄 Offer letter ✓ Due diligence
Listing remarks
Residence rented on 30 day basis. Rent $ 900.00 per month . Excellent student residence, rental investment or starter home
Key facts
- 0.27 acre lot
- 2 garage spots
- Built 1957
Neighborhood map
What this means for you Summary
Snapshot
- This is a 2-bed/2.0-bath single-family listed at $116k.
Deal economics
- At list price, monthly cash flow is $196 ($2k/yr) — positive.
- The deal already cash-flows at list — no discount required.
- Meets the 1% rule at list price ($1k rent vs $116k).
- Recommended offer: $109k (6.0% below list) — sets the bar for market timing.
- Cap rate 9.0% vs local median 4.0% in Martin — top-decile yield for the area; either an underpriced asset or a hidden risk that comps aren't pricing in. Stress-test before assuming the spread holds.
Location & tenants
- Location reads 75/100 on livability (#15 in TN, #4,330 nationally) — a middle-class / working-renter tenant base. Strengths: cost of living A+, health & safety A+, housing B+; Watch: schools D+, commute F, employment F.
- Weakley County (rural): math 34% / reading 38% proficiency, ranked #32 of 139 in TN (top 23%) — families likely to look elsewhere, expect single-tenant / working-renter base with shorter leases.
- Market conditions: 85 active listings in the ZIP; 69 units permitted in Weakley County in 2024 (0 in 5+ unit buildings).
Forward outlook
- Local home prices are declining (-3.0%/yr); year-one equity from $801 of loan paydown is wiped out by about $3k of value loss. Plan a longer hold.
- Weakley County population projected at -20% by 2050 — secular population decline; favor cash flow + early exit over multi-decade hold.
Negotiation context
- It's been on market 76 days — a 6% lower offer ($109k) is reasonable based on typical stale-listing flexibility.
- Current owner paid $50k; list at $116k implies a 132% gain — meaningful room to come down on a strong offer.
Risks & watch-outs
- Watch-outs: flood insurance adds $66/mo; built in 1957 — expect roof / HVAC / electrical / plumbing capex.
- Climate carrying-cost: major flood risk; extreme-heat days projected 7→21/yr by 2055 (HVAC capex compounding) — expect insurance premiums to compound above CPI over the hold.
Questions for the listing agent
- It's been on market 76 days. Have you received any prior offers? Is the seller open to a 6% concession, seller financing, or rate buy-down credit?
- Built in 1957 — when were the roof, HVAC, electrical panel, plumbing, and water heater last replaced?
- What's the actual annual flood-insurance premium (NFIP or private), and is the property in a SFHA with mandatory coverage?
- Why hasn't it sold? Are there any deal-killer items the seller is aware of (foundation, flood, title, zoning, code violations)?
- Is there a deadline driving the sale (1031 exchange, divorce, estate, relocation)? That informs how much negotiation room exists.
- Schools are D-rated, which usually means shorter tenancies and higher turnover. Who's the typical renter profile here, and what's been the actual vacancy rate?
- What's the average days-on-market for RENTAL listings here right now (not sales)? A rising rental-DOM trend means longer vacancies and softer asking-rent achievability than the comps imply.
- What's the recent tenant-quality profile in this submarket — average credit score on applications, eviction rate, late-payment / NSF rate, and stable-employment percentage? A property-management company in the area should have these aggregated.
- How much new for-sale + rental construction is in the pipeline within 1–3 miles? Heavy new supply typically softens prices + rents 12–24 months out; constrained supply supports both.
Investment metrics
- 1% rule
- 1.05% ✓
- Cap rate
- 9.02%
- Cash-on-cash
- 9.72%
- DSCR
- 1.43
- GRM
- 7.9
CMA / ARV
- ARV (on-the-fly)
- $162,162
- Comps found
- 8
Show comp detail 8 sales within ~0.75 mi
| Address | Dist | Beds/Ba | Sqft | Sold | Price | $/sf | Match |
|---|---|---|---|---|---|---|---|
| 144 Beaumont Street St | 0.00mi | 2/1.5 | 1,053 (0%) | 1mo | $105,000 | $100 | 97 |
| 218 Elm St | 0.14mi | 2/1.0 | 1,008 (-4%) | 15mo | $120,000 | $119 | 70 |
| 410 Summer St | 0.33mi | 3/3.0 (+1) | 1,080 (+3%) | 2mo | $435,900 | $404 | 70 |
| 615 S Mccombs St | 0.52mi | 3/2.0 (+1) | 1,064 (+1%) | 9mo | $165,000 | $155 | 62 |
| 311 Jackson St | 0.67mi | 2/2.0 | 992 (-6%) | 5mo | $152,500 | $154 | 55 |
| 690 Elm St | 0.51mi | 3/1.0 (+1) | 1,038 (-1%) | 13mo | $105,000 | $101 | 54 |
| 104 Park St | 0.27mi | 2/1.0 | 896 (-15%) | 7mo | $161,000 | $180 | 53 |
| 110 Carter St | 0.55mi | 3/2.0 (+1) | 1,168 (+11%) | 8mo | $100,000 | $86 | 45 |
Match score weights: distance 35% · size 25% · config 20% · recency 20%. Top-matched comps best support the ARV.
Projected returns pro-forma
-3.0% appreciation · 3.0% rent growth · sell at horizon
- IRR
- -5.2%
- Equity multiple
- 0.81×
- Total profit
- $-6,270
- Equity at exit
- $17,281
- IRR
- 4.5%
- Equity multiple
- 1.33×
- Total profit
- $10,644
- Equity at exit
- $10,021
Cash invested: $32,452 (down + closing). Projections, not guarantees.
Landlord ↔ Tenant lean methodology
- Overall (STATE)
- 87 Strongly Landlord-Friendly
- State Tennessee
- 87 Strongly Landlord-Friendly · R+13
- County
- — inherits STATE
- City
- — inherits STATE
ZIP-level market 38237
- Home prices YoY
- -16.5%
- Active inventory
- 85
- Price-to-rent
- 7.9×
Monthly cashflow live
- Estimated rent
- $1,221 medium interval (Pro) →
- Mortgage (P&I)
- −$608
- Tax from tax record
- −$46 /mo · $548/yr
- Insurance
- −$48
- Flood insurance flood zone
- −$66 /mo · $798/yr
- HOA
- −$0
- Vacancy / Maint / Mgmt
- −$256
- Net cashflow
- $196
Break-even live
UW: 25.0% down · 7.5% · 30yr · 1.5% tax · 5.0% vac · 8.0% maint · 8.0% mgmt
Financing live
Cash to close
- Down payment
- $28,975
- Closing costs
- $3,477
- Reserves months
- —
- Total cash needed
- —
Loan-product check · same deal, 3 products live
Conventional
25% down · 7.5% · 30yr
- Down + closing
- —
- Monthly P&I
- —
- Monthly cashflow
- —
- DSCR
- —
- Eligible?
- —
Personal DTI + credit; lowest rate.
DSCR
20% down · 8.5% · 30yr
- Down + closing
- —
- Monthly P&I
- —
- Monthly cashflow
- —
- DSCR
- —
- Eligible?
- —
No personal income docs; deal must DSCR.
Hard money
10% down · 12.0% · 12mo
- Down + closing
- —
- Monthly P&I
- —
- Monthly cashflow
- —
- DSCR
- —
- Eligible?
- —
Short-term bridge; refi at stabilization.
Listing history 8 events
-
2026-04-13status Pending
-
2026-02-12price $115,900
-
2026-01-27price $124,900
-
2026-01-27$124,900,000 Active
-
2024-10-01price $140,000
-
2016-10-17soldstatus $50,000
-
2011-08-03soldstatus $52,750
-
2000-08-18soldstatus $30,000
ⓘ Source: listings_history table (triggers on properties + properties_extension) + one-shot
backfill from property_details.listing_events for pre-trigger history.
Tax reassessment forecast TN · Resets to sale price
- Current annual tax
- $548 · $46/mo
- Projected year-2 tax
- $823 · $69/mo
- Expected delta
- +$275/yr (+$23/mo · 50.2%)
ⓘ Screening estimate from a state-policy table — verify with the county assessor before closing.
Climate risk First Street
- Flood 7/10 Severe FEMA zone X (unshaded) · 77% chance over 30 yrs
- Wildfire 1/10 Low
- Heat 6/10 Major 7 d/yr ≥108°F today · 21 d/yr by 30 yrs out
- Wind 4/10 Moderate 8% chance of damaging wind over 30 yrs
- Air quality 1/10 Low 0 unhealthy d/yr today · 0 by 30 yrs out
Nearby sold comps map
Loading sold comps map…
Walkable amenities ~0.75 mi
Loading nearby amenities…
Taxation est. · year 1
- Rental income
- $14,653
- − Mortgage interest
- −$6,492
- − Property taxes
- −$548
- − Insurance
- −$1,377
- − Repairs & maintenance
- −$1,172
- − Management
- −$1,172
- − Depreciation
- −$3,372
- Taxable income
- $520
- Est. tax owed @ 24.0%
- −$125
- After-tax cash flow
- $2,233/yr
For passive investors: Depreciation is non-cash, so a rental often shows a tax loss while cash-flowing — sheltering income. Rental losses are passive: they offset passive income freely, and up to $25,000/yr can offset ordinary (W-2) income if you actively participate and your MAGI is under $100k (phasing out to $0 by $150k); unused losses carry forward. On sale, claimed depreciation is recaptured at up to 25%, and gains may owe capital-gains tax (a 1031 exchange can defer both). Figures are a year-1 estimate at your 24.0% rate — not tax advice; consult a CPA.
Schools (NCES district)
- District
- Weakley County
- NCES district ID
- 4704470
- Math proficiency
- 34% ▼ -10.00%
- Reading proficiency
- 38% ▼ -2.00%
- Median HH income
- $35,389
- Composite
- 29.77/100
- National rank
- #6434
- State rank
- #32 of 139 in TN
Livability — Martin
- Score
- 75/100
- State rank
- #15
- US rank
- #4330
Category grades
Schools grade is shown separately in the Schools card above.
Census & demographics
- Census place
- Martin, TN
- County
- Weakley County · 15,627 people
- City population
- 15,627
- Metro
- Martin, TN
- Population (ZIP)
- 15,627
- Household income
- $51,670
- Rent vs Own
- Severe rent burden
- 636.0
Population outlook (Weakley County) Hauer SSP2
- Today (2025)
- 31,862 people
- By 2030
- 30,688 · -3.7%
- By 2040
- 27,935 · -12.3%
- By 2050
- 25,485 · -20.0%
- By 2075
- 21,080 · -33.8%
- By 2100
- 18,214 · -42.8%
Race, ethnicity, and origin ACS 2023
- Neighborhood character
- Predominantly White (77%)
- Race & ethnicity
- White 77% Black 13% Two or more races 5% Hispanic / Latino 4% Asian 2%
- Common ancestry
- Slovak 2% Italian 1% Serbian 1%
- Foreign-born
- 4% · Canada, Vietnam, South Korea
- Languages at home
- 95% English-only · Spanish 2% Vietnamese 1% Other Indo-European 1%
Political lean MEDSL · Weakley
- 2024 margin
- Solid R (+58.4) · D 20.3% · R 78.7%
- 2008→2024 swing
- -27.2pp toward R · 2008: -31.1pp · 2024: -58.4pp
- All cycles
- 2024: R+58.4 2020: R+53.7 2016: R+51.4 2012: R+41.0 2008: R+31.1
Not yet ingested
- Civics
- —
Market trends
- HPI YoY
- ▼ -46.05%
- Current HPI
- 233.76
- Rent YoY
- —
- Metro
- Martin, TN
- State GDP YoY
- ▲ 2.78%
- F500 in state
- 22
Industry mix (Fortune 500 HQ in TN)
| Industry | F500 HQs | Revenue |
|---|---|---|
| Healthcare | 3 | $91B |
|
||
| Retail | 3 | $72B |
|
||
| Transportation / Logistics | 1 | $88B |
|
||
| Paper / Packaging | 1 | $19B |
|
||
| Insurance | 1 | $13B |
|
||
| Energy | 1 | $12B |
|
||
Price history
+286.3% since first listed8 events — show timeline
- 2026-04-13 Pending — RRAR as distributed by MLS GRID
- 2026-02-12 Price Changed $115,900 RRAR as distributed by MLS GRID
- 2026-01-27 Price Changed $124,900 RRAR as distributed by MLS GRID
- 2026-01-27 Listed $124,900,000 RRAR as distributed by MLS GRID
- 2024-10-01 Price Changed $140,000 CWTAR
- 2016-10-17 Sold (Public Records) $50,000 Public Records
- 2011-08-03 Sold (Public Records) $52,750 Public Records
- 2000-08-18 Sold (Public Records) $30,000 Public Records
Property tax history
+1.5%/yrLatest (2025): $548 · +9.2% YoY. Source: county tax records.
Cash-flow waterfall
monthlySold comps — $/sqft
last 12 mo · ≤1 miLoading sold comps…