 🌊 Lakefront
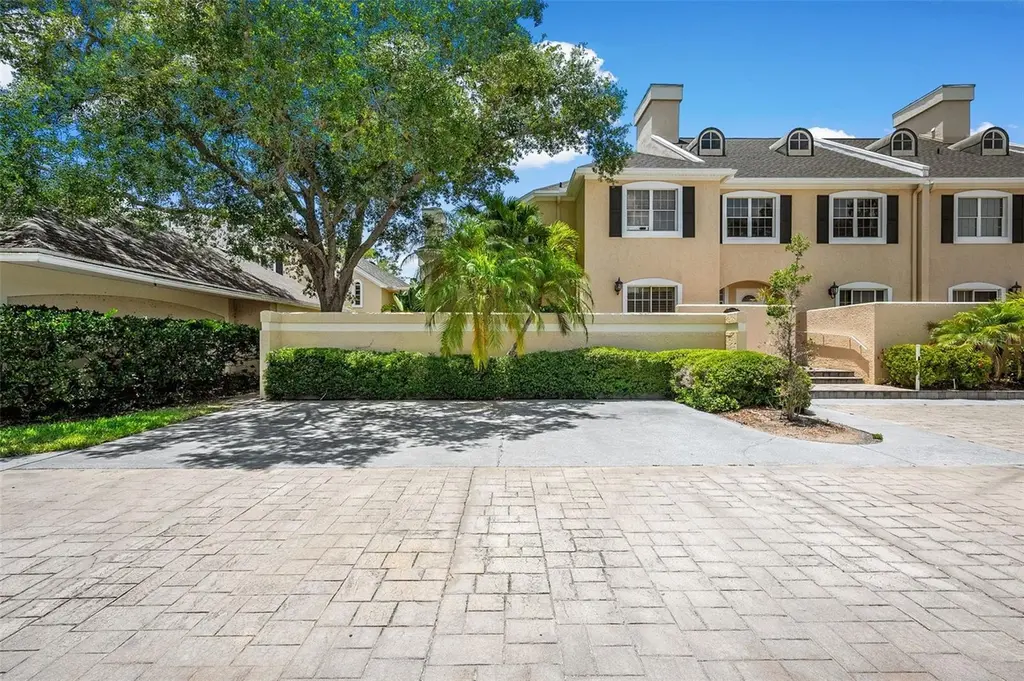
13770 Marseilles Ct · Feather Sound, FL
Flood risk 9/10 · Severe
- FEMA flood zone
- AE
- Chance of flooding over 30 yrs
- 0.99%
- Est. flood insurance / yr
- $1,737 – $8,500
Fire risk 4/10 · Minor
- Est. fire insurance / yr
- $947 – $1,759
Heat risk 10/10 · Severe
- Hot days now (above 107°F)
- 7 days/yr
- Hot days in 30 yrs
- 29 days/yr
Wind risk 10/10 · Severe
- Chance of severe wind over 30 yrs
- 99.0%
Air-quality risk 3/10 · Minor
- Unhealthy air days now
- 3 days/yr
- Unhealthy air days in 30 yrs
- 3 days/yr
Risk factors via First Street. Map © Google.
Why this score? — see what drove the C- grade
The composite is a weighted blend of 9 inputs, each scored 0–100. Each bar is that input's sub-score; the figure is the points it added to the 100-point composite (weight × sub-score).
- Cash flow +15.1/30.0
- ARV discount +15.0/15.0
- 1% rule +5.0/10.0
- DSCR +4.6/10.0
- Schools +4.3/10.0
- Livability +3.8/5.0
- Condition / age +2.5/5.0
- Rent growth +2.2/5.0
- Appreciation +0.0/10.0
$399,999
🖨 Deal sheet (PDF) 📄 Offer letter ✓ Due diligence
Listing remarks MLS
Enjoy maintenance free living in this beautifully maintained 3 bedroom 3 bath end unit townhome with pond views in Lake Point Villas/Feather Sound. You will immediately recognize the pride of ownership the minute you enter the townhome . The lower level offers vaulted ceilings, incredible great room with wood burning fireplace, dining area, kitchen, bedroom and full bath. Upstairs you are invited to the master suite and master bath which has a walk-in closet, separate shower, and jacuzzi garden tub. The second bedroom located upstairs also has its on full bath. Community is minutes away from Tampa/St. Petersburg airports, downtown Tampa and St. Petersburg and the Gulf beaches.
Key facts
- $460 HOA
- 2 garage spots
- Community pool
Property features AI
Finance
- Other: Homestead exemption applied; Zoning: RPD-10
- Financial info: Total monthly fees $460; total annual fees $5,520; Lease restrictions apply
- HOA & community: Monthly HOA $460 (Proactive Protective Management); HOA fees cover cable TV, common area taxes, pool, escrow reserves, structure maintenance, grounds maintenance, sewer, trash and water; Association approval required; Pets allowed; Community amenities include golf, pool, and sidewalks
Exterior
- Parking: 2-car garage with garage door opener
- Security: Smoke detectors
- Utilities: Public water; Public sewer; Public utilities
- Home design: Residential townhouse; Two stories; East-facing; Corner unit
- Construction: Block and concrete construction; Shingle roof; Slab foundation; Built as part of building number 13770
- Exterior features: Covered rear porch with screened area; Located on a cul-de-sac; Near golf course; Sidewalks; Pond view
Interior
- Kitchen: Dishwasher; Disposal; Microwave; Range; Refrigerator
- Bedrooms: 3 bedrooms
- Flooring: Ceramic tile
- Bathrooms: 3 full bathrooms
- Heating & cooling: Central heating; Central air
- Interior features: Ceiling fans; Open floorplan; Thermostat; Vaulted ceilings; Wood-burning fireplace
- Laundry & utility: Washer; Dryer; Inside laundry in a laundry closet; Electric water heater; Water softener
Neighborhood map
What this means for you Summary
Snapshot
- This is a 3-bed/3.0-bath townhouse listed at $400k.
Deal economics
- At list price, monthly cash flow is $-296 ($-4k/yr) — negative.
- To cash-flow at today's rent, offer at most $348k (13.1% below list).
- Meets the 1% rule at list price ($4k rent vs $400k).
- Recommended offer: $348k (13.1% below list) — sets the bar for cash-flow.
- Cap rate 6.7% vs local median 1.8% in Feather Sound — top-decile yield for the area; either an underpriced asset or a hidden risk that comps aren't pricing in. Stress-test before assuming the spread holds.
Location & tenants
- Location reads 75/100 on livability (#259 in FL, #4,144 nationally) — a middle-class / working-renter tenant base. Strengths: crime A+, housing A+, commute B+; Watch: cost of living D, amenities F, health & safety F.
- Pinellas (suburban): math 51% / reading 51% proficiency, ranked #31 of 73 in FL (top 42%) — acceptable for families but not a draw, mixed tenant base, ~2y average lease.
- Zoned schools: High Point Elementary School (math 54% / reading 48%, grade C-, #1,043 of 2,144 statewide, top 49%, 609 students, 80% FRL); Fitzgerald Middle School (math 50% / reading 47%, grade C-, #274 of 571 statewide, top 50%, 1,033 students, 62% FRL); Pinellas Park High School (math 28% / reading 35%, grade F, #424 of 667 statewide, top 64%, 1,919 students, 57% FRL) — zoned schools average 66% FRL vs 48% district-wide (18 pts higher); higher-poverty schools than district average — tighter screening recommended.
- Market conditions: Rents soft (-1.1%/yr); 102 active listings in the ZIP; 11 comparable units currently listed for rent nearby; rentals leasing fast (median 5d on market — plan ~1-2 weeks tenant-placement turnaround); solid renter incomes; 2,676 units permitted in Pinellas County in 2024 (1,422 in 5+ unit buildings).
- At $4,013/mo this rent would consume 55% of the median local household income ($87k/yr) (locally 105% of renters already pay >50% of income on rent) — very limited rent-growth headroom before tenants either downsize or default.
Forward outlook
- Local home prices are declining (-3.0%/yr); year-one equity from $3k of loan paydown is wiped out by about $12k of value loss. Plan a longer hold.
- Pinellas County population projected at +14% by 2050 — modest demand growth; plan on rents tracking national, not racing it.
Negotiation context
- Only 9 days on market — expect competitive offers; lowballing is unlikely to land.
- 2 sale attempts since 12y ago with the ask held roughly flat each time — persistent listings suggest the price (not the market) is what's stuck; bring a comps-based counter.
- Current owner paid $260k; list at $400k implies a 54% gain — meaningful room to come down on a strong offer.
Risks & watch-outs
- Watch-outs: flood insurance adds $427/mo.
- Climate carrying-cost: in FEMA flood zone AE (mandatory federal flood insurance); severe wind risk, 99% chance of damaging wind over 30y; extreme-heat days projected 7→29/yr by 2055 (HVAC capex compounding) — expect insurance premiums to compound above CPI over the hold.
Questions for the listing agent
- What do current leases actually rent for vs. the listed asking? Can we see a recent rent roll and the last 12 months of T-12 income?
- What's the actual annual flood-insurance premium (NFIP or private), and is the property in a SFHA with mandatory coverage?
- What does the HOA fee cover, when was the last increase, and are there any pending special assessments or reserve-fund shortfalls?
- Is there a deadline driving the sale (1031 exchange, divorce, estate, relocation)? That informs how much negotiation room exists.
- Schools are B-rated — typically a magnet for longer-tenancy family renters. What's the average tenant stay here, and is there a school-zone premium baked into asking?
- This sits on a lake — are riparian / water-frontage rights deeded with the parcel? Any dock permits, shoreline easements, or HOA water-use restrictions?
- What's the documented flood / surge / shoreline-erosion history here (FEMA AND non-FEMA — e.g., storm surge, creek backup, septic-field saturation)?
- Any water-quality or seasonal algae-bloom issues that affect tenant satisfaction or short-term-rental demand?
- What's the average days-on-market for RENTAL listings here right now (not sales)? A rising rental-DOM trend means longer vacancies and softer asking-rent achievability than the comps imply.
- What's the recent tenant-quality profile in this submarket — average credit score on applications, eviction rate, late-payment / NSF rate, and stable-employment percentage? A property-management company in the area should have these aggregated.
- How much new for-sale + rental construction is in the pipeline within 1–3 miles? Heavy new supply typically softens prices + rents 12–24 months out; constrained supply supports both.
Investment metrics
- 1% rule
- 1.00% ✓
- Cap rate
- 6.68%
- Cash-on-cash
- 1.40%
- DSCR
- 1.06
- GRM
- 8.3
CMA / ARV
- ARV (on-the-fly)
- $562,152
- Comps found
- 3
Show comp detail 3 sales within ~0.75 mi
| Address | Dist | Beds/Ba | Sqft | Sold | Price | $/sf | Match |
|---|---|---|---|---|---|---|---|
| 13794 Marseilles Ct Unit na | 0.04mi | 2/2.5 (-1) | 1,665 (-5%) | 7mo | $395,000 | $237 | 77 |
| 13754 Marseilles Ct | 0.01mi | 3/2.5 | 1,725 (-2%) | 21mo | $475,000 | $275 | 77 |
| 13636 Lake Point Dr S | 0.09mi | 2/2.0 (-1) | 1,875 (+7%) | 7mo | $360,000 | $192 | 70 |
Match score weights: distance 35% · size 25% · config 20% · recency 20%. Top-matched comps best support the ARV.
Projected returns pro-forma
-3.0% appreciation · 0.0% rent growth · sell at horizon
- IRR
- -25.8%
- Equity multiple
- 0.15×
- Total profit
- $-94,937
- Equity at exit
- $59,641
- IRR
- -42.4%
- Equity multiple
- -0.34×
- Total profit
- $-150,393
- Equity at exit
- $34,585
Cash invested: $112,000 (down + closing). Projections, not guarantees.
Landlord ↔ Tenant lean methodology
- Overall (STATE)
- 87 Strongly Landlord-Friendly
- State Florida
- 87 Strongly Landlord-Friendly · R+3
- County
- — inherits STATE
- City
- — inherits STATE
ZIP-level market 33762
- Rents YoY
- -1.1%
- Active inventory
- 102
- Price-to-rent
- 8.3×
Monthly cashflow live
- Estimated rent
- $4,013 high interval (Pro) →
- Mortgage (P&I)
- −$2,098
- Tax from tax record
- −$315 /mo · $3,783/yr
- Insurance
- −$167
- Flood insurance flood zone
- −$427 /mo · $5,118/yr
- HOA
- −$460
- Vacancy / Maint / Mgmt
- −$843
- Net cashflow
- $-296
Break-even live
Sensitivity live
| Price | -10% $-70 | -5% $-183 | +0% $-296 | +5% $-409 | +10% $-522 |
|---|---|---|---|---|---|
| Rent | -10% $-613 | -5% $-454 | +0% $-296 | +5% $-137 | +10% $21 |
| Rate | -1.0pp $-95 | -0.5pp $-194 | base $-296 | +0.5pp $-400 | +1.0pp $-505 |
UW: 25.0% down · 7.5% · 30yr · 1.5% tax · 5.0% vac · 8.0% maint · 8.0% mgmt
Financing live
Cash to close
- Down payment
- $100,000
- Closing costs
- $12,000
- Reserves months
- —
- Total cash needed
- —
Loan-product check · same deal, 3 products live
Conventional
25% down · 7.5% · 30yr
- Down + closing
- —
- Monthly P&I
- —
- Monthly cashflow
- —
- DSCR
- —
- Eligible?
- —
Personal DTI + credit; lowest rate.
DSCR
20% down · 8.5% · 30yr
- Down + closing
- —
- Monthly P&I
- —
- Monthly cashflow
- —
- DSCR
- —
- Eligible?
- —
No personal income docs; deal must DSCR.
Hard money
10% down · 12.0% · 12mo
- Down + closing
- —
- Monthly P&I
- —
- Monthly cashflow
- —
- DSCR
- —
- Eligible?
- —
Short-term bridge; refi at stabilization.
Rent comps 11 comps
| Address | Beds | Baths | Sqft | Rent | $/sqft | DOM | Units | Dist |
|---|---|---|---|---|---|---|---|---|
| 104 Main St N St. Petersburg, FL | 2.0 | 2.0 | 1570 | $5,546 | $3.53 | 0d | 1 | 0.48mi |
| 101 Main St N St. Petersburg, FL | 1.0–3.0 | 1.0–2.0 | 1494 | $7,813 | $5.23 | 18d | 70 | 0.50mi |
| 2400 Feather Sound Dr Clearwater, FL | 2.0–3.0 | 2.0–2.5 | 1165 | $2,725 | $2.34 | 26d | 4 | 0.55mi |
| 221 Main St N Saint Petersburg, FL | 1.0–3.0 | 1.0–3.0 | 1483 | $8,328 | $5.62 | 5d | 20 | 0.55mi |
| 14810 Rue De Bayonne Unit 14810 Clearwater, FL | 2.0 | 2.0 | 1275 | $1,895 | $1.49 | 4d | 1 | 0.66mi |
| 14810 Rue de Bayonne Unit 3H Clearwater, FL | 2.0 | 2.0 | 1330 | $2,900 | $2.18 | 12d | 1 | 0.66mi |
| 14463 Sandpiper Cir Clearwater, FL | 3.0 | 2.5 | 2250 | $4,100 | $1.82 | 0d | 1 | 0.70mi |
| 430 Gilman Pl N Saint Petersburg, FL | 3.0 | 3.5 | 2397 | $6,500 | $2.71 | 26d | 1 | 0.73mi |
| 540 Carillon Pkwy St Petersburg, FL | 1.0–3.0 | 1.0–2.0 | 1019 | $2,666 | $2.62 | 0d | 29 | 1.00mi |
| 500 Trinity Ln N Saint Petersburg, FL | 3.0 | 1.0–2.0 | 1103 | $3,258 | $2.95 | 0d | 26 | 1.12mi |
| 11850 Dr Martin Luther King Jr St N Saint Petersburg, FL | 1.0–3.0 | 1.0–2.0 | 1118 | $2,609 | $2.33 | 3d | 63 | 1.38mi |
HOA detail
- Monthly dues
- $460 · $5,520/yr
Listing history 7 events
-
2026-06-22days on market $399,999 Active 9 DOM
-
2026-06-18days on market $399,999 Active 6 DOM
-
2026-06-17days on market $399,999 Active 5 DOM
-
2026-06-16days on market $399,999 Active 4 DOM
-
2026-06-15days on market $399,999 Active 3 DOM
-
2026-06-13remarks 695-char remark
-
2026-06-13$399,999 Active 1 DOM
ⓘ Source: listings_history table (triggers on properties + properties_extension) + one-shot
backfill from property_details.listing_events for pre-trigger history.
Tax reassessment forecast FL · Resets to sale price
- Current annual tax
- $3,783 · $315/mo
- Projected year-2 tax
- $3,783 · $315/mo
- Expected delta
- $0/yr ($0/mo · 0.0%)
ⓘ Screening estimate from a state-policy table — verify with the county assessor before closing.
Climate risk First Street
- Flood 9/10 Extreme FEMA zone AE · 99% chance over 30 yrs
- Wildfire 4/10 Moderate
- Heat 10/10 Extreme 7 d/yr ≥107°F today · 29 d/yr by 30 yrs out
- Wind 10/10 Extreme 99% chance of damaging wind over 30 yrs
- Air quality 3/10 Moderate 3 unhealthy d/yr today · 3 by 30 yrs out
Nearby sold comps map
Loading sold comps map…
Walkable amenities ~0.75 mi
Loading nearby amenities…
Taxation est. · year 1
- Rental income
- $48,154
- − Mortgage interest
- −$22,406
- − Property taxes
- −$3,783
- − Insurance
- −$7,118
- − Repairs & maintenance
- −$3,852
- − Management
- −$3,852
- − HOA
- −$5,520
- − Depreciation
- −$11,636
- Taxable loss
- −$10,015
- Est. tax savings @ 24.0%
- +$2,404
- After-tax cash flow
- $-1,148/yr
For passive investors: Depreciation is non-cash, so a rental often shows a tax loss while cash-flowing — sheltering income. Rental losses are passive: they offset passive income freely, and up to $25,000/yr can offset ordinary (W-2) income if you actively participate and your MAGI is under $100k (phasing out to $0 by $150k); unused losses carry forward. On sale, claimed depreciation is recaptured at up to 25%, and gains may owe capital-gains tax (a 1031 exchange can defer both). Figures are a year-1 estimate at your 24.0% rate — not tax advice; consult a CPA.
Schools (NCES district)
- District
- Pinellas
- NCES district ID
- 1201560
- Math proficiency
- 51% ▼ -5.00%
- Reading proficiency
- 51% ▼ -3.00%
- Median HH income
- $46,270
- Composite
- 43.27/100
- National rank
- #3046
- State rank
- #31 of 73 in FL
Livability — Feather Sound
- Score
- 75/100
- State rank
- #259
- US rank
- #4144
Category grades
Schools grade is shown separately in the Schools card above.
Census & demographics
- Census place
- Feather Sound, FL
- County
- Pinellas County · 939,478 people
- City population
- 5,039
- Metro
- Tampa-St. Petersburg-Clearwater, FL
- Population (ZIP)
- 5,063
- Household income
- $87,461
- Rent vs Own
- Severe rent burden
- 105.0
Population outlook (Pinellas County) Hauer SSP2
- Today (2025)
- 1,027,532 people
- By 2030
- 1,063,586 · +3.5%
- By 2040
- 1,125,020 · +9.5%
- By 2050
- 1,168,637 · +13.7%
- By 2075
- 1,265,188 · +23.1%
- By 2100
- 1,260,357 · +22.7%
Race, ethnicity, and origin ACS 2023
- Neighborhood character
- Predominantly White (76%)
- Race & ethnicity
- White 76% Two or more races 11% Hispanic / Latino 10% Asian 5% Black 5%
- Hispanic origin (detail)
- Puerto Rican 1% Cuban 2%
- Common ancestry
- Italian 5% Romanian 4% Serbian 2%
- Foreign-born
- 10% · Canada, Jamaica, South Korea
- Languages at home
- 83% English-only · Other Indo-European 6% Spanish 6% French/Haitian/Cajun 1%
Political lean MEDSL · Pinellas
- 2024 margin
- Lean R (+5.2) · D 46.9% · R 52.1%
- 2008→2024 swing
- -13.5pp toward R · 2008: 8.3pp · 2024: -5.2pp
- All cycles
- 2024: R+5.2 2020: D+0.2 2016: R+1.1 2012: D+5.6 2008: D+8.3
Not yet ingested
- Civics
- —
Market trends
- HPI YoY
- ▼ -212.83%
- Current HPI
- 264.2599
- Rent YoY
- ▼ -1.11%
- Metro
- Tampa-St. Petersburg-Clearwater, FL
- State GDP YoY
- ▲ 3.28%
- F500 in state
- 36
Industry mix (Fortune 500 HQ in FL)
| Industry | F500 HQs | Revenue |
|---|---|---|
| Industrial Technology | 2 | $29B |
|
||
| Insurance | 2 | $17B |
|
||
| Retail | 1 | $60B |
|
||
| Technology Distribution | 1 | $58B |
|
||
| Homebuilding | 1 | $35B |
|
||
| Technology Manufacturing | 1 | $35B |
|
||
Price history
+207.7% since first listed10 events — show timeline
- 2026-06-12 Listed $399,999 Stellar MLS as Distributed by MLS Grid
- 2014-09-25 Sold (Public Records) $260,000 Public Records
- 2014-09-24 Sold (MLS) $260,000 Stellar MLS as Distributed by MLS Grid
- 2014-08-06 Pending — Stellar MLS as Distributed by MLS Grid
- 2014-07-31 Listed $264,500 Stellar MLS as Distributed by MLS Grid
- 2013-03-22 Sold (Public Records) $230,000 Public Records
- 2002-11-26 Sold (Public Records) $208,000 Public Records
- 1999-05-06 Sold (Public Records) $174,500 Public Records
- 1997-06-25 Sold (Public Records) $161,000 Public Records
- 1987-10-06 Sold (Public Records) $130,000 Public Records
Property tax history
-0.9%/yrLatest (2025): $3,783 · +5.8% YoY. Source: county tax records.
Cash-flow waterfall
monthlySold comps — $/sqft
last 12 mo · ≤1 miLoading sold comps…