1509 Douglas Dr · Iowa Park, TX
Flood risk No data
- FEMA flood zone
- —
- Chance of flooding over 30 yrs
- —
- Est. flood insurance / yr
- —
Fire risk No data
- Est. fire insurance / yr
- —
Heat risk No data
- Hot days now (above threshold)
- —
- Hot days in 30 yrs
- —
Wind risk No data
- Chance of severe wind over 30 yrs
- —
Air-quality risk No data
- Unhealthy air days now
- —
- Unhealthy air days in 30 yrs
- —
Risk factors via First Street. Map © Google.
Why this score? — see what drove the C- grade
The composite is a weighted blend of 9 inputs, each scored 0–100. Each bar is that input's sub-score; the figure is the points it added to the 100-point composite (weight × sub-score).
- Cash flow +12.2/30.0
- Appreciation +10.0/10.0
- ARV discount +7.5/15.0
- Schools +4.6/10.0
- 1% rule +3.7/10.0
- DSCR +3.6/10.0
- Livability +3.6/5.0
- Rent growth +2.5/5.0
- Condition / age +2.5/5.0
$179,900
🖨 Deal sheet 📄 Offer letter ✓ Due diligence
Listing remarks MLS
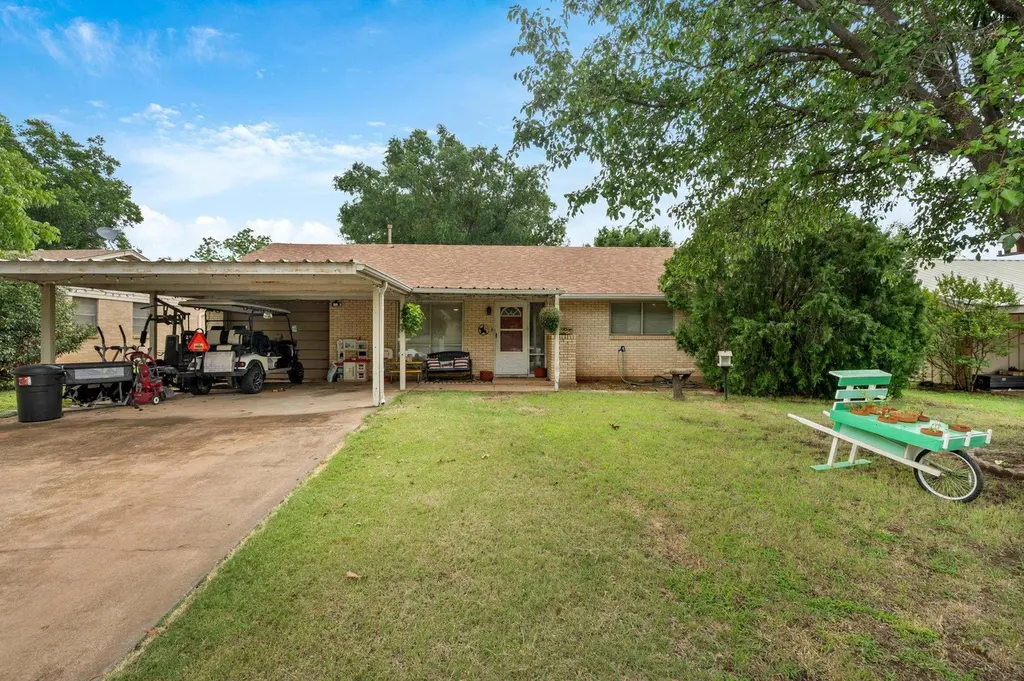
Cute home with spacious living room and dining room. The kitchen is delightfully colorful with bright turquoise cabinets with silver back splash and stainless steel dishwasher and popular farmer style sink. There is a one car garage and two car carport. The backyard is spacious with large tree and cyclone fence. There is an area to park vehicles or boat from the alley. An outbuilding available for lawn mower and such. The owner is offering a home warranty at closing. Don't miss seeing this home.
Key facts
- Soft-close cabinets
- Granite countertops
- Garage
Tags
Property features AI
Exterior
- Parking: Garage with automatic door opener
- Utilities: Public water; Public sewer
- Home design: Single-family residence; One story; Faces west
- Construction: Brick construction; Slab foundation
- Exterior features: Fenced yard; Composition roof
Interior
- Kitchen: Dishwasher; Disposal; Oven; Range; Microwave
- Flooring: Carpet; Laminate
- Heating & cooling: Central heating (electric); Central air conditioning
- Interior features: Storm windows; Carpet and laminate flooring
Neighborhood map
What this means for you Summary
Snapshot
- This is a 3-bed/2.0-bath single-family listed at $180k.
Deal economics
- At list price, monthly cash flow is $-37 ($-443/yr) — negative.
- To cash-flow at today's rent, offer at most $173k (3.6% below list).
- To meet the 1% rule (rent ≥ 1% of price), the offer needs to be $157k (12.7% below list).
- Recommended offer: $157k (12.7% below list) — sets the bar for 1% rule.
Location & tenants
- Location reads 72/100 on livability (#272 in TX) — a middle-class / working-renter tenant base. Strengths: crime A+, cost of living A+, housing A+; Watch: health & safety C-, amenities F, commute F.
- Iowa Park CISD (town): math 57% / reading 49% proficiency, ranked #129 of 826 in TX (top 16%) — acceptable for families but not a draw, mixed tenant base, ~2y average lease.
- Zoned schools: Bradford El (math 58% / reading 51%, grade C, #621 of 4,322 statewide, top 15%, 447 students, 46% FRL); Iowa Park Jjaep (1 students, 0% FRL); Iowa Park H S (math 72% / reading 67%, grade B, #119 of 1,632 statewide, top 9%, 544 students, 34% FRL).
- Market conditions: 63 active listings in the ZIP; 2 comparable units currently listed for rent nearby; 231 units permitted in Wichita County in 2024 (10 in 5+ unit buildings).
Forward outlook
- In year one you build about $19k of equity ($1k loan paydown + $18k appreciation (10.0% local appreciation)).
- Wichita County population projected to shrink 7% by 2050 — rents likely to lag national; underwrite the cash flow, not the appreciation.
- At projected returns (10.0% appreciation + 3.0% rent growth), your $50k cash investment doubles in ~3 years — after that, you're playing with house money.
- By year 2, paydown + projected appreciation supports a ~$31k cash-out refi (75% LTV) — recoverable capital for the next deal without selling this one.
Negotiation context
- It's been on market 21 days — a 2% lower offer ($177k) is reasonable based on typical stale-listing flexibility.
- 2 sale attempts since 8y ago with the ask held roughly flat each time — persistent listings suggest the price (not the market) is what's stuck; bring a comps-based counter.
Questions for the listing agent
- What do current leases actually rent for vs. the listed asking? Can we see a recent rent roll and the last 12 months of T-12 income?
- Built in 1965 — when were the roof, HVAC, electrical panel, plumbing, and water heater last replaced?
- Is there a deadline driving the sale (1031 exchange, divorce, estate, relocation)? That informs how much negotiation room exists.
- What's the average days-on-market for RENTAL listings here right now (not sales)? A rising rental-DOM trend means longer vacancies and softer asking-rent achievability than the comps imply.
- What's the recent tenant-quality profile in this submarket — average credit score on applications, eviction rate, late-payment / NSF rate, and stable-employment percentage? A property-management company in the area should have these aggregated.
- How much new for-sale + rental construction is in the pipeline within 1–3 miles? Heavy new supply typically softens prices + rents 12–24 months out; constrained supply supports both.
Investment metrics
- 1% rule
- 0.87% ✗
- Cap rate
- 6.05%
- Cash-on-cash
- -0.88%
- DSCR
- 0.96
- GRM
- 9.5
CMA / ARV
No comps found within radius.
Projected returns pro-forma
10.0% appreciation · 3.0% rent growth · sell at horizon
- IRR
- 23.7%
- Equity multiple
- 2.90×
- Total profit
- $95,674
- Equity at exit
- $162,068
- IRR
- 21.0%
- Equity multiple
- 6.63×
- Total profit
- $283,682
- Equity at exit
- $349,506
Cash invested: $50,372 (down + closing). Projections, not guarantees.
Landlord ↔ Tenant lean methodology
- Overall (STATE)
- 87 Strongly Landlord-Friendly
- State Texas
- 87 Strongly Landlord-Friendly · R+5
- County
- — inherits STATE
- City
- — inherits STATE
ZIP-level market 76367
- Home prices YoY
- 6.7%
- Active inventory
- 63
- Price-to-rent
- 9.5×
Monthly cashflow live
- Estimated rent
- $1,571 medium interval (Pro) →
- Mortgage (P&I)
- −$943
- Tax from tax record
- −$260 /mo · $3,118/yr
- Insurance
- −$75
- HOA
- −$0
- Vacancy / Maint / Mgmt
- −$330
- Net cashflow
- $-37
Break-even live
UW: 25.0% down · 7.5% · 30yr · 1.5% tax · 5.0% vac · 8.0% maint · 8.0% mgmt
Financing live
Cash to close
- Down payment
- $44,975
- Closing costs
- $5,397
- Reserves months
- —
- Total cash needed
- —
Loan-product check · same deal, 3 products live
Conventional
25% down · 7.5% · 30yr
- Down + closing
- —
- Monthly P&I
- —
- Monthly cashflow
- —
- DSCR
- —
- Eligible?
- —
Personal DTI + credit; lowest rate.
DSCR
20% down · 8.5% · 30yr
- Down + closing
- —
- Monthly P&I
- —
- Monthly cashflow
- —
- DSCR
- —
- Eligible?
- —
No personal income docs; deal must DSCR.
Hard money
10% down · 12.0% · 12mo
- Down + closing
- —
- Monthly P&I
- —
- Monthly cashflow
- —
- DSCR
- —
- Eligible?
- —
Short-term bridge; refi at stabilization.
Rent comps 2 comps
| Address | Beds | Baths | Sqft | Rent | $/sqft | DOM | Units | Dist |
|---|---|---|---|---|---|---|---|---|
| 909 Van Horn St Iowa Park, TX | 3.0 | 2.0 | 1677 | $1,645 | $0.98 | 43d | 1 | 0.58mi |
| 706 W Louisa Ave Iowa Park, TX | 3.0 | 1.5 | 1144 | $1,500 | $1.31 | 43d | 1 | 0.68mi |
Listing history 21 events
-
2026-06-19days on market $179,900 Active 21 DOM
-
2026-06-18days on market $179,900 Active 20 DOM
-
2026-06-17days on market $179,900 Active 19 DOM
-
2026-06-16days on market $179,900 Active 18 DOM
-
2026-06-15days on market $179,900 Active 17 DOM
-
2026-06-14days on market $179,900 Active 15 DOM
-
2026-06-13days on market $179,900 Active 14 DOM
-
2026-06-10days on market $179,900 Active 12 DOM
-
2026-06-09days on market $179,900 Active 11 DOM
-
2026-06-08days on market $179,900 Active 10 DOM
-
2026-06-07days on market $179,900 Active 9 DOM
-
2026-06-03days on market $179,900 Active 5 DOM
-
2026-06-02days on market $179,900 Active 4 DOM
-
2026-06-01days on market $179,900 Active 3 DOM
-
2026-05-31days on market $179,900 Active 2 DOM
-
2026-05-29$179,900 Active
-
2018-07-16soldstatus
-
2018-07-12soldstatus 500-char remark
Show marketing remark (500 chars)
Cute home with spacious living room and dining room. The kitchen is delightfully colorful with bright turquoise cabinets with silver back splash and stainless steel dishwasher and popular farmer style sink. There is a one car garage and two car carport. The backyard is spacious with large tree and cyclone fence. There is an area to park vehicles or boat from the alley. An outbuilding available for lawn mower and such. The owner is offering a home warranty at closing. Don't miss seeing this home.
-
2018-05-31$88,900 500-char remark
Show marketing remark (500 chars)
Cute home with spacious living room and dining room. The kitchen is delightfully colorful with bright turquoise cabinets with silver back splash and stainless steel dishwasher and popular farmer style sink. There is a one car garage and two car carport. The backyard is spacious with large tree and cyclone fence. There is an area to park vehicles or boat from the alley. An outbuilding available for lawn mower and such. The owner is offering a home warranty at closing. Don't miss seeing this home.
-
2013-08-08soldstatus
-
2012-03-21soldstatus
ⓘ Source: listings_history table (triggers on properties + properties_extension) + one-shot
backfill from property_details.listing_events for pre-trigger history.
Tax reassessment forecast TX · Resets to sale price
- Current annual tax
- $3,118 · $260/mo
- Projected year-2 tax
- $3,292 · $274/mo
- Expected delta
- +$174/yr (+$15/mo · 5.6%)
ⓘ Screening estimate from a state-policy table — verify with the county assessor before closing.
Nearby sold comps map
Loading sold comps map…
Walkable amenities ~0.75 mi
Loading nearby amenities…
Taxation est. · year 1
- Rental income
- $18,856
- − Mortgage interest
- −$10,077
- − Property taxes
- −$3,118
- − Insurance
- −$900
- − Repairs & maintenance
- −$1,508
- − Management
- −$1,508
- − Depreciation
- −$5,233
- Taxable loss
- −$3,490
- Est. tax savings @ 24.0%
- +$837
- After-tax cash flow
- $395/yr
For passive investors: Depreciation is non-cash, so a rental often shows a tax loss while cash-flowing — sheltering income. Rental losses are passive: they offset passive income freely, and up to $25,000/yr can offset ordinary (W-2) income if you actively participate and your MAGI is under $100k (phasing out to $0 by $150k); unused losses carry forward. On sale, claimed depreciation is recaptured at up to 25%, and gains may owe capital-gains tax (a 1031 exchange can defer both). Figures are a year-1 estimate at your 24.0% rate — not tax advice; consult a CPA.
Schools (NCES district)
- District
- Iowa Park CISD
- NCES district ID
- 4824260
- Math proficiency
- 57% ▼ -1.00%
- Reading proficiency
- 49% ▼ -4.00%
- Median HH income
- $52,689
- Composite
- 45.57/100
- National rank
- #2597
- State rank
- #129 of 826 in TX
Livability — Iowa Park
- Score
- 72/100
- State rank
- #272
- US rank
- #6350
Category grades
Schools grade is shown separately in the Schools card above.
Census & demographics
- Census place
- Iowa Park, TX
- City population
- 14,013
- Population (ZIP)
- 14,013
Population outlook (Wichita County) Hauer SSP2
- Today (2025)
- 129,638 people
- By 2030
- 128,366 · -1.0%
- By 2040
- 124,466 · -4.0%
- By 2050
- 120,499 · -7.0%
- By 2075
- 113,884 · -12.2%
- By 2100
- 101,818 · -21.5%
Race, ethnicity, and origin ACS 2023
- Neighborhood character
- Predominantly White (70%)
- Race & ethnicity
- White 70% Hispanic / Latino 16% Black 10% Two or more races 8% Asian 1% Native American 1%
- Hispanic origin (detail)
- Mexican 13%
- Common ancestry
- Lithuanian 1% Portuguese 1% Slovak 1%
- Foreign-born
- 4% · Canada, Vietnam
- Languages at home
- 93% English-only · Spanish 6%
Political lean MEDSL · Wichita
- 2024 margin
- Solid R (+44.0) · D 27.5% · R 71.5%
- 2008→2024 swing
- -5.2pp toward R · 2008: -38.9pp · 2024: -44.0pp
- All cycles
- 2024: R+44.0 2020: R+41.1 2016: R+49.7 2012: R+47.1 2008: R+38.9
Not yet ingested
- Civics
- —
Market trends
- HPI YoY
- ▲ 24.29%
- Current HPI
- 387.78
- Rent YoY
- —
- Metro
- —
- State GDP YoY
- ▲ 3.95%
- F500 in state
- 110
Industry mix (Fortune 500 HQ in TX)
| Industry | F500 HQs | Revenue |
|---|---|---|
| Energy | 16 | $1,198B |
|
||
| Technology | 5 | $198B |
|
||
| Engineering / Construction | 4 | $72B |
|
||
| Energy Services | 3 | $60B |
|
||
| Utilities | 3 | $41B |
|
||
| Healthcare | 2 | $330B |
|
||
Price history
+102.4% since first listed6 events — show timeline
- 2026-05-29 Listed $179,900 WFAOR
- 2018-07-16 Sold (Public Records) — Public Records
- 2018-07-12 Sold (MLS) — WFAOR
- 2018-05-31 Listed $88,900 WFAOR
- 2013-08-08 Sold (Public Records) — Public Records
- 2012-03-21 Sold (Public Records) — Public Records
Property tax history
+6.1%/yrLatest (2022): $3,118 · +21.3% YoY. Source: county tax records.
Cash-flow waterfall
monthlySold comps — $/sqft
last 12 mo · ≤1 miLoading sold comps…