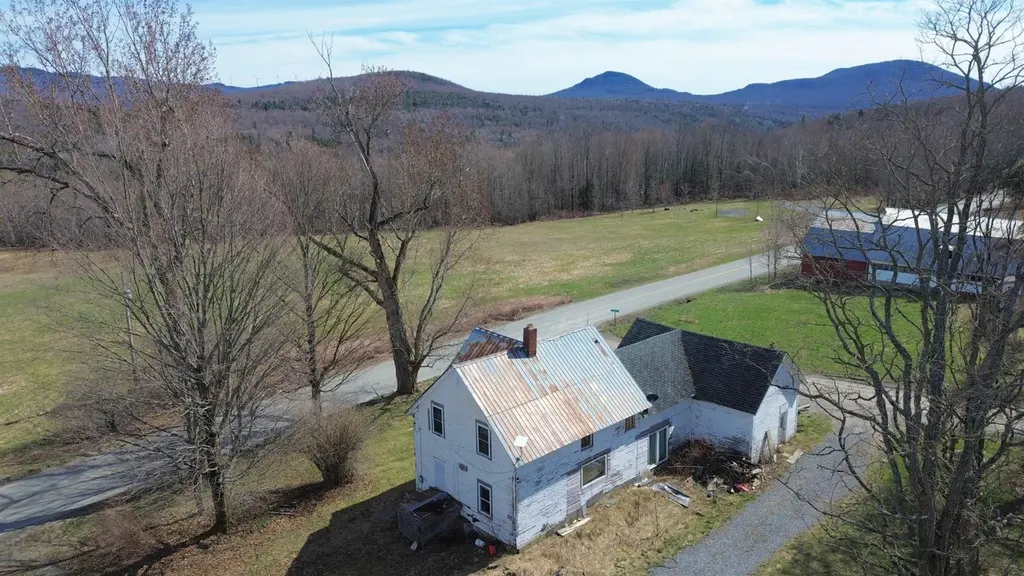
12 Baraw Rd · Lowell, VT
Flood risk 1/10 · Minimal
- FEMA flood zone
- X
- Chance of flooding over 30 yrs
- 0.0%
- Est. flood insurance / yr
- $473 – $860
Fire risk 1/10 · Minimal
- Est. fire insurance / yr
- $480 – $892
Heat risk 1/10 · Minimal
- Hot days now (above 86°F)
- 7 days/yr
- Hot days in 30 yrs
- 16 days/yr
Wind risk 2/10 · Minimal
- Chance of severe wind over 30 yrs
- 2.0%
Air-quality risk 2/10 · Minimal
- Unhealthy air days now
- 1 days/yr
- Unhealthy air days in 30 yrs
- 1 days/yr
Risk factors via First Street. Map © Google.
Why this score? — see what drove the C- grade
The composite is a weighted blend of 9 inputs, each scored 0–100. Each bar is that input's sub-score; the figure is the points it added to the 100-point composite (weight × sub-score).
- Cash flow +15.9/30.0
- ARV discount +7.5/15.0
- Appreciation +6.7/10.0
- Schools +5.0/10.0
- DSCR +4.9/10.0
- 1% rule +3.9/10.0
- Livability +2.9/5.0
- Rent growth +2.5/5.0
- Condition / age +2.5/5.0
$174,900
🖨 Deal sheet 📄 Offer letter ✓ Due diligence
Listing remarks
4-bedroom, 2-bath farmhouse situated on a 6.1 acre corner lot with private septic, power, and deeded rights to a neighboring spring. This home offers over 1,500 sq ft of living space and features a newly installed on-demand hot water system, along with a three-season porch and attached garage/workshop. The property is in need of rehab but offers strong potential as a primary residence, rental, or investment project. Also on site is a 20' x 38' partially completed kit home on a slab foundation (post and beam framing materials supplied by Jamaica Cottage Shop, located in Londonderry, VT. Features radiant heat (not connected), a buried cistern, loft, large east-facing windows, and a corrugated
Key facts
- Deeded rights
- Buried cistern
- Three-season porch
Tags
Property features AI
Exterior
- Parking: 1-car garage
- Utilities: Private water source (well); Private sewer; Electric: 100 Amp service with circuit breakers; VT Electric Co-op; High-speed internet available; Cable and telephone available
- Home design: Farmhouse style; White exterior; Existing structure
- Construction: Built in 1920; Wood frame with wood exterior; Roof: corrugated metal and asphalt shingles; Basement: partial, unfinished with concrete and dirt floor, exterior and interior access
- Exterior features: Corner lot in a country setting; Wooded lot; Near snowmobile trails; Dirt driveway; Easements present; Public maintained unpaved road frontage
Interior
- Bedrooms: Master bedroom (2nd level); Additional bedroom (2nd level)
- Flooring: Combination of hardwood, laminate, and wood flooring
- Bathrooms: Two full bathrooms (one on 1st level, one on 2nd level)
- Heating & cooling: Oil-fired forced air heating
- Interior features: 9 total rooms; Workshop; Living/Dining area; Porch
- Laundry & utility: Laundry room (1st level); Washer; Dryer; On-demand water heater
Neighborhood map
What this means for you Summary
Snapshot
- This is a 4-bed/2.0-bath other listed at $175k.
Deal economics
- At list price, monthly cash flow is $83 ($996/yr) — positive.
- The deal already cash-flows at list — no discount required.
- To meet the 1% rule (rent ≥ 1% of price), the offer needs to be $156k (10.8% below list).
- Recommended offer: $156k (10.8% below list) — sets the bar for 1% rule.
Location & tenants
- Location reads 58/100 on livability (#105 in VT) — a working-class tenant base; expect higher turnover. Strengths: cost of living A+, housing A+; Watch: employment C-, schools F, amenities F.
- Market conditions: 11 active listings in the ZIP; 157 units permitted in Orleans County in 2024 (107 in 5+ unit buildings).
Forward outlook
- In year one you build about $7k of equity ($1k loan paydown + $6k appreciation (3.4% local appreciation)).
- Orleans County population projected at -19% by 2050 — secular population decline; favor cash flow + early exit over multi-decade hold.
- At projected returns (3.4% appreciation + 3.0% rent growth), your $49k cash investment doubles in ~6 years — after that, you're playing with house money.
- By year 5, paydown + projected appreciation supports a ~$31k cash-out refi (75% LTV) — recoverable capital for the next deal without selling this one.
Negotiation context
- It's been on market 93 days — a 9% lower offer ($159k) is reasonable based on typical stale-listing flexibility.
- Current owner paid $129k; 36% above their basis — modest negotiation headroom, anchor on the comps not their cost.
Risks & watch-outs
- Watch-outs: built in 1920 — expect roof / HVAC / electrical / plumbing capex.
Questions for the listing agent
- It's been on market 93 days. Have you received any prior offers? Is the seller open to a 11% concession, seller financing, or rate buy-down credit?
- Built in 1920 — when were the roof, HVAC, electrical panel, plumbing, and water heater last replaced?
- Why hasn't it sold? Are there any deal-killer items the seller is aware of (foundation, flood, title, zoning, code violations)?
- Is there a deadline driving the sale (1031 exchange, divorce, estate, relocation)? That informs how much negotiation room exists.
- Schools are F-rated, which usually means shorter tenancies and higher turnover. Who's the typical renter profile here, and what's been the actual vacancy rate?
- What's the average days-on-market for RENTAL listings here right now (not sales)? A rising rental-DOM trend means longer vacancies and softer asking-rent achievability than the comps imply.
- What's the recent tenant-quality profile in this submarket — average credit score on applications, eviction rate, late-payment / NSF rate, and stable-employment percentage? A property-management company in the area should have these aggregated.
- How much new for-sale + rental construction is in the pipeline within 1–3 miles? Heavy new supply typically softens prices + rents 12–24 months out; constrained supply supports both.
Investment metrics
- 1% rule
- 0.89% ✗
- Cap rate
- 6.86%
- Cash-on-cash
- 2.03%
- DSCR
- 1.09
- GRM
- 9.3
CMA / ARV
No comps found within radius.
Projected returns pro-forma
3.38% appreciation · 3.0% rent growth · sell at horizon
- IRR
- 10.4%
- Equity multiple
- 1.61×
- Total profit
- $29,839
- Equity at exit
- $82,363
- IRR
- 12.5%
- Equity multiple
- 2.93×
- Total profit
- $94,559
- Equity at exit
- $129,902
Cash invested: $48,972 (down + closing). Projections, not guarantees.
Landlord ↔ Tenant lean methodology
- Overall (STATE)
- 41 Moderately Tenant-Leaning
- State Vermont
- 41 Moderately Tenant-Leaning · D+15
- County
- — inherits STATE
- City
- — inherits STATE
ZIP-level market 05847
- Home prices YoY
- 2.0%
- Active inventory
- 11
- Price-to-rent
- 9.3×
Monthly cashflow live
- Estimated rent
- $1,560 medium interval (Pro) →
- Mortgage (P&I)
- −$917
- Tax from tax record
- −$160 /mo · $1,914/yr
- Insurance
- −$73
- HOA
- −$0
- Vacancy / Maint / Mgmt
- −$328
- Net cashflow
- $83
Break-even live
UW: 25.0% down · 7.5% · 30yr · 1.5% tax · 5.0% vac · 8.0% maint · 8.0% mgmt
Financing live
Cash to close
- Down payment
- $43,725
- Closing costs
- $5,247
- Reserves months
- —
- Total cash needed
- —
Loan-product check · same deal, 3 products live
Conventional
25% down · 7.5% · 30yr
- Down + closing
- —
- Monthly P&I
- —
- Monthly cashflow
- —
- DSCR
- —
- Eligible?
- —
Personal DTI + credit; lowest rate.
DSCR
20% down · 8.5% · 30yr
- Down + closing
- —
- Monthly P&I
- —
- Monthly cashflow
- —
- DSCR
- —
- Eligible?
- —
No personal income docs; deal must DSCR.
Hard money
10% down · 12.0% · 12mo
- Down + closing
- —
- Monthly P&I
- —
- Monthly cashflow
- —
- DSCR
- —
- Eligible?
- —
Short-term bridge; refi at stabilization.
Listing history 18 events
-
2026-06-18days on market $174,900 Active 93 DOM
-
2026-06-17days on market $174,900 Active 92 DOM
-
2026-06-16days on market $174,900 Active 91 DOM
-
2026-06-15days on market $174,900 Active 90 DOM
-
2026-06-15days on market $174,900 Active 89 DOM
-
2026-06-13days on market $174,900 Active 88 DOM
-
2026-06-12days on market $174,900 Active 87 DOM
-
2026-06-09days on market $174,900 Active 84 DOM
-
2026-06-08days on market $174,900 Active 83 DOM
-
2026-06-08days on market $174,900 Active 82 DOM
-
2026-06-07days on market $174,900 Active 81 DOM
-
2026-06-05days on market $174,900 Active 80 DOM
-
2026-06-03days on market $174,900 Active 78 DOM
-
2026-06-02days on market $174,900 Active 77 DOM
-
2026-06-01days on market $174,900 Active 76 DOM
-
2026-05-31days on market $174,900 Active 75 DOM
-
2026-03-17$179,900 Active
-
2023-10-09soldstatus $129,000
ⓘ Source: listings_history table (triggers on properties + properties_extension) + one-shot
backfill from property_details.listing_events for pre-trigger history.
Tax reassessment forecast VT · Partial reset (capped growth)
- Current annual tax
- $1,914 · $160/mo
- Projected year-2 tax
- $2,619 · $218/mo
- Expected delta
- +$705/yr (+$59/mo · 36.8%)
ⓘ Screening estimate from a state-policy table — verify with the county assessor before closing.
Climate risk First Street
- Flood 1/10 Low FEMA zone X · 0% chance over 30 yrs
- Wildfire 1/10 Low
- Heat 1/10 Low 7 d/yr ≥86°F today · 16 d/yr by 30 yrs out
- Wind 2/10 Low 2% chance of damaging wind over 30 yrs
- Air quality 2/10 Low 1 unhealthy d/yr today · 1 by 30 yrs out
Nearby sold comps map
Loading sold comps map…
Walkable amenities ~0.75 mi
Loading nearby amenities…
Taxation est. · year 1
- Rental income
- $18,722
- − Mortgage interest
- −$9,797
- − Property taxes
- −$1,914
- − Insurance
- −$874
- − Repairs & maintenance
- −$1,498
- − Management
- −$1,498
- − Depreciation
- −$5,088
- Taxable loss
- −$1,947
- Est. tax savings @ 24.0%
- +$467
- After-tax cash flow
- $1,463/yr
For passive investors: Depreciation is non-cash, so a rental often shows a tax loss while cash-flowing — sheltering income. Rental losses are passive: they offset passive income freely, and up to $25,000/yr can offset ordinary (W-2) income if you actively participate and your MAGI is under $100k (phasing out to $0 by $150k); unused losses carry forward. On sale, claimed depreciation is recaptured at up to 25%, and gains may owe capital-gains tax (a 1031 exchange can defer both). Figures are a year-1 estimate at your 24.0% rate — not tax advice; consult a CPA.
Schools (NCES district)
No district data.
Livability — Lowell
- Score
- 58/100
- State rank
- #105
- US rank
- #21286
Category grades
Schools grade is shown separately in the Schools card above.
Census & demographics
- City population
- 1,154
- Population (ZIP)
- 1,154
Population outlook (Orleans County) Hauer SSP2
- Today (2025)
- 26,222 people
- By 2030
- 25,399 · -3.1%
- By 2040
- 23,350 · -11.0%
- By 2050
- 21,232 · -19.0%
- By 2075
- 16,543 · -36.9%
- By 2100
- 11,566 · -55.9%
Race, ethnicity, and origin ACS 2023
- Neighborhood character
- Predominantly White (93%)
- Race & ethnicity
- White 93% Two or more races 6% Hispanic / Latino 2%
- Common ancestry
- Lithuanian 8% Romanian 1% Italian 1%
- Foreign-born
- 1% · Canada
- Languages at home
- 95% English-only · Spanish 2% German/W. Germanic 2% French/Haitian/Cajun 1%
Political lean MEDSL · Orleans
- 2024 margin
- Toss-up / Even · D 47.8% · R 49.4% · Other 2.8%
- 2008→2024 swing
- -29.1pp toward R · 2008: 27.5pp · 2024: -1.6pp
- All cycles
- 2024: R+1.6 2020: D+4.5 2016: D+0.2 2012: D+24.2 2008: D+27.5
Not yet ingested
- Civics
- —
Market trends
- HPI YoY
- ▲ 3.38%
- Current HPI
- 173.8699
- Rent YoY
- —
- Metro
- —
- State GDP YoY
- —
- F500 in state
- 0
Price history
+39.5% since first listed2 events — show timeline
- 2026-03-17 Listed $179,900 PrimeMLS
- 2023-10-09 Sold (Public Records) $129,000 Public Records
Property tax history
+2.0%/yrLatest (2024): $1,914 · -0.3% YoY. Source: county tax records.
Cash-flow waterfall
monthlySold comps — $/sqft
last 12 mo · ≤1 miLoading sold comps…