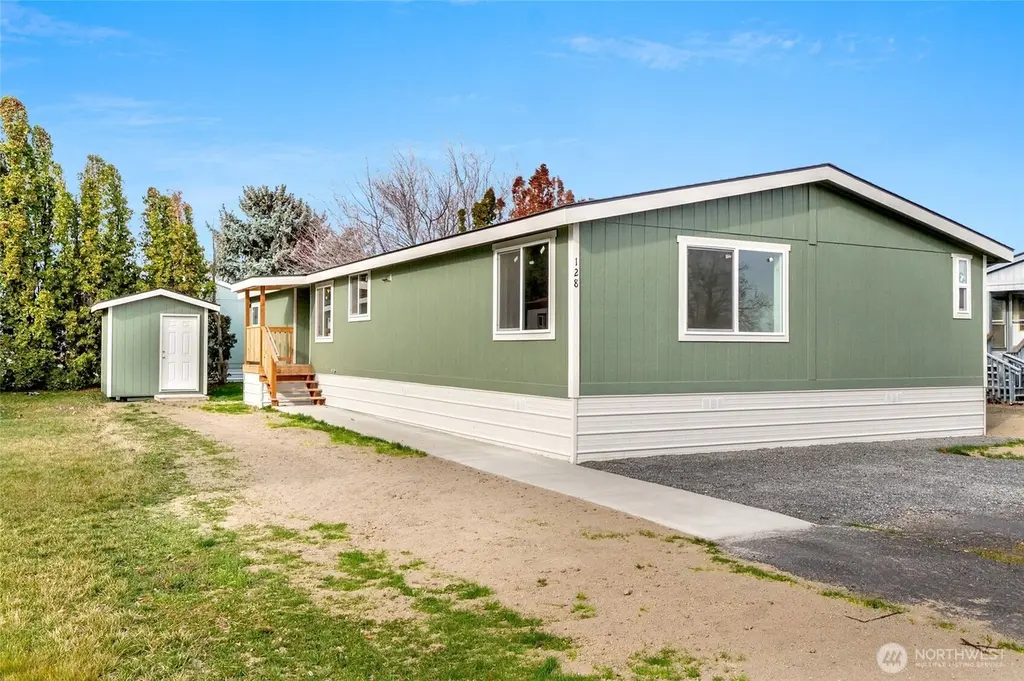
4815 NE Airway Dr #128 · Cascade Valley, WA
Flood risk 1/10 · Minimal
- FEMA flood zone
- X (unshaded)
- Chance of flooding over 30 yrs
- 0.0%
- Est. flood insurance / yr
- $507 – $1,088
Fire risk 4/10 · Minor
- Est. fire insurance / yr
- $604 – $1,122
Heat risk 4/10 · Minor
- Hot days now (above 96°F)
- 7 days/yr
- Hot days in 30 yrs
- 14 days/yr
Wind risk 1/10 · Minimal
- Chance of severe wind over 30 yrs
- —
Air-quality risk 9/10 · Severe
- Unhealthy air days now
- 18 days/yr
- Unhealthy air days in 30 yrs
- 18 days/yr
Risk factors via First Street. Map © Google.
Why this score? — see what drove the B grade
The composite is a weighted blend of 9 inputs, each scored 0–100. Each bar is that input's sub-score; the figure is the points it added to the 100-point composite (weight × sub-score).
- Cash flow +30.0/30.0
- 1% rule +10.0/10.0
- DSCR +10.0/10.0
- ARV discount +7.5/15.0
- Condition / age +4.0/5.0
- Schools +3.9/10.0
- Livability +3.2/5.0
- Rent growth +2.1/5.0
- Appreciation +0.0/10.0
$121,999
🖨 Deal sheet 📄 Offer letter ✓ Due diligence
Listing remarks
4 bedroom with 1,680 sq. ft. this home has been totally up dated with all new appliances, flooring, paint inside and out, new HVAC unit, New 12x8 garden shed, seller has put in new grass and gravel, home is ready to move in. Owner contract possibly with large down payment.
Key facts
- New flooring
- New paint
- New grass
Tags
Neighborhood map
What this means for you Summary
Snapshot
- This is a 4-bed/2.0-bath manufactured listed at $122k. Condition is rated good.
Deal economics
- At list price, monthly cash flow is $752 ($9k/yr) — positive.
- The deal already cash-flows at list — no discount required.
- Meets the 1% rule at list price ($2k rent vs $122k).
- Recommended offer: $111k (9.0% below list) — sets the bar for market timing.
- Cap rate 13.7% vs local median 2.7% in Cascade Valley — top-decile yield for the area; either an underpriced asset or a hidden risk that comps aren't pricing in. Stress-test before assuming the spread holds.
Location & tenants
- Location reads 64/100 on livability (#370 in WA) — a middle-class / working-renter tenant base. Strengths: cost of living A+, health & safety A+, crime B; Watch: commute D, employment D, schools F.
- Moses Lake School District (town): math 38% / reading 48% proficiency, ranked #198 of 291 in WA (top 68%) — families likely to look elsewhere, expect single-tenant / working-renter base with shorter leases.
- Market conditions: Rents soft (-1.7%/yr); 585 active listings in the ZIP; 9 comparable units currently listed for rent nearby; rentals lingering (median 44d on market — plan ~5-8 weeks vacancy on turnover, expect pricing pressure); 100% of comp listings sitting > 30 days — soft ceiling on asking rent; 559 units permitted in Grant County in 2024 (35 in 5+ unit buildings).
- This rent runs 32% of the median local income ($75k/yr) — at the standard rent-burdened threshold; future hikes will face affordability resistance.
Forward outlook
- Local home prices are declining (-3.0%/yr); year-one equity from $843 of loan paydown is wiped out by about $4k of value loss. Plan a longer hold.
- Grant County population projected at +16% by 2050 — long-run rental-demand tailwind backs the buy-and-hold thesis.
- At projected returns (-3.0% appreciation + 0.0% rent growth), your $34k cash investment doubles in ~6 years — after that, you're playing with house money.
Negotiation context
- It's been on market 95 days — a 9% lower offer ($111k) is reasonable based on typical stale-listing flexibility.
- 2 sale attempts since 24y ago; this cycle's ask has dropped $13k (10%) from the opening price — seller is motivated, your offer sets the floor, not the list.
- Current owner paid $24k; list at $122k implies a 408% gain — meaningful room to come down on a strong offer.
Questions for the listing agent
- It's been on market 95 days. Have you received any prior offers? Is the seller open to a 9% concession, seller financing, or rate buy-down credit?
- Why hasn't it sold? Are there any deal-killer items the seller is aware of (foundation, flood, title, zoning, code violations)?
- Is there a deadline driving the sale (1031 exchange, divorce, estate, relocation)? That informs how much negotiation room exists.
- Schools are F-rated, which usually means shorter tenancies and higher turnover. Who's the typical renter profile here, and what's been the actual vacancy rate?
- What's the average days-on-market for RENTAL listings here right now (not sales)? A rising rental-DOM trend means longer vacancies and softer asking-rent achievability than the comps imply.
- What's the recent tenant-quality profile in this submarket — average credit score on applications, eviction rate, late-payment / NSF rate, and stable-employment percentage? A property-management company in the area should have these aggregated.
- How much new for-sale + rental construction is in the pipeline within 1–3 miles? Heavy new supply typically softens prices + rents 12–24 months out; constrained supply supports both.
Investment metrics
- 1% rule
- 1.66% ✓
- Cap rate
- 13.69%
- Cash-on-cash
- 26.42%
- DSCR
- 2.18
- GRM
- 5.0
CMA / ARV
- ARV (median comp)
- $257,372
- List price
- $121,999
- Delta
- -52.60%
- Verdict
- UNDERPRICED
- Comps
- 5 within 1.0 mi
Show comp detail 3 sales within ~0.75 mi
| Address | Dist | Beds/Ba | Sqft | Sold | Price | $/sf | Match |
|---|---|---|---|---|---|---|---|
| 4815 NE Airway Dr #86 | 0.17mi | 3/2.0 (-1) | 1,728 (+3%) | 3mo | $74,900 | $43 | 80 |
| 8521 Jean Rd NE | 0.56mi | 3/2.0 (-1) | 1,512 (-10%) | 2mo | $225,000 | $149 | 51 |
| 8654 Broad St NE | 0.73mi | 3/2.0 (-1) | 1,782 (+6%) | 9mo | $285,000 | $160 | 43 |
Match score weights: distance 35% · size 25% · config 20% · recency 20%. Top-matched comps best support the ARV.
Projected returns pro-forma
-3.0% appreciation · 0.0% rent growth · sell at horizon
- IRR
- 16.8%
- Equity multiple
- 1.65×
- Total profit
- $22,243
- Equity at exit
- $18,190
- IRR
- 23.1%
- Equity multiple
- 2.71×
- Total profit
- $58,301
- Equity at exit
- $10,548
Cash invested: $34,160 (down + closing). Projections, not guarantees.
Landlord ↔ Tenant lean methodology
- Overall (STATE)
- 28 Tenant-Leaning
- State Washington
- 28 Tenant-Leaning · D+8
- County
- — inherits STATE
- City
- — inherits STATE
ZIP-level market 98837
- Rents YoY
- -1.7%
- Active inventory
- 585
- Price-to-rent
- 5.0×
Monthly cashflow live
- Estimated rent
- $2,019 high interval (Pro) →
- Mortgage (P&I)
- −$640
- Tax est. 1.5%
- −$152 /mo · $1,830/yr
- Insurance
- −$51
- HOA
- −$0
- Vacancy / Maint / Mgmt
- −$424
- Net cashflow
- $752
Break-even live
UW: 25.0% down · 7.5% · 30yr · 1.5% tax · 5.0% vac · 8.0% maint · 8.0% mgmt
Financing live
Cash to close
- Down payment
- $30,500
- Closing costs
- $3,660
- Reserves months
- —
- Total cash needed
- —
Loan-product check · same deal, 3 products live
Conventional
25% down · 7.5% · 30yr
- Down + closing
- —
- Monthly P&I
- —
- Monthly cashflow
- —
- DSCR
- —
- Eligible?
- —
Personal DTI + credit; lowest rate.
DSCR
20% down · 8.5% · 30yr
- Down + closing
- —
- Monthly P&I
- —
- Monthly cashflow
- —
- DSCR
- —
- Eligible?
- —
No personal income docs; deal must DSCR.
Hard money
10% down · 12.0% · 12mo
- Down + closing
- —
- Monthly P&I
- —
- Monthly cashflow
- —
- DSCR
- —
- Eligible?
- —
Short-term bridge; refi at stabilization.
Rent comps 9 comps
| Address | Beds | Baths | Sqft | Rent | $/sqft | DOM | Units | Dist |
|---|---|---|---|---|---|---|---|---|
| 205 March Dr NE Unit Labs Moses Lake, WA | 3.0 | 1.5 | 1440 | $1,750 | $1.22 | 43d | 1 | 0.31mi |
| 207 March Dr NE Moses Lake, WA | 3.0 | 1.5 | 1220 | $1,850 | $1.52 | 43d | 1 | 0.32mi |
| 7622 McDougal Ave NE Unit 3 Moses Lake, WA | 3.0 | 2.5 | 1810 | $2,300 | $1.27 | 43d | 1 | 0.37mi |
| 8915 Travis Dr Unit B Moses Lake, WA | 3.0 | 1.0 | 1144 | $1,100 | $0.96 | 43d | 1 | 0.60mi |
| 1903 Hickory Rd Moses Lake, WA | 3.0 | 2.5 | 1743 | $2,450 | $1.41 | 43d | 1 | 1.16mi |
| 1118 W Sequoia Rd Moses Lake, WA | 3.0 | 2.0 | 1235 | $2,000 | $1.62 | 43d | 1 | 1.25mi |
| 1013 W Maple Dr Moses Lake, WA | 3.0 | 2.0 | 1450 | $1,875 | $1.29 | 43d | 1 | 1.29mi |
| 1005 W Sequoia Rd Moses Lake, WA | 3.0 | 2.5 | 1743 | $2,095 | $1.20 | 43d | 1 | 1.36mi |
| 1422 E Craig St Moses Lake, WA | 2.0–4.0 | 1.0–2.0 | 980 | $1,550 | $1.58 | 44d | 1 | 1.41mi |
Listing history 21 events
-
2026-06-19days on market $121,999 Active 95 DOM
-
2026-06-18days on market $121,999 Active 94 DOM
-
2026-06-17days on market $121,999 Active 93 DOM
-
2026-06-16days on market $121,999 Active 92 DOM
-
2026-06-15days on market $121,999 Active 91 DOM
-
2026-06-14days on market $121,999 Active 89 DOM
-
2026-06-13days on market $121,999 Active 88 DOM
-
2026-06-10days on market $121,999 Active 86 DOM
-
2026-06-09days on market $121,999 Active 85 DOM
-
2026-06-08days on market $121,999 Active 84 DOM
-
2026-06-07days on market $121,999 Active 83 DOM
-
2026-06-05days on market $121,999 Active 80 DOM
-
2026-06-03days on market $121,999 Active 79 DOM
-
2026-06-02pricedays on market $121,999 Active 78 DOM
-
2026-06-01days on market $128,500 Active 77 DOM
-
2026-05-31days on market $128,500 Active 76 DOM
-
2026-05-30days on market $128,500 Active 75 DOM
-
2026-04-20price $128,500
-
2026-03-16$135,000 Active
-
2002-05-31soldstatus $24,000
-
2002-02-20$29,900
ⓘ Source: listings_history table (triggers on properties + properties_extension) + one-shot
backfill from property_details.listing_events for pre-trigger history.
Climate risk First Street
- Flood 1/10 Low FEMA zone X (unshaded) · 0% chance over 30 yrs
- Wildfire 4/10 Moderate
- Heat 4/10 Moderate 7 d/yr ≥96°F today · 14 d/yr by 30 yrs out
- Wind 1/10 Low
- Air quality 9/10 Extreme 18 unhealthy d/yr today · 18 by 30 yrs out
Nearby sold comps map
Loading sold comps map…
Walkable amenities ~0.75 mi
Loading nearby amenities…
Taxation est. · year 1
- Rental income
- $24,230
- − Mortgage interest
- −$6,834
- − Property taxes
- −$1,830
- − Insurance
- −$610
- − Repairs & maintenance
- −$1,938
- − Management
- −$1,938
- − Depreciation
- −$3,549
- Taxable income
- $7,531
- Est. tax owed @ 24.0%
- −$1,807
- After-tax cash flow
- $7,217/yr
For passive investors: Depreciation is non-cash, so a rental often shows a tax loss while cash-flowing — sheltering income. Rental losses are passive: they offset passive income freely, and up to $25,000/yr can offset ordinary (W-2) income if you actively participate and your MAGI is under $100k (phasing out to $0 by $150k); unused losses carry forward. On sale, claimed depreciation is recaptured at up to 25%, and gains may owe capital-gains tax (a 1031 exchange can defer both). Figures are a year-1 estimate at your 24.0% rate — not tax advice; consult a CPA.
Condition & rehab AI · 12 photos
This manufactured home is in excellent condition with recent updates, ready for immediate occupancy and showing strong potential for both resale and rental value.
Value-add opportunities
- Both landscaping — enhances curb appeal and adds value
- Both exterior paint — fresh paint improves appearance
- Both interior paint — fresh paint enhances interior aesthetics
Renovation cost estimate screening
Value-add ROI direction
- Both landscaping — enhances curb appeal and adds value ↑
- Both exterior paint — fresh paint improves appearance ↑
- Both interior paint — fresh paint enhances interior aesthetics ↑
ⓘ Cost ranges are severity-bucket heuristics (US national rule-of-thumb). Get contractor quotes + a written scope before underwriting a rehab budget.
Schools (NCES district)
- District
- Moses Lake School District
- NCES district ID
- 5305220
- Math proficiency
- 38% ▬ 0.00%
- Reading proficiency
- 48% ▼ -1.00%
- Median HH income
- $49,033
- Composite
- 39.17/100
- National rank
- #8232
- State rank
- #198 of 291 in WA
Livability — Cascade Valley
- Score
- 64/100
- State rank
- #370
- US rank
- #14130
Category grades
Schools grade is shown separately in the Schools card above.
Census & demographics
- Census place
- Cascade Valley, WA
- County
- Grant County · 61,643 people
- City population
- 47,399
- Metro
- Moses Lake, WA
- Population (ZIP)
- 49,455
- Household income
- $74,586
- Rent vs Own
- Severe rent burden
- 1064.0
Population outlook (Grant County) Hauer SSP2
- Today (2025)
- 99,356 people
- By 2030
- 102,107 · +2.8%
- By 2040
- 108,318 · +9.0%
- By 2050
- 114,712 · +15.5%
- By 2075
- 131,376 · +32.2%
- By 2100
- 146,163 · +47.1%
Race, ethnicity, and origin ACS 2023
- Neighborhood character
- Diverse neighborhood (Simpson 0.55)
- Race & ethnicity
- White 58% Hispanic / Latino 33% Two or more races 15% Black 2% Asian 1%
- Hispanic origin (detail)
- Mexican 30%
- Common ancestry
- Portuguese 3% Subsaharan African 2% Lithuanian 2%
- Foreign-born
- 10% · Canada
- Languages at home
- 76% English-only · Spanish 21% Russian/Polish/Slavic 2%
Political lean MEDSL · Grant
- 2024 margin
- Solid R (+37.5) · D 30.0% · R 67.4% · Other 2.6%
- 2008→2024 swing
- -9.9pp toward R · 2008: -27.5pp · 2024: -37.5pp
- All cycles
- 2024: R+37.5 2020: R+34.4 2016: R+37.9 2012: R+32.6 2008: R+27.5
Not yet ingested
- Civics
- —
Market trends
- HPI YoY
- ▼ -384.29%
- Current HPI
- 208.4574
- Rent YoY
- ▼ -1.72%
- Metro
- Moses Lake, WA
- State GDP YoY
- ▲ 4.65%
- F500 in state
- 22
Industry mix (Fortune 500 HQ in WA)
| Industry | F500 HQs | Revenue |
|---|---|---|
| Retail | 2 | $269B |
|
||
| Technology / Retail | 1 | $638B |
|
||
| Technology | 1 | $245B |
|
||
| Telecommunications | 1 | $38B |
|
||
| Food / Beverage | 1 | $36B |
|
||
| Automotive / Trucks | 1 | $34B |
|
||
Price history
+329.8% since first listed4 events — show timeline
- 2026-04-20 Price Changed $128,500 NWMLS as Distributed by MLS Grid
- 2026-03-16 Listed $135,000 NWMLS as Distributed by MLS Grid
- 2002-05-31 Sold (MLS) $24,000 NWMLS as Distributed by MLS Grid
- 2002-02-20 Listed $29,900 NWMLS as Distributed by MLS Grid
Cash-flow waterfall
monthlySold comps — $/sqft
last 12 mo · ≤1 miLoading sold comps…