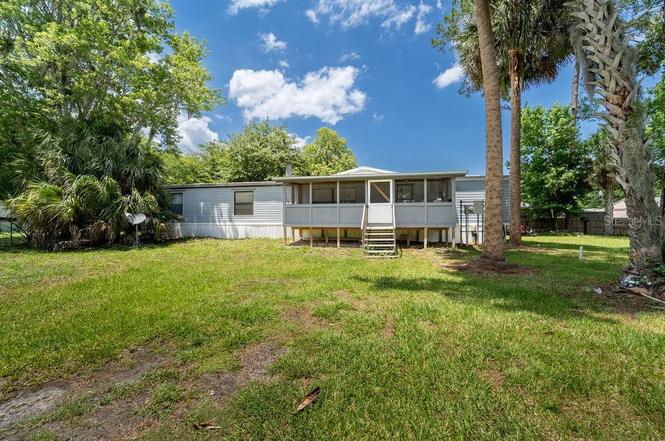
24031 Armadillo Rd · Astor, FL
Flood risk 1/10 · Minimal
- FEMA flood zone
- X (unshaded)
- Chance of flooding over 30 yrs
- 0.0%
- Est. flood insurance / yr
- $507 – $1,088
Fire risk 3/10 · Minor
- Est. fire insurance / yr
- $947 – $1,759
Heat risk 9/10 · Severe
- Hot days now (above 107°F)
- 7 days/yr
- Hot days in 30 yrs
- 22 days/yr
Wind risk 9/10 · Severe
- Chance of severe wind over 30 yrs
- 99.0%
Air-quality risk 3/10 · Minor
- Unhealthy air days now
- 2 days/yr
- Unhealthy air days in 30 yrs
- 3 days/yr
Risk factors via First Street. Map © Google.
Why this score? — see what drove the B+ grade
The composite is a weighted blend of 9 inputs, each scored 0–100. Each bar is that input's sub-score; the figure is the points it added to the 100-point composite (weight × sub-score).
- Cash flow +30.0/30.0
- 1% rule +10.0/10.0
- DSCR +10.0/10.0
- ARV discount +7.5/15.0
- Appreciation +6.0/10.0
- Schools +4.2/10.0
- Livability +3.3/5.0
- Rent growth +2.5/5.0
- Condition / age +2.5/5.0
$165,000
🖨 Deal sheet 📄 Offer letter ✓ Due diligence
Listing remarks
Spacious double-wide manufactured home with 1,864 sq. ft. of living space just minutes from the beautiful St. John’s River! This home offers a large living area, an eat-in kitchen, and a formal dining room—perfect for family gatherings or entertaining. The primary suite boasts a huge master bathroom with a garden tub, separate shower, abundant wood cabinetry, and a walk-in closet. Three additional bedrooms, a second full bath, an inside laundry room, and a cozy wood-burning fireplace add to the home’s comfort and functionality. Best of all, this property sits on your own land with no HOA or deed restrictions. For just $40 a year, you’ll enjoy access to the community
Key facts
- 7,500 sq ft lot
- Built 2000
- Listed 250 days
Property features AI
Finance
- Other: Lot roughly 0.17 acres (approx. 75 x 100), paved road access; Zoning: R-7
Exterior
- Utilities: Public water; Public sewer; Electricity connected
- Home design: Manufactured double-wide home; Single-story; Faces south
- Construction: Vinyl siding; Metal roof; Crawlspace foundation; Approximately 1,848 living area (public records)
- Exterior features: Covered and screened front porch (enclosed); Exterior lighting
Interior
- Kitchen: Dishwasher; Range; Range hood; Refrigerator
- Bedrooms: 4 bedrooms
- Flooring: Carpet; Vinyl
- Bathrooms: 2 full bathrooms
- Heating & cooling: Central heating; Central air conditioning
- Interior features: Ceiling fans; Eat-in kitchen; Open floorplan; Solid wood cabinets; Walk-in closets; Wood-burning fireplace
- Laundry & utility: Dedicated laundry room
Neighborhood map
What this means for you Summary
Snapshot
- This is a 4-bed/2.0-bath manufactured listed at $165k.
Deal economics
- At list price, monthly cash flow is $816 ($10k/yr) — positive.
- The deal already cash-flows at list — no discount required.
- Meets the 1% rule at list price ($2k rent vs $165k).
- Recommended offer: $145k (12.0% below list) — sets the bar for market timing.
Location & tenants
- Location reads 66/100 on livability (#613 in FL) — a middle-class / working-renter tenant base. Strengths: crime A+, cost of living A+, housing A+; Watch: amenities F, commute F, health & safety D-.
- Lake (suburban): math 49% / reading 50% proficiency, ranked #37 of 73 in FL (top 51%) — families likely to look elsewhere, expect single-tenant / working-renter base with shorter leases.
- Zoned schools: Umatilla Elementary School (math 59% / reading 56%, grade C+, #764 of 2,144 statewide, top 36%, 660 students, 55% FRL); Umatilla High School (math 24% / reading 29%, grade F, #489 of 667 statewide, top 74%, 861 students, 51% FRL) — zoned schools at 53% FRL track the district average.
- Market conditions: 77 active listings in the ZIP; 1 comparable units currently listed for rent nearby; 4,799 units permitted in Lake County in 2024 (814 in 5+ unit buildings).
Forward outlook
- In year one you build about $4k of equity ($1k loan paydown + $3k appreciation (1.9% local appreciation)).
- Lake County population projected at +37% by 2050 — long-run rental-demand tailwind backs the buy-and-hold thesis.
- At projected returns (1.9% appreciation + 3.0% rent growth), your $46k cash investment doubles in ~4 years — after that, you're playing with house money.
- By year 8, paydown + projected appreciation supports a ~$33k cash-out refi (75% LTV) — recoverable capital for the next deal without selling this one.
Negotiation context
- It's been on market 250 days — a 12% lower offer ($145k) is reasonable based on typical stale-listing flexibility.
- 3 sale attempts; this cycle's ask has dropped $70k (30%) from the opening price — seller is motivated, your offer sets the floor, not the list.
- Current owner paid $14k; list at $165k implies a 1079% gain — meaningful room to come down on a strong offer.
Risks & watch-outs
- Climate carrying-cost: severe wind risk, 99% chance of damaging wind over 30y; extreme-heat days projected 7→22/yr by 2055 (HVAC capex compounding) — expect insurance premiums to compound above CPI over the hold.
Questions for the listing agent
- It's been on market 250 days. Have you received any prior offers? Is the seller open to a 12% concession, seller financing, or rate buy-down credit?
- Why hasn't it sold? Are there any deal-killer items the seller is aware of (foundation, flood, title, zoning, code violations)?
- Is there a deadline driving the sale (1031 exchange, divorce, estate, relocation)? That informs how much negotiation room exists.
- Schools are F-rated, which usually means shorter tenancies and higher turnover. Who's the typical renter profile here, and what's been the actual vacancy rate?
- What's the average days-on-market for RENTAL listings here right now (not sales)? A rising rental-DOM trend means longer vacancies and softer asking-rent achievability than the comps imply.
- What's the recent tenant-quality profile in this submarket — average credit score on applications, eviction rate, late-payment / NSF rate, and stable-employment percentage? A property-management company in the area should have these aggregated.
- How much new for-sale + rental construction is in the pipeline within 1–3 miles? Heavy new supply typically softens prices + rents 12–24 months out; constrained supply supports both.
Investment metrics
- 1% rule
- 1.52% ✓
- Cap rate
- 12.23%
- Cash-on-cash
- 21.20%
- DSCR
- 1.94
- GRM
- 5.5
CMA / ARV
No comps found within radius.
Projected returns pro-forma
1.95% appreciation · 3.0% rent growth · sell at horizon
- IRR
- 25.3%
- Equity multiple
- 2.36×
- Total profit
- $62,946
- Equity at exit
- $64,644
- IRR
- 27.1%
- Equity multiple
- 4.53×
- Total profit
- $162,965
- Equity at exit
- $92,753
Cash invested: $46,200 (down + closing). Projections, not guarantees.
Landlord ↔ Tenant lean methodology
- Overall (STATE)
- 87 Strongly Landlord-Friendly
- State Florida
- 87 Strongly Landlord-Friendly · R+3
- County
- — inherits STATE
- City
- — inherits STATE
ZIP-level market 32102
- Home prices YoY
- 0.8%
- Active inventory
- 77
- Price-to-rent
- 5.5×
Monthly cashflow live
- Estimated rent
- $2,500 medium interval (Pro) →
- Mortgage (P&I)
- −$865
- Tax from tax record
- −$225 /mo · $2,695/yr
- Insurance
- −$69
- HOA
- −$0
- Vacancy / Maint / Mgmt
- −$525
- Net cashflow
- $816
Break-even live
UW: 25.0% down · 7.5% · 30yr · 1.5% tax · 5.0% vac · 8.0% maint · 8.0% mgmt
Financing live
Cash to close
- Down payment
- $41,250
- Closing costs
- $4,950
- Reserves months
- —
- Total cash needed
- —
Loan-product check · same deal, 3 products live
Conventional
25% down · 7.5% · 30yr
- Down + closing
- —
- Monthly P&I
- —
- Monthly cashflow
- —
- DSCR
- —
- Eligible?
- —
Personal DTI + credit; lowest rate.
DSCR
20% down · 8.5% · 30yr
- Down + closing
- —
- Monthly P&I
- —
- Monthly cashflow
- —
- DSCR
- —
- Eligible?
- —
No personal income docs; deal must DSCR.
Hard money
10% down · 12.0% · 12mo
- Down + closing
- —
- Monthly P&I
- —
- Monthly cashflow
- —
- DSCR
- —
- Eligible?
- —
Short-term bridge; refi at stabilization.
Rent comps 1 comps
| Address | Beds | Baths | Sqft | Rent | $/sqft | DOM | Units | Dist |
|---|---|---|---|---|---|---|---|---|
| 56314 Blue Creek Rd Astor, FL | 3.0 | 2.0 | 1248 | $2,500 | $2.00 | 17d | 1 | 0.63mi |
Listing history 29 events
-
2026-06-18days on market $165,000 Active 250 DOM
-
2026-06-17days on market $165,000 Active 249 DOM
-
2026-06-16days on market $165,000 Active 248 DOM
-
2026-06-15days on market $165,000 Active 247 DOM
-
2026-06-13days on market $165,000 Active 245 DOM
-
2026-06-09days on market $165,000 Active 241 DOM
-
2026-06-08days on market $165,000 Active 240 DOM
-
2026-06-07days on market $165,000 Active 239 DOM
-
2026-06-04days on market $165,000 Active 236 DOM
-
2026-06-03days on market $165,000 Active 235 DOM
-
2026-06-02days on market $165,000 Active 234 DOM
-
2026-06-02days on market $165,000 Active 233 DOM
-
2026-05-31days on market $165,000 Active 232 DOM
-
2026-05-26status Active
-
2026-05-26price $165,000
-
2026-04-13status Active
-
2026-04-13price $150,000
-
2026-04-06status Pending
-
2026-03-11price $170,000
-
2026-02-03price $179,900
-
2026-01-15price $180,000
-
2025-11-19price $195,000
-
2025-10-17price $200,000
-
2025-09-19price $225,000
-
2025-09-05$235,000 Active
-
1997-03-25soldstatus $14,000
-
1989-10-01soldstatus $16,000
-
1986-12-01soldstatus $14,000
-
1981-02-01soldstatus $6,000
ⓘ Source: listings_history table (triggers on properties + properties_extension) + one-shot
backfill from property_details.listing_events for pre-trigger history.
Tax reassessment forecast FL · Resets to sale price
- Current annual tax
- $2,695 · $225/mo
- Projected year-2 tax
- $2,695 · $225/mo
- Expected delta
- $0/yr ($0/mo · 0.0%)
ⓘ Screening estimate from a state-policy table — verify with the county assessor before closing.
Climate risk First Street
- Flood 1/10 Low FEMA zone X (unshaded) · 0% chance over 30 yrs
- Wildfire 3/10 Moderate
- Heat 9/10 Extreme 7 d/yr ≥107°F today · 22 d/yr by 30 yrs out
- Wind 9/10 Extreme 99% chance of damaging wind over 30 yrs
- Air quality 3/10 Moderate 2 unhealthy d/yr today · 3 by 30 yrs out
Nearby sold comps map
Loading sold comps map…
Walkable amenities ~0.75 mi
Loading nearby amenities…
Taxation est. · year 1
- Rental income
- $30,000
- − Mortgage interest
- −$9,243
- − Property taxes
- −$2,695
- − Insurance
- −$825
- − Repairs & maintenance
- −$2,400
- − Management
- −$2,400
- − Depreciation
- −$4,800
- Taxable income
- $7,637
- Est. tax owed @ 24.0%
- −$1,833
- After-tax cash flow
- $7,963/yr
For passive investors: Depreciation is non-cash, so a rental often shows a tax loss while cash-flowing — sheltering income. Rental losses are passive: they offset passive income freely, and up to $25,000/yr can offset ordinary (W-2) income if you actively participate and your MAGI is under $100k (phasing out to $0 by $150k); unused losses carry forward. On sale, claimed depreciation is recaptured at up to 25%, and gains may owe capital-gains tax (a 1031 exchange can defer both). Figures are a year-1 estimate at your 24.0% rate — not tax advice; consult a CPA.
Schools (NCES district)
- District
- Lake
- NCES district ID
- 1201050
- Math proficiency
- 49% ▼ -7.00%
- Reading proficiency
- 50% ▼ -4.00%
- Median HH income
- $46,632
- Composite
- 42.05/100
- National rank
- #3327
- State rank
- #37 of 73 in FL
Livability — Astor
- Score
- 66/100
- State rank
- #613
- US rank
- #11822
Category grades
Schools grade is shown separately in the Schools card above.
Census & demographics
- Census place
- Astor, FL
- Population (ZIP)
- 2,401
Population outlook (Lake County) Hauer SSP2
- Today (2025)
- 386,640 people
- By 2030
- 417,107 · +7.9%
- By 2040
- 476,676 · +23.3%
- By 2050
- 531,296 · +37.4%
- By 2075
- 648,303 · +67.7%
- By 2100
- 698,530 · +80.7%
Race, ethnicity, and origin ACS 2023
- Neighborhood character
- Predominantly White (89%)
- Race & ethnicity
- White 89% Two or more races 7% Hispanic / Latino 3%
- Common ancestry
- Lithuanian 9% Portuguese 8% Slovak 2%
- Foreign-born
- 2% · Canada
- Languages at home
- 95% English-only · Spanish 3% German/W. Germanic 1% Russian/Polish/Slavic 1%
Political lean MEDSL · Lake
- 2024 margin
- Strong R (+24.7) · D 37.3% · R 62.0%
- 2008→2024 swing
- -11.2pp toward R · 2008: -13.5pp · 2024: -24.7pp
- All cycles
- 2024: R+24.7 2020: R+20.0 2016: R+23.1 2012: R+17.1 2008: R+13.5
Not yet ingested
- Civics
- —
Market trends
- HPI YoY
- ▲ 1.95%
- Current HPI
- 232.7974
- Rent YoY
- —
- Metro
- —
- State GDP YoY
- ▲ 3.28%
- F500 in state
- 36
Industry mix (Fortune 500 HQ in FL)
| Industry | F500 HQs | Revenue |
|---|---|---|
| Industrial Technology | 2 | $29B |
|
||
| Insurance | 2 | $17B |
|
||
| Retail | 1 | $60B |
|
||
| Technology Distribution | 1 | $58B |
|
||
| Homebuilding | 1 | $35B |
|
||
| Technology Manufacturing | 1 | $35B |
|
||
Price history
+2650.0% since first listed16 events — show timeline
- 2026-05-26 Relisted — Stellar MLS as Distributed by MLS Grid
- 2026-05-26 Price Changed $165,000 Stellar MLS as Distributed by MLS Grid
- 2026-04-13 Relisted — Stellar MLS as Distributed by MLS Grid
- 2026-04-13 Price Changed $150,000 Stellar MLS as Distributed by MLS Grid
- 2026-04-06 Pending — Stellar MLS as Distributed by MLS Grid
- 2026-03-11 Price Changed $170,000 Stellar MLS as Distributed by MLS Grid
- 2026-02-03 Price Changed $179,900 Stellar MLS as Distributed by MLS Grid
- 2026-01-15 Price Changed $180,000 Stellar MLS as Distributed by MLS Grid
- 2025-11-19 Price Changed $195,000 Stellar MLS as Distributed by MLS Grid
- 2025-10-17 Price Changed $200,000 Stellar MLS as Distributed by MLS Grid
- 2025-09-19 Price Changed $225,000 Stellar MLS as Distributed by MLS Grid
- 2025-09-05 Listed $235,000 Stellar MLS as Distributed by MLS Grid
- 1997-03-25 Sold (Public Records) $14,000 Public Records
- 1989-10-01 Sold (Public Records) $16,000 Public Records
- 1986-12-01 Sold (Public Records) $14,000 Public Records
- 1981-02-01 Sold (Public Records) $6,000 Public Records
Property tax history
+27.0%/yrLatest (2025): $2,695 · +3.8% YoY. Source: county tax records.
Cash-flow waterfall
monthlySold comps — $/sqft
last 12 mo · ≤1 miLoading sold comps…