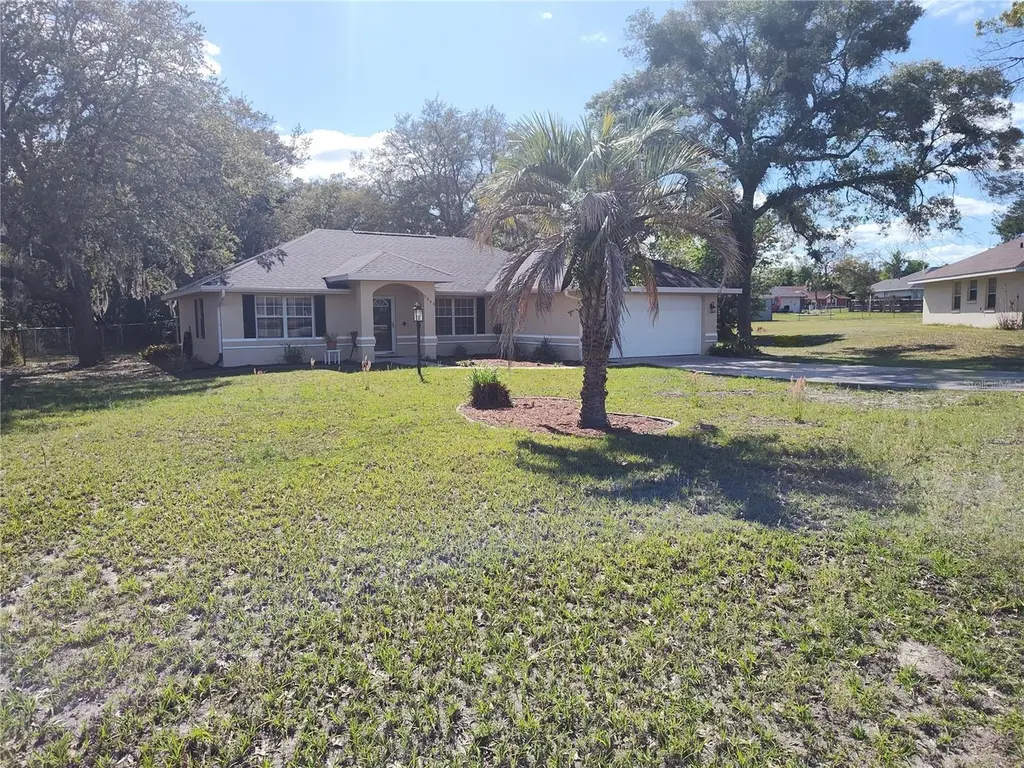
5395 SW 103rd Loop · Liberty Triangle, FL
Flood risk 7/10 · Major
- FEMA flood zone
- X (unshaded)
- Chance of flooding over 30 yrs
- 0.76%
- Est. flood insurance / yr
- $507 – $1,088
Fire risk 4/10 · Minor
- Est. fire insurance / yr
- $947 – $1,759
Heat risk 8/10 · Major
- Hot days now (above 108°F)
- 6 days/yr
- Hot days in 30 yrs
- 18 days/yr
Wind risk 9/10 · Severe
- Chance of severe wind over 30 yrs
- 99.0%
Air-quality risk 2/10 · Minimal
- Unhealthy air days now
- 2 days/yr
- Unhealthy air days in 30 yrs
- 2 days/yr
Risk factors via First Street. Map © Google.
Why this score? — see what drove the D grade
The composite is a weighted blend of 9 inputs, each scored 0–100. Each bar is that input's sub-score; the figure is the points it added to the 100-point composite (weight × sub-score).
- ARV discount +13.3/15.0
- Cash flow +12.2/30.0
- DSCR +3.6/10.0
- Schools +3.6/10.0
- 1% rule +2.7/10.0
- Livability +2.5/5.0
- Condition / age +2.5/5.0
- Rent growth +1.9/5.0
- Appreciation +0.0/10.0
$254,000
🖨 Deal sheet (PDF) 📄 Offer letter ✓ Due diligence
Listing remarks MLS
The perfect family home located on a cul-de-sac. Home features new flooring, covered front foyer entry, covered rear patio fenced in yard, wood laminate flooring, formal dining room, ceiling fans, split bedroom floorplan and cathedral ceilings. Open kitchen with pantry and snack counter. Owner's suite with bath features a double vanity, separate tub and shower.
Key facts
- Prime ocala location
- Split floor plan
- Primary suite
Tags
Property features AI
Finance
- Other: Unfurnished; Total building area noted in public records; Living area reported from public records
- Financial info: Tax information available (details excluded)
- HOA & community: No HOA/association indicated; Pets allowed
Exterior
- Parking: Driveway; Attached 2-car garage
- Utilities: Public water; Septic tank sewer; Electricity connected; Water connected
- Home design: Single family residence; One story; Northeast-facing; Property status: completed; Homestead exempt
- Construction: Block, concrete and stucco construction; Shingle roof; Slab foundation; Built as existing (year not provided)
- Exterior features: Front porch; Rear porch; French doors; Rain gutters; Chain link fencing; Cleared lot; Cul-de-sac lot; Trees and landscaping; Asphalt road
Interior
- Kitchen: Dishwasher; Disposal; Microwave; Range; Refrigerator
- Bedrooms: 3 bedrooms
- Flooring: Carpet; Laminate; Tile
- Bathrooms: 2 full bathrooms
- Heating & cooling: Central heating; Central air conditioning
- Interior features: Ceiling fans; High ceilings; Walk-in closets; Blinds, shades and drapery rods; Double-pane windows
- Laundry & utility: Inside laundry room; Washer; Dryer
Neighborhood map
What this means for you Summary
Snapshot
- This is a 3-bed/2.0-bath single-family listed at $254k.
Deal economics
- At list price, monthly cash flow is $-116 ($-1k/yr) — negative.
- To cash-flow at today's rent, offer at most $234k (8.1% below list).
- To meet the 1% rule (rent ≥ 1% of price), the offer needs to be $195k (23.2% below list).
- Recommended offer: $195k (23.2% below list) — sets the bar for 1% rule.
- Cap rate 6.1% vs local median 4.5% in Liberty Triangle — top-decile yield for the area; either an underpriced asset or a hidden risk that comps aren't pricing in. Stress-test before assuming the spread holds.
Location & tenants
- Location reads: area grade D — affects rentability + tenant quality, not the cash-flow math above.
- Marion (rural): math 42% / reading 43% proficiency, ranked #61 of 73 in FL (top 84%) — families likely to look elsewhere, expect single-tenant / working-renter base with shorter leases; 61% free/reduced lunch — lower-income household profile, screen leases tightly.
- Zoned schools: Hammett Bowen Jr. Elementary School (math 56% / reading 56%, grade C+, #832 of 2,144 statewide, top 40%, 867 students, 54% FRL); Liberty Middle School (math 40% / reading 41%, grade F, #360 of 571 statewide, top 64%, 1,365 students, 54% FRL); West Port High School (math 34% / reading 52%, grade F, #255 of 667 statewide, top 39%, 2,906 students, 52% FRL).
- Market conditions: Rents soft (-2.6%/yr); 858 active listings in the ZIP; 13 comparable units currently listed for rent nearby; rentals at typical pace (median 23d on market — plan ~3-4 weeks tenant-placement turnaround); 7,071 units permitted in Marion County in 2024 (534 in 5+ unit buildings).
- This rent runs 36% of the median local income ($66k/yr) — at the standard rent-burdened threshold; future hikes will face affordability resistance.
Forward outlook
- Local home prices are declining (-3.0%/yr); year-one equity from $2k of loan paydown is wiped out by about $8k of value loss. Plan a longer hold.
- Marion County population projected at +13% by 2050 — modest demand growth; plan on rents tracking national, not racing it.
Negotiation context
- It's been on market 36 days — a 3% lower offer ($246k) is reasonable based on typical stale-listing flexibility.
- 3 sale attempts since 16y ago with the ask held roughly flat each time — persistent listings suggest the price (not the market) is what's stuck; bring a comps-based counter.
- Current owner paid $112k; list at $254k implies a 126% gain — meaningful room to come down on a strong offer.
Risks & watch-outs
- Watch-outs: flood insurance adds $66/mo.
- Climate carrying-cost: major flood risk; severe wind risk, 99% chance of damaging wind over 30y; extreme-heat days projected 6→18/yr by 2055 (HVAC capex compounding) — expect insurance premiums to compound above CPI over the hold.
Questions for the listing agent
- What do current leases actually rent for vs. the listed asking? Can we see a recent rent roll and the last 12 months of T-12 income?
- It's been on market 36 days. Have you received any prior offers? Is the seller open to a 23% concession, seller financing, or rate buy-down credit?
- What's the actual annual flood-insurance premium (NFIP or private), and is the property in a SFHA with mandatory coverage?
- Is there a deadline driving the sale (1031 exchange, divorce, estate, relocation)? That informs how much negotiation room exists.
- The area grade is low — what's the realistic commute time and amenity access for the typical tenant pool here? Any planned neighborhood developments (good or bad) we should know about?
- What's the average days-on-market for RENTAL listings here right now (not sales)? A rising rental-DOM trend means longer vacancies and softer asking-rent achievability than the comps imply.
- What's the recent tenant-quality profile in this submarket — average credit score on applications, eviction rate, late-payment / NSF rate, and stable-employment percentage? A property-management company in the area should have these aggregated.
- How much new for-sale + rental construction is in the pipeline within 1–3 miles? Heavy new supply typically softens prices + rents 12–24 months out; constrained supply supports both.
Investment metrics
- 1% rule
- 0.77% ✗
- Cap rate
- 6.06%
- Cash-on-cash
- -0.83%
- DSCR
- 0.96
- GRM
- 10.9
CMA / ARV
- ARV (median comp)
- $291,915
- List price
- $254,000
- Delta
- -12.99%
- Verdict
- UNDERPRICED
- Comps
- 20 within 1.0 mi
Show comp detail 6 sales within ~0.75 mi
| Address | Dist | Beds/Ba | Sqft | Sold | Price | $/sf | Match |
|---|---|---|---|---|---|---|---|
| 6002 SW 107th St | 0.61mi | 3/2.0 | 1,478 (+5%) | 2mo | $280,000 | $189 | 61 |
| 5920 SW 102nd St | 0.58mi | 3/2.0 | 1,495 (+6%) | 2mo | $235,000 | $157 | 61 |
| 5930 SW 103rd St | 0.53mi | 2/2.0 (-1) | 1,366 (-3%) | 17mo | $220,000 | $161 | 51 |
| 10183 SW 54th Ct | 0.40mi | 3/2.0 | 1,580 (+12%) | 24mo | $278,900 | $177 | 41 |
| 9966 SW 55th Avenue Rd | 0.69mi | 3/2.0 | 1,485 (+6%) | 22mo | $295,000 | $199 | 40 |
| 10202 SW 61st Terrace Rd | 0.65mi | 2/2.0 (-1) | 1,292 (-8%) | 18mo | $212,500 | $164 | 36 |
Match score weights: distance 35% · size 25% · config 20% · recency 20%. Top-matched comps best support the ARV.
Projected returns pro-forma
-3.0% appreciation · 0.0% rent growth · sell at horizon
- IRR
- -22.8%
- Equity multiple
- 0.24×
- Total profit
- $-54,284
- Equity at exit
- $37,872
- IRR
- -26.7%
- Equity multiple
- -0.11×
- Total profit
- $-78,983
- Equity at exit
- $21,961
Cash invested: $71,120 (down + closing). Projections, not guarantees.
Landlord ↔ Tenant lean methodology
- Overall (STATE)
- 87 Strongly Landlord-Friendly
- State Florida
- 87 Strongly Landlord-Friendly · R+3
- County
- — inherits STATE
- City
- — inherits STATE
ZIP-level market 34476
- Rents YoY
- -2.6%
- Active inventory
- 858
- Price-to-rent
- 10.9×
Monthly cashflow live
- Estimated rent
- $1,950 high interval (Pro) →
- Mortgage (P&I)
- −$1,332
- Tax from tax record
- −$152 /mo · $1,823/yr
- Insurance
- −$106
- Flood insurance flood zone
- −$66 /mo · $798/yr
- HOA
- −$0
- Vacancy / Maint / Mgmt
- −$409
- Net cashflow
- $-116
Break-even live
Sensitivity live
| Price | -10% $28 | -5% $-44 | +0% $-116 | +5% $-188 | +10% $-260 |
|---|---|---|---|---|---|
| Rent | -10% $-270 | -5% $-193 | +0% $-116 | +5% $-39 | +10% $38 |
| Rate | -1.0pp $12 | -0.5pp $-51 | base $-116 | +0.5pp $-182 | +1.0pp $-249 |
UW: 25.0% down · 7.5% · 30yr · 1.5% tax · 5.0% vac · 8.0% maint · 8.0% mgmt
Financing live
Cash to close
- Down payment
- $63,500
- Closing costs
- $7,620
- Reserves months
- —
- Total cash needed
- —
Loan-product check · same deal, 3 products live
Conventional
25% down · 7.5% · 30yr
- Down + closing
- —
- Monthly P&I
- —
- Monthly cashflow
- —
- DSCR
- —
- Eligible?
- —
Personal DTI + credit; lowest rate.
DSCR
20% down · 8.5% · 30yr
- Down + closing
- —
- Monthly P&I
- —
- Monthly cashflow
- —
- DSCR
- —
- Eligible?
- —
No personal income docs; deal must DSCR.
Hard money
10% down · 12.0% · 12mo
- Down + closing
- —
- Monthly P&I
- —
- Monthly cashflow
- —
- DSCR
- —
- Eligible?
- —
Short-term bridge; refi at stabilization.
Rent comps 13 comps
| Address | Beds | Baths | Sqft | Rent | $/sqft | DOM | Units | Dist |
|---|---|---|---|---|---|---|---|---|
| 10417 SW 52nd Ct Ocala, FL | 3.0 | 2.0 | 1577 | $1,995 | $1.27 | 15d | 1 | 0.28mi |
| 14173 SW 60th Ter Unit 2 Ocala, FL | 2.0 | 2.0 | 1127 | $1,450 | $1.29 | 23d | 1 | 0.61mi |
| 10312 SW 61st Terrace Rd Ocala, FL | 2.0 | 2.0 | 1008 | $1,650 | $1.64 | 23d | 1 | 0.69mi |
| 9853 SW 59th Cir Ocala, FL | 2.0 | 1.0 | 935 | $1,500 | $1.60 | 15d | 1 | 0.79mi |
| 4937 SW 98th Pl Ocala, FL | 4.0 | 2.0 | 1838 | $2,400 | $1.31 | 15d | 1 | 0.87mi |
| 6035 SW 98th Street Rd Ocala, FL | 2.0 | 2.0 | 1494 | $1,650 | $1.10 | 15d | 1 | 0.92mi |
| 6345 SW 115th Street Rd Ocala, FL | 2.0 | 2.0 | 1008 | $1,400 | $1.39 | 23d | 1 | 0.98mi |
| 15062 SW 63rd Ct Ocala, FL | 4.0 | 2.5 | 1560 | $1,850 | $1.19 | 23d | 1 | 1.07mi |
| 11302 SW 62nd Cir Ocala, FL | 3.0 | 2.0 | 1526 | $2,095 | $1.37 | 23d | 1 | 1.13mi |
| 10912 SW 69th Cir Ocala, FL | 2.0 | 2.0 | 1169 | $1,600 | $1.37 | 23d | 1 | 1.20mi |
| 4296 SW 98th St Ocala, FL | 3.0 | 2.0 | 1607 | $1,700 | $1.06 | 23d | 1 | 1.29mi |
| 6367 SW 117th Street Rd Ocala, FL | 3.0 | 2.0 | 1602 | $2,650 | $1.65 | 23d | 1 | 1.33mi |
| 7177 SW 92nd St Ocala, FL | 3.0 | 2.5 | 1410 | $1,850 | $1.31 | 23d | 1 | 1.45mi |
Listing history 22 events
-
2026-06-18status $254,000 Pending 36 DOM
-
2026-06-18days on market $254,000 Active 36 DOM
-
2026-06-17days on market $254,000 Active 35 DOM
-
2026-06-16days on market $254,000 Active 34 DOM
-
2026-06-15days on market $254,000 Active 33 DOM
-
2026-06-14days on market $254,000 Active 31 DOM
-
2026-06-13days on market $254,000 Active 30 DOM
-
2026-06-10days on market $254,000 Active 28 DOM
-
2026-06-09days on market $254,000 Active 27 DOM
-
2026-06-08days on market $254,000 Active 26 DOM
-
2026-06-07days on market $254,000 Active 25 DOM
-
2026-06-03days on market $254,000 Active 21 DOM
-
2026-06-02days on market $254,000 Active 20 DOM
-
2026-06-01days on market $254,000 Active 19 DOM
-
2026-05-31days on market $254,000 Active 18 DOM
-
2026-05-30pricedays on market $254,000 Active 17 DOM
-
2026-05-13$264,000 Active 551-char remark
-
2016-01-06soldstatus $112,500 363-char remark
Show marketing remark (363 chars)
The perfect family home located on a cul-de-sac. Home features new flooring, covered front foyer entry, covered rear patio fenced in yard, wood laminate flooring, formal dining room, ceiling fans, split bedroom floorplan and cathedral ceilings. Open kitchen with pantry and snack counter. Owner's suite with bath features a double vanity, separate tub and shower.
-
2015-04-27$109,900 363-char remark
Show marketing remark (363 chars)
The perfect family home located on a cul-de-sac. Home features new flooring, covered front foyer entry, covered rear patio fenced in yard, wood laminate flooring, formal dining room, ceiling fans, split bedroom floorplan and cathedral ceilings. Open kitchen with pantry and snack counter. Owner's suite with bath features a double vanity, separate tub and shower.
-
2011-05-05historical
-
2010-12-17$95,000
-
2002-03-20soldstatus $93,000
ⓘ Source: listings_history table (triggers on properties + properties_extension) + one-shot
backfill from property_details.listing_events for pre-trigger history.
Tax reassessment forecast FL · Resets to sale price
- Current annual tax
- $1,823 · $152/mo
- Projected year-2 tax
- $2,108 · $176/mo
- Expected delta
- +$285/yr (+$24/mo · 15.6%)
ⓘ Screening estimate from a state-policy table — verify with the county assessor before closing.
Climate risk First Street
- Flood 7/10 Severe FEMA zone X (unshaded) · 76% chance over 30 yrs
- Wildfire 4/10 Moderate
- Heat 8/10 Severe 6 d/yr ≥108°F today · 18 d/yr by 30 yrs out
- Wind 9/10 Extreme 99% chance of damaging wind over 30 yrs
- Air quality 2/10 Low 2 unhealthy d/yr today · 2 by 30 yrs out
Nearby sold comps map
Loading sold comps map…
Walkable amenities ~0.75 mi
Loading nearby amenities…
Taxation est. · year 1
- Rental income
- $23,398
- − Mortgage interest
- −$14,228
- − Property taxes
- −$1,823
- − Insurance
- −$2,068
- − Repairs & maintenance
- −$1,872
- − Management
- −$1,872
- − Depreciation
- −$7,389
- Taxable loss
- −$5,854
- Est. tax savings @ 24.0%
- +$1,405
- After-tax cash flow
- $14/yr
For passive investors: Depreciation is non-cash, so a rental often shows a tax loss while cash-flowing — sheltering income. Rental losses are passive: they offset passive income freely, and up to $25,000/yr can offset ordinary (W-2) income if you actively participate and your MAGI is under $100k (phasing out to $0 by $150k); unused losses carry forward. On sale, claimed depreciation is recaptured at up to 25%, and gains may owe capital-gains tax (a 1031 exchange can defer both). Figures are a year-1 estimate at your 24.0% rate — not tax advice; consult a CPA.
Schools (NCES district)
- District
- Marion
- NCES district ID
- 1201260
- Math proficiency
- 42% ▼ -7.00%
- Reading proficiency
- 43% ▼ -4.00%
- Median HH income
- $40,015
- Composite
- 35.61/100
- National rank
- #4890
- State rank
- #61 of 73 in FL
Livability — Liberty Triangle
No livability data for this city. (Only ~50 U.S. cities are tracked.)
Census & demographics
- Census place
- Liberty Triangle, FL
- County
- Marion County · 315,796 people
- City population
- 26,397
- Metro
- Ocala, FL
- Population (ZIP)
- 28,997
- Household income
- $65,860
- Rent vs Own
- Severe rent burden
- 204.0
Population outlook (Marion County) Hauer SSP2
- Today (2025)
- 365,905 people
- By 2030
- 376,768 · +3.0%
- By 2040
- 396,555 · +8.4%
- By 2050
- 412,723 · +12.8%
- By 2075
- 446,090 · +21.9%
- By 2100
- 436,193 · +19.2%
Race, ethnicity, and origin ACS 2023
- Neighborhood character
- Diverse neighborhood (Simpson 0.55)
- Race & ethnicity
- White 63% Hispanic / Latino 18% Black 13% Two or more races 10% Asian 1%
- Hispanic origin (detail)
- Mexican 3% Puerto Rican 8% Cuban 3%
- Common ancestry
- Romanian 3% Slovak 3% Lithuanian 3%
- Foreign-born
- 15% · Canada, Jamaica, Dominican Republic
- Languages at home
- 83% English-only · Spanish 14% Other Indo-European 1% German/W. Germanic 1%
Political lean MEDSL · Marion
- 2024 margin
- Solid R (+31.6) · D 33.8% · R 65.5%
- 2008→2024 swing
- -20.0pp toward R · 2008: -11.6pp · 2024: -31.6pp
- All cycles
- 2024: R+31.6 2020: R+25.9 2016: R+26.2 2012: R+16.2 2008: R+11.6
Not yet ingested
- Civics
- —
Market trends
- HPI YoY
- ▼ -105.22%
- Current HPI
- 189.0869
- Rent YoY
- ▼ -2.57%
- Metro
- Ocala, FL
- State GDP YoY
- ▲ 3.28%
- F500 in state
- 36
Industry mix (Fortune 500 HQ in FL)
| Industry | F500 HQs | Revenue |
|---|---|---|
| Industrial Technology | 2 | $29B |
|
||
| Insurance | 2 | $17B |
|
||
| Retail | 1 | $60B |
|
||
| Technology Distribution | 1 | $58B |
|
||
| Homebuilding | 1 | $35B |
|
||
| Technology Manufacturing | 1 | $35B |
|
||
Price history
+173.1% since first listed7 events — show timeline
- 2026-05-29 Price Changed $254,000 Stellar MLS as Distributed by MLS Grid
- 2026-05-13 Listed $264,000 Stellar MLS as Distributed by MLS Grid
- 2016-01-06 Sold (MLS) $112,500 Stellar MLS as Distributed by MLS Grid
- 2015-04-27 Listed $109,900 Stellar MLS as Distributed by MLS Grid
- 2011-05-05 Listing Removed — Stellar MLS as Distributed by MLS Grid
- 2010-12-17 Listed $95,000 Stellar MLS as Distributed by MLS Grid
- 2002-03-20 Sold (Public Records) $93,000 Public Records
Property tax history
+0.6%/yrLatest (2025): $1,823 · +15.1% YoY. Source: county tax records.
Cash-flow waterfall
monthlySold comps — $/sqft
last 12 mo · ≤1 miLoading sold comps…