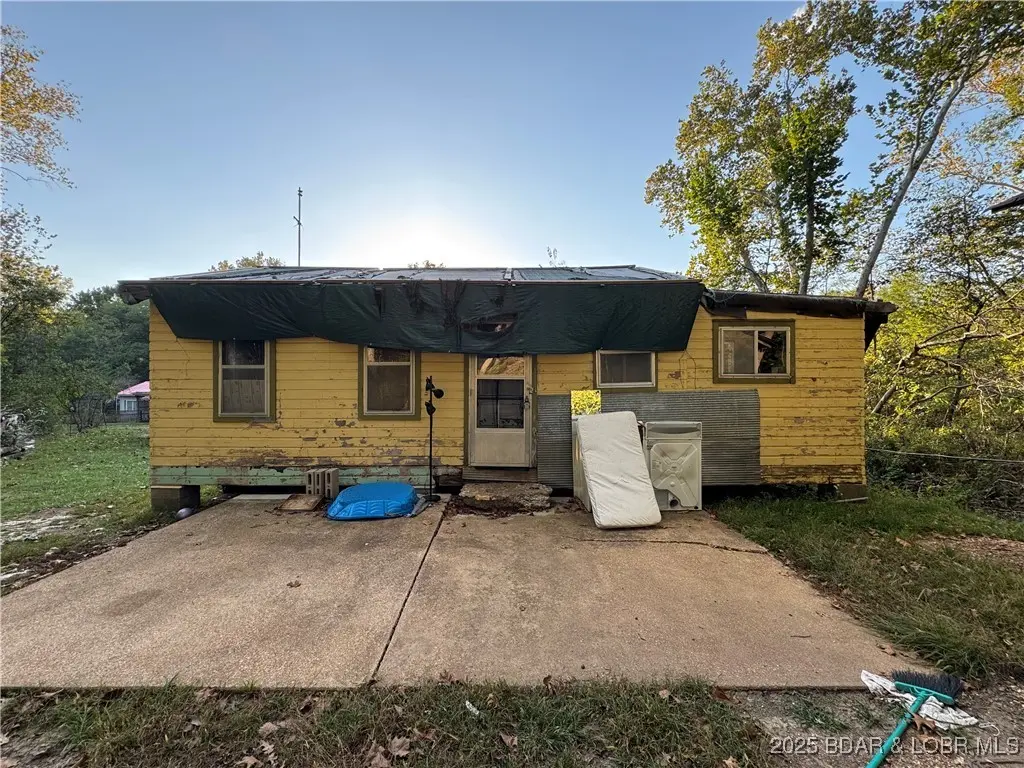
130 Sargent Ln · Climax Springs, MO
Flood risk 8/10 · Major
- FEMA flood zone
- X (unshaded)
- Chance of flooding over 30 yrs
- 0.99%
- Est. flood insurance / yr
- $507 – $1,088
Fire risk 5/10 · Moderate
- Est. fire insurance / yr
- $1,054 – $1,958
Heat risk 4/10 · Minor
- Hot days now (above 107°F)
- 7 days/yr
- Hot days in 30 yrs
- 19 days/yr
Wind risk 2/10 · Minimal
- Chance of severe wind over 30 yrs
- —
Air-quality risk 2/10 · Minimal
- Unhealthy air days now
- 0 days/yr
- Unhealthy air days in 30 yrs
- 1 days/yr
Risk factors via First Street. Map © Google.
Why this score? — see what drove the B- grade
The composite is a weighted blend of 9 inputs, each scored 0–100. Each bar is that input's sub-score; the figure is the points it added to the 100-point composite (weight × sub-score).
- Cash flow +30.0/30.0
- 1% rule +10.0/10.0
- DSCR +10.0/10.0
- ARV discount +7.5/15.0
- Schools +3.0/10.0
- Rent growth +2.5/5.0
- Livability +2.5/5.0
- Condition / age +2.5/5.0
- Appreciation +0.0/10.0
$35,000
🖨 Deal sheet 📄 Offer letter ✓ Due diligence
Listing remarks MLS
Investors and DIYers, this one is for you! Priced at only $35k! Seller has replaced electrical, plumbing, water heater, and started on the drywall and bathroom remodel. Selling in as-is condition. Just a walk away from Lake of the Ozarks and an access boat ramp on the 50 Mile Marker. Same cove as Red Fox--great water location! With a flat yard and backing up to woods, this home has potential to be an affordable lake getaway, long term rental, or flip. Private well and septic with no hoa. Home will not qualify for any type of loan. Storage shed and all building materials included! CoMo high speed fiber optic internet available!
Key facts
- Backing up to woods
- Replaced electrical
- Replaced plumbing
Tags
Neighborhood map
What this means for you Summary
Snapshot
- This is a 3-bed/1.0-bath other listed at $35k.
Deal economics
- At list price, monthly cash flow is $468 ($6k/yr) — positive.
- The deal already cash-flows at list — no discount required.
- Meets the 1% rule at list price ($983 rent vs $35k).
- Recommended offer: $31k (12.0% below list) — sets the bar for market timing.
- Cap rate 24.6% vs local median 0.8% in Climax Springs — top-decile yield for the area; either an underpriced asset or a hidden risk that comps aren't pricing in. Stress-test before assuming the spread holds.
Location & tenants
- Location reads 50/100 on livability (#910 in MO) — a working-class tenant base; expect higher turnover. Strengths: cost of living A+, crime A; Watch: schools D, amenities F, commute F.
- Climax Springs R-IV (rural): math 25% / reading 40% proficiency, ranked #431 of 535 in MO (top 81%) — families likely to look elsewhere, expect single-tenant / working-renter base with shorter leases; 70% free/reduced lunch — lower-income household profile, screen leases tightly.
- Market conditions: 57 active listings in the ZIP; 272 units permitted in Camden County in 2024 (0 in 5+ unit buildings).
Forward outlook
- Local home prices are declining (-3.0%/yr); year-one equity from $242 of loan paydown is wiped out by about $1k of value loss. Plan a longer hold.
- Camden County population projected to shrink 6% by 2050 — rents likely to lag national; underwrite the cash flow, not the appreciation.
- At projected returns (-3.0% appreciation + 3.0% rent growth), your $10k cash investment doubles in ~2 years — after that, you're playing with house money.
Negotiation context
- It's been on market 236 days — a 12% lower offer ($31k) is reasonable based on typical stale-listing flexibility.
- 5 sale attempts since 4y ago with the ask held roughly flat each time — persistent listings suggest the price (not the market) is what's stuck; bring a comps-based counter.
Risks & watch-outs
- Watch-outs: flood insurance adds $66/mo.
- Climate carrying-cost: severe flood risk; moderate wildfire risk — expect insurance premiums to compound above CPI over the hold.
Questions for the listing agent
- It's been on market 236 days. Have you received any prior offers? Is the seller open to a 12% concession, seller financing, or rate buy-down credit?
- What's the actual annual flood-insurance premium (NFIP or private), and is the property in a SFHA with mandatory coverage?
- Why hasn't it sold? Are there any deal-killer items the seller is aware of (foundation, flood, title, zoning, code violations)?
- Is there a deadline driving the sale (1031 exchange, divorce, estate, relocation)? That informs how much negotiation room exists.
- Schools are D-rated, which usually means shorter tenancies and higher turnover. Who's the typical renter profile here, and what's been the actual vacancy rate?
- What's the average days-on-market for RENTAL listings here right now (not sales)? A rising rental-DOM trend means longer vacancies and softer asking-rent achievability than the comps imply.
- What's the recent tenant-quality profile in this submarket — average credit score on applications, eviction rate, late-payment / NSF rate, and stable-employment percentage? A property-management company in the area should have these aggregated.
- How much new for-sale + rental construction is in the pipeline within 1–3 miles? Heavy new supply typically softens prices + rents 12–24 months out; constrained supply supports both.
Investment metrics
- 1% rule
- 2.81% ✓
- Cap rate
- 24.62%
- Cash-on-cash
- 65.47%
- DSCR
- 3.91
- GRM
- 3.0
CMA / ARV
No comps found within radius.
Projected returns pro-forma
-3.0% appreciation · 3.0% rent growth · sell at horizon
- IRR
- 55.9%
- Equity multiple
- 3.47×
- Total profit
- $24,205
- Equity at exit
- $5,219
- IRR
- 60.9%
- Equity multiple
- 7.09×
- Total profit
- $59,703
- Equity at exit
- $3,026
Cash invested: $9,800 (down + closing). Projections, not guarantees.
Landlord ↔ Tenant lean methodology
- Overall (STATE)
- 81 Strongly Landlord-Friendly
- State Missouri
- 81 Strongly Landlord-Friendly · R+10
- County
- — inherits STATE
- City
- — inherits STATE
ZIP-level market 65324
- Home prices YoY
- -21.0%
- Active inventory
- 57
- Price-to-rent
- 3.0×
Monthly cashflow live
- Estimated rent
- $983 medium interval (Pro) →
- Mortgage (P&I)
- −$184
- Tax est. 1.5%
- −$44 /mo · $525/yr
- Insurance
- −$15
- Flood insurance flood zone
- −$66 /mo · $798/yr
- HOA
- −$0
- Vacancy / Maint / Mgmt
- −$206
- Net cashflow
- $468
Break-even live
UW: 25.0% down · 7.5% · 30yr · 1.5% tax · 5.0% vac · 8.0% maint · 8.0% mgmt
Financing live
Cash to close
- Down payment
- $8,750
- Closing costs
- $1,050
- Reserves months
- —
- Total cash needed
- —
Loan-product check · same deal, 3 products live
Conventional
25% down · 7.5% · 30yr
- Down + closing
- —
- Monthly P&I
- —
- Monthly cashflow
- —
- DSCR
- —
- Eligible?
- —
Personal DTI + credit; lowest rate.
DSCR
20% down · 8.5% · 30yr
- Down + closing
- —
- Monthly P&I
- —
- Monthly cashflow
- —
- DSCR
- —
- Eligible?
- —
No personal income docs; deal must DSCR.
Hard money
10% down · 12.0% · 12mo
- Down + closing
- —
- Monthly P&I
- —
- Monthly cashflow
- —
- DSCR
- —
- Eligible?
- —
Short-term bridge; refi at stabilization.
Listing history 19 events
-
2026-05-31days on market $35,000 Active 236 DOM
-
2026-05-31days on market $35,000 Active 235 DOM
-
2025-10-07$35,000 Active 634-char remark
Show marketing remark (634 chars)
Investors and DIYers, this one is for you! Priced at only $35k! Seller has replaced electrical, plumbing, water heater, and started on the drywall and bathroom remodel. Selling in as-is condition. Just a walk away from Lake of the Ozarks and an access boat ramp on the 50 Mile Marker. Same cove as Red Fox--great water location! With a flat yard and backing up to woods, this home has potential to be an affordable lake getaway, long term rental, or flip. Private well and septic with no hoa. Home will not qualify for any type of loan. Storage shed and all building materials included! CoMo high speed fiber optic internet available!
-
2025-01-15price $49,900
-
2025-01-01historical
-
2024-11-18price $49,900
-
2024-10-15price $54,900
-
2024-10-15price $54,900
-
2024-10-14$59,900 Active
-
2024-10-14$59,900 Active
-
2024-08-27status Pending
-
2024-08-22historical
-
2024-07-29price $57,500
-
2024-04-24price $125,000
-
2024-02-24price $59,995
-
2024-01-17$60,000 Active
-
2022-12-14$95,900 Active
-
2022-07-12soldstatus
-
1965-12-01soldstatus
ⓘ Source: listings_history table (triggers on properties + properties_extension) + one-shot
backfill from property_details.listing_events for pre-trigger history.
Climate risk First Street
- Flood 8/10 Severe FEMA zone X (unshaded) · 99% chance over 30 yrs
- Wildfire 5/10 Major
- Heat 4/10 Moderate 7 d/yr ≥107°F today · 19 d/yr by 30 yrs out
- Wind 2/10 Low
- Air quality 2/10 Low 0 unhealthy d/yr today · 1 by 30 yrs out
Nearby sold comps map
Loading sold comps map…
Walkable amenities ~0.75 mi
Loading nearby amenities…
Taxation est. · year 1
- Rental income
- $11,796
- − Mortgage interest
- −$1,961
- − Property taxes
- −$525
- − Insurance
- −$972
- − Repairs & maintenance
- −$944
- − Management
- −$944
- − Depreciation
- −$1,018
- Taxable income
- $5,432
- Est. tax owed @ 24.0%
- −$1,304
- After-tax cash flow
- $4,315/yr
For passive investors: Depreciation is non-cash, so a rental often shows a tax loss while cash-flowing — sheltering income. Rental losses are passive: they offset passive income freely, and up to $25,000/yr can offset ordinary (W-2) income if you actively participate and your MAGI is under $100k (phasing out to $0 by $150k); unused losses carry forward. On sale, claimed depreciation is recaptured at up to 25%, and gains may owe capital-gains tax (a 1031 exchange can defer both). Figures are a year-1 estimate at your 24.0% rate — not tax advice; consult a CPA.
Schools (NCES district)
- District
- Climax Springs R-IV
- NCES district ID
- 2909810
- Math proficiency
- 25% ▼ -5.00%
- Reading proficiency
- 40% ▼ -10.00%
- Median HH income
- $39,548
- Composite
- 29.98/100
- National rank
- #11648
- State rank
- #431 of 535 in MO
Livability — Climax Springs
- Score
- 50/100
- State rank
- #910
- US rank
- #25720
Category grades
Schools grade is shown separately in the Schools card above.
Census & demographics
- Population (ZIP)
- 1,296
Population outlook (Camden County) Hauer SSP2
- Today (2025)
- 44,585 people
- By 2030
- 44,476 · -0.2%
- By 2040
- 43,513 · -2.4%
- By 2050
- 41,705 · -6.5%
- By 2075
- 36,903 · -17.2%
- By 2100
- 30,164 · -32.3%
Race, ethnicity, and origin ACS 2023
- Neighborhood character
- Predominantly White (89%)
- Race & ethnicity
- White 89% Two or more races 7% Hispanic / Latino 2% Black 1%
- Common ancestry
- Lithuanian 5% Romanian 2% Slovak 2%
- Foreign-born
- 0% · Canada
- Languages at home
- 97% English-only · Spanish 3%
Political lean MEDSL · Camden
- 2024 margin
- Solid R (+54.3) · D 22.4% · R 76.7%
- 2008→2024 swing
- -25.8pp toward R · 2008: -28.5pp · 2024: -54.3pp
- All cycles
- 2024: R+54.3 2020: R+53.2 2016: R+54.2 2012: R+39.3 2008: R+28.5
Not yet ingested
- Civics
- —
Market trends
- HPI YoY
- ▼ -44.71%
- Current HPI
- 168.5139
- Rent YoY
- —
- Metro
- —
- State GDP YoY
- ▲ 1.84%
- F500 in state
- 20
Industry mix (Fortune 500 HQ in MO)
| Industry | F500 HQs | Revenue |
|---|---|---|
| Healthcare | 1 | $163B |
|
||
| Insurance | 1 | $21B |
|
||
| Industrial Technology | 1 | $17B |
|
||
| Retail | 1 | $16B |
|
||
| Industrial Distribution | 1 | $10B |
|
||
| Utilities | 1 | $9B |
|
||
Price history
-63.5% since first listed17 events — show timeline
- 2025-10-07 Listed $35,000 LOBR
- 2025-01-15 Price Changed $49,900 LOBR
- 2025-01-01 Delisted — LOBR
- 2024-11-18 Price Changed $49,900 WCAR
- 2024-10-15 Price Changed $54,900 WCAR
- 2024-10-15 Price Changed $54,900 LOBR
- 2024-10-14 Listed $59,900 WCAR
- 2024-10-14 Listed $59,900 LOBR
- 2024-08-27 Pending — Heartland MLS as Distributed by MLS Grid
- 2024-08-22 Listing Removed — Heartland MLS as Distributed by MLS Grid
- 2024-07-29 Price Changed $57,500 Heartland MLS as Distributed by MLS Grid
- 2024-04-24 Price Changed $125,000 Heartland MLS as Distributed by MLS Grid
- 2024-02-24 Price Changed $59,995 Heartland MLS as Distributed by MLS Grid
- 2024-01-17 Listed $60,000 Heartland MLS as Distributed by MLS Grid
- 2022-12-14 Listed $95,900 SOMO
- 2022-07-12 Sold (Public Records) — Public Records
- 1965-12-01 Sold (Public Records) — Public Records
Property tax history
+0.4%/yrLatest (2025): $5 · +0.0% YoY. Source: county tax records.
Cash-flow waterfall
monthlySold comps — $/sqft
last 12 mo · ≤1 miLoading sold comps…