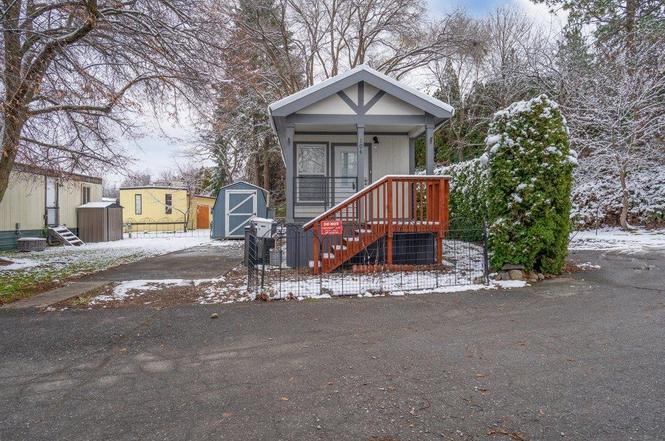
6300 E 2nd Ave #104 · Spokane Valley, WA
Flood risk 1/10 · Minimal
- FEMA flood zone
- X (unshaded)
- Chance of flooding over 30 yrs
- 0.0%
- Est. flood insurance / yr
- $507 – $1,088
Fire risk 6/10 · Moderate
- Est. fire insurance / yr
- $604 – $1,122
Heat risk 3/10 · Minor
- Hot days now (above 93°F)
- 7 days/yr
- Hot days in 30 yrs
- 15 days/yr
Wind risk 1/10 · Minimal
- Chance of severe wind over 30 yrs
- —
Air-quality risk 9/10 · Severe
- Unhealthy air days now
- 17 days/yr
- Unhealthy air days in 30 yrs
- 17 days/yr
Risk factors via First Street. Map © Google.
Why this score? — see what drove the B grade
The composite is a weighted blend of 9 inputs, each scored 0–100. Each bar is that input's sub-score; the figure is the points it added to the 100-point composite (weight × sub-score).
- Cash flow +30.0/30.0
- DSCR +10.0/10.0
- 1% rule +8.5/10.0
- ARV discount +7.5/15.0
- Schools +4.6/10.0
- Livability +4.2/5.0
- Rent growth +3.4/5.0
- Condition / age +2.5/5.0
- Appreciation +0.0/10.0
$85,000
🖨 Deal sheet 📄 Offer letter ✓ Due diligence
Listing remarks
Charming 1 bed, 1 bath home in the quiet 55+ Valley breeze community! This home offers a warm, modern feel the moment you step onto the covered front porch. Inside, you’ll find a spacious layout with stylish finishes throughout, including crown molding and tasteful trim work. The living area is bright and cozy, featuring a shiplap accent wall, mounted TV space, and an efficient stove for added comfort. The kitchen is truly impressive for its size—complete with white cabinetry, sleek hardware, tile backsplash, upgraded fixtures, a deep stainless-steel farmhouse sink, gas range, and plenty of storage. The bedroom is well-appointed with great natural light and built-in cabinetry, a
Key facts
- Covered front porch
- Ample counter space
- Shiplap accent wall
Tags
Property features AI
Finance
- Financial info: Land lease: $585/month
Exterior
- Parking: Slab parking
- Home design: Manufactured home (2022 Athens); Skirted foundation
- Construction: Masonite siding; Metal roof
- Exterior features: Deck; Treed and level lot; City street frontage
Interior
- Bedrooms: 1 bedroom
- Heating & cooling: Natural gas heating; Electric heating
- Interior features: No basement; Doorways at least 32 inches wide (accessible)
Neighborhood map
What this means for you Summary
Snapshot
- This is a 1-bed/1.0-bath manufactured listed at $85k.
Deal economics
- At list price, monthly cash flow is $321 ($4k/yr) — positive.
- The deal already cash-flows at list — no discount required.
- Meets the 1% rule at list price ($1k rent vs $85k).
- Recommended offer: $77k (9.0% below list) — sets the bar for market timing.
- Cap rate 10.8% vs local median 3.0% in Spokane Valley — top-decile yield for the area; either an underpriced asset or a hidden risk that comps aren't pricing in. Stress-test before assuming the spread holds.
Location & tenants
- Location reads 85/100 on livability (#31 in WA, #512 nationally) — a professional / high-income tenant draw. Strengths: amenities A+, commute A+, housing A+; Watch: crime D+.
- Spokane School District (urban): math 47% / reading 58% proficiency, ranked #136 of 291 in WA (top 47%) — acceptable for families but not a draw, mixed tenant base, ~2y average lease.
- Market conditions: Rents rising (+3.5%/yr); 187 active listings in the ZIP; 10 comparable units currently listed for rent nearby; rentals at typical pace (median 24d on market — plan ~3-4 weeks tenant-placement turnaround); 3,608 units permitted in Spokane County in 2024 (1,792 in 5+ unit buildings).
Forward outlook
- Local home prices are declining (-3.0%/yr); year-one equity from $588 of loan paydown is wiped out by about $3k of value loss. Plan a longer hold.
- Spokane County population projected at +13% by 2050 — modest demand growth; plan on rents tracking national, not racing it.
- At projected returns (-3.0% appreciation + 3.5% rent growth), your $24k cash investment doubles in ~8 years — after that, you're playing with house money.
Negotiation context
- It's been on market 113 days — a 9% lower offer ($77k) is reasonable based on typical stale-listing flexibility.
- 3 sale attempts; this cycle's ask has dropped $9k (10%) from the opening price — seller is motivated, your offer sets the floor, not the list.
Risks & watch-outs
- Climate carrying-cost: major wildfire risk — expect insurance premiums to compound above CPI over the hold.
Questions for the listing agent
- It's been on market 113 days. Have you received any prior offers? Is the seller open to a 9% concession, seller financing, or rate buy-down credit?
- Why hasn't it sold? Are there any deal-killer items the seller is aware of (foundation, flood, title, zoning, code violations)?
- Is there a deadline driving the sale (1031 exchange, divorce, estate, relocation)? That informs how much negotiation room exists.
- Schools are B-rated — typically a magnet for longer-tenancy family renters. What's the average tenant stay here, and is there a school-zone premium baked into asking?
- Crime grade is D in this area — have there been break-ins, vandalism, or insurance claims at this property in the last 3 years? What carrier currently insures it and at what premium?
- What's the average days-on-market for RENTAL listings here right now (not sales)? A rising rental-DOM trend means longer vacancies and softer asking-rent achievability than the comps imply.
- What's the recent tenant-quality profile in this submarket — average credit score on applications, eviction rate, late-payment / NSF rate, and stable-employment percentage? A property-management company in the area should have these aggregated.
- How much new for-sale + rental construction is in the pipeline within 1–3 miles? Heavy new supply typically softens prices + rents 12–24 months out; constrained supply supports both.
Investment metrics
- 1% rule
- 1.35% ✓
- Cap rate
- 10.83%
- Cash-on-cash
- 16.19%
- DSCR
- 1.72
- GRM
- 6.2
CMA / ARV
No comps found within radius.
Projected returns pro-forma
-3.0% appreciation · 3.49% rent growth · sell at horizon
- IRR
- 7.8%
- Equity multiple
- 1.31×
- Total profit
- $7,265
- Equity at exit
- $12,674
- IRR
- 17.5%
- Equity multiple
- 2.47×
- Total profit
- $35,093
- Equity at exit
- $7,349
Cash invested: $23,800 (down + closing). Projections, not guarantees.
Landlord ↔ Tenant lean methodology
- Overall (STATE)
- 28 Tenant-Leaning
- State Washington
- 28 Tenant-Leaning · D+8
- County
- — inherits STATE
- City
- — inherits STATE
ZIP-level market 99212
- Rents YoY
- 3.5%
- Active inventory
- 187
- Price-to-rent
- 6.2×
Monthly cashflow live
- Estimated rent
- $1,150 high interval (Pro) →
- Mortgage (P&I)
- −$446
- Tax est. 1.5%
- −$106 /mo · $1,275/yr
- Insurance
- −$35
- HOA
- −$0
- Vacancy / Maint / Mgmt
- −$242
- Net cashflow
- $321
Break-even live
UW: 25.0% down · 7.5% · 30yr · 1.5% tax · 5.0% vac · 8.0% maint · 8.0% mgmt
Financing live
Cash to close
- Down payment
- $21,250
- Closing costs
- $2,550
- Reserves months
- —
- Total cash needed
- —
Loan-product check · same deal, 3 products live
Conventional
25% down · 7.5% · 30yr
- Down + closing
- —
- Monthly P&I
- —
- Monthly cashflow
- —
- DSCR
- —
- Eligible?
- —
Personal DTI + credit; lowest rate.
DSCR
20% down · 8.5% · 30yr
- Down + closing
- —
- Monthly P&I
- —
- Monthly cashflow
- —
- DSCR
- —
- Eligible?
- —
No personal income docs; deal must DSCR.
Hard money
10% down · 12.0% · 12mo
- Down + closing
- —
- Monthly P&I
- —
- Monthly cashflow
- —
- DSCR
- —
- Eligible?
- —
Short-term bridge; refi at stabilization.
Rent comps 10 comps
| Address | Beds | Baths | Sqft | Rent | $/sqft | DOM | Units | Dist |
|---|---|---|---|---|---|---|---|---|
| 402 S Eastern Rd Spokane Valley, WA | 1.0–2.0 | 1.0 | 715 | $950 | $1.33 | 14d | 3 | 0.15mi |
| 6121 E 6th Ave Spokane Valley, WA | 1.0 | 1.0 | 585 | $1,150 | $1.97 | 23d | 1 | 0.20mi |
| 6020 E 4th Ave Spokane Valley, WA | 1.0–2.0 | 1.0–2.0 | 735 | $1,395 | $1.90 | 14d | 5 | 0.25mi |
| 7313 E 6th Ave Unit 5 Spokane Valley, WA | — | 1.0 | 550 | $1,000 | $1.82 | 23d | 1 | 0.69mi |
| 7419 E 4th Ave Unit 5 Spokane Valley, WA | — | 1.0 | 400 | $925 | $2.31 | 23d | 1 | 0.74mi |
| 7419 E 4th Ave Apt 2 Spokane Valley, WA | — | 1.0 | 400 | $925 | $2.31 | 14d | 1 | 0.74mi |
| 225 S Dearborn Rd Unit 4 Spokane Valley, WA | 2.0 | 1.0 | 560 | $1,150 | $2.05 | 23d | 1 | 1.12mi |
| 4405 E 5th Ave Spokane Valley, WA | 2.0 | 1.0 | 650 | $1,175 | $1.81 | 14d | 2 | 1.17mi |
| 4405 E 5th Ave Unit 36 Spokane Valley, WA | 2.0 | 1.0 | 640 | $1,150 | $1.80 | 23d | 1 | 1.20mi |
| 916 N Ella Rd Unit 16 Spokane Valley, WA | 2.0 | 1.0 | 750 | $1,200 | $1.60 | 43d | 1 | 1.22mi |
Listing history 20 events
-
2026-06-18days on market $85,000 Active 113 DOM
-
2026-06-17days on market $85,000 Active 112 DOM
-
2026-06-16days on market $85,000 Active 111 DOM
-
2026-06-15days on market $85,000 Active 110 DOM
-
2026-06-14days on market $85,000 Active 108 DOM
-
2026-06-10days on market $85,000 Active 105 DOM
-
2026-06-09days on market $85,000 Active 104 DOM
-
2026-06-08days on market $85,000 Active 103 DOM
-
2026-06-07days on market $85,000 Active 102 DOM
-
2026-06-03days on market $85,000 Active 98 DOM
-
2026-06-02days on market $85,000 Active 97 DOM
-
2026-06-01days on market $85,000 Active 96 DOM
-
2026-05-31days on market $85,000 Active 95 DOM
-
2026-05-31days on market $85,000 Active 94 DOM
-
2026-03-02price $85,000
-
2026-02-25$94,000 Active
-
2026-02-23historical
-
2026-01-27price $94,000
-
2025-12-18$99,999 Active
-
2025-12-05$99,999 Active
ⓘ Source: listings_history table (triggers on properties + properties_extension) + one-shot
backfill from property_details.listing_events for pre-trigger history.
Climate risk First Street
- Flood 1/10 Low FEMA zone X (unshaded) · 0% chance over 30 yrs
- Wildfire 6/10 Major
- Heat 3/10 Moderate 7 d/yr ≥93°F today · 15 d/yr by 30 yrs out
- Wind 1/10 Low
- Air quality 9/10 Extreme 17 unhealthy d/yr today · 17 by 30 yrs out
Nearby sold comps map
Loading sold comps map…
Walkable amenities ~0.75 mi
Loading nearby amenities…
Taxation est. · year 1
- Rental income
- $13,800
- − Mortgage interest
- −$4,761
- − Property taxes
- −$1,275
- − Insurance
- −$425
- − Repairs & maintenance
- −$1,104
- − Management
- −$1,104
- − Depreciation
- −$2,473
- Taxable income
- $2,658
- Est. tax owed @ 24.0%
- −$638
- After-tax cash flow
- $3,215/yr
For passive investors: Depreciation is non-cash, so a rental often shows a tax loss while cash-flowing — sheltering income. Rental losses are passive: they offset passive income freely, and up to $25,000/yr can offset ordinary (W-2) income if you actively participate and your MAGI is under $100k (phasing out to $0 by $150k); unused losses carry forward. On sale, claimed depreciation is recaptured at up to 25%, and gains may owe capital-gains tax (a 1031 exchange can defer both). Figures are a year-1 estimate at your 24.0% rate — not tax advice; consult a CPA.
Schools (NCES district)
- District
- Spokane School District
- NCES district ID
- 5308250
- Math proficiency
- 47% ▲ 1.00%
- Reading proficiency
- 58% ▲ 1.00%
- Median HH income
- $43,187
- Composite
- 46.1/100
- National rank
- #5477
- State rank
- #136 of 291 in WA
Livability — Spokane Valley
- Score
- 85/100
- State rank
- #31
- US rank
- #512
Category grades
Schools grade is shown separately in the Schools card above.
Census & demographics
- Census place
- Spokane Valley, WA
- County
- Spokane County · 496,401 people
- City population
- 129,511
- Metro
- Spokane-Spokane Valley, WA
- Population (ZIP)
- 21,707
- Household income
- $67,049
- Rent vs Own
- Severe rent burden
- 842.0
Population outlook (Spokane County) Hauer SSP2
- Today (2025)
- 531,314 people
- By 2030
- 549,278 · +3.4%
- By 2040
- 577,822 · +8.8%
- By 2050
- 598,188 · +12.6%
- By 2075
- 630,744 · +18.7%
- By 2100
- 622,360 · +17.1%
Race, ethnicity, and origin ACS 2023
- Neighborhood character
- Predominantly White (86%)
- Race & ethnicity
- White 86% Two or more races 8% Hispanic / Latino 6%
- Hispanic origin (detail)
- Mexican 4%
- Common ancestry
- Portuguese 4% Slovak 3% Lithuanian 3%
- Foreign-born
- 4% · Canada
- Languages at home
- 95% English-only · Russian/Polish/Slavic 3% Spanish 2%
Political lean MEDSL · Spokane
- 2024 margin
- Toss-up / Even · D 46.0% · R 51.0% · Other 3.0%
- 2008→2024 swing
- -3.8pp toward R · 2008: -1.1pp · 2024: -5.0pp
- All cycles
- 2024: R+5.0 2020: R+4.3 2016: R+8.3 2012: R+6.3 2008: R+1.1
Not yet ingested
- Civics
- —
Market trends
- HPI YoY
- ▼ -316.37%
- Current HPI
- 361.41
- Rent YoY
- ▲ 3.49%
- Metro
- Spokane-Spokane Valley, WA
- State GDP YoY
- ▲ 4.65%
- F500 in state
- 22
Industry mix (Fortune 500 HQ in WA)
| Industry | F500 HQs | Revenue |
|---|---|---|
| Retail | 2 | $269B |
|
||
| Technology / Retail | 1 | $638B |
|
||
| Technology | 1 | $245B |
|
||
| Telecommunications | 1 | $38B |
|
||
| Food / Beverage | 1 | $36B |
|
||
| Automotive / Trucks | 1 | $34B |
|
||
Price history
-15.0% since first listed6 events — show timeline
- 2026-03-02 Price Changed $85,000 SPOKANEMLS as Distributed by MLS Grid
- 2026-02-25 Listed $94,000 SPOKANEMLS as Distributed by MLS Grid
- 2026-02-23 Listing Removed — SPOKANEMLS as Distributed by MLS Grid
- 2026-01-27 Price Changed $94,000 SPOKANEMLS as Distributed by MLS Grid
- 2025-12-18 Listed $99,999 SPOKANEMLS as Distributed by MLS Grid
- 2025-12-05 Listed $99,999 SPOKANEMLS as Distributed by MLS Grid
Cash-flow waterfall
monthlySold comps — $/sqft
last 12 mo · ≤1 miLoading sold comps…