 Multi-family
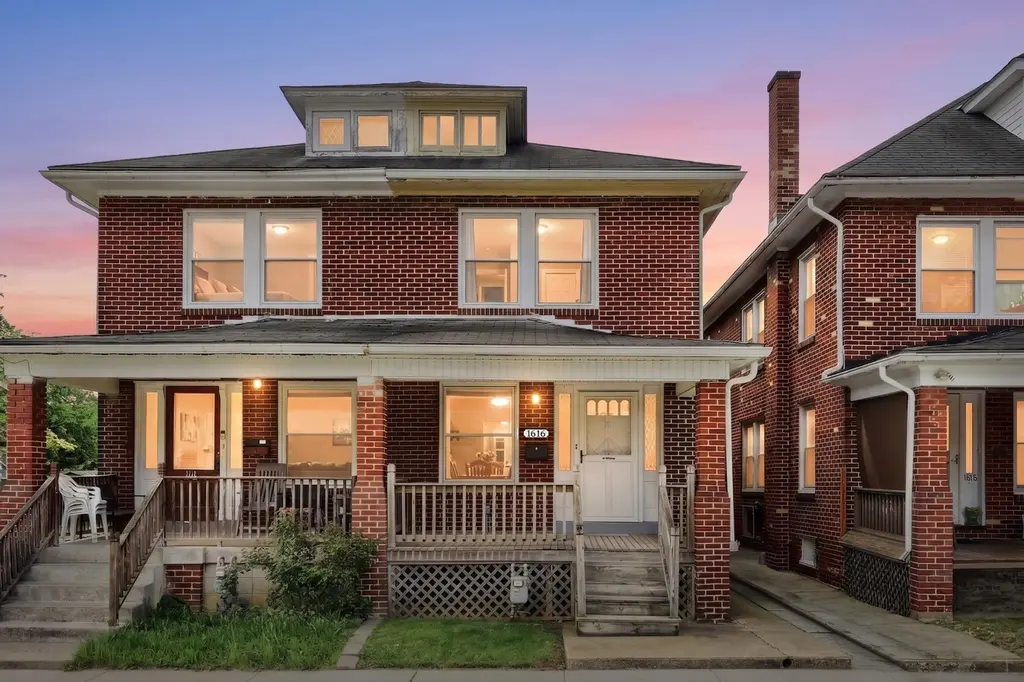
1616 W Philadelphia St · West York, PA
Flood risk 3/10 · Minor
- FEMA flood zone
- X (unshaded)
- Chance of flooding over 30 yrs
- 0.2%
- Est. flood insurance / yr
- $473 – $860
Fire risk 1/10 · Minimal
- Est. fire insurance / yr
- $511 – $949
Heat risk 6/10 · Moderate
- Hot days now (above 103°F)
- 7 days/yr
- Hot days in 30 yrs
- 15 days/yr
Wind risk 4/10 · Minor
- Chance of severe wind over 30 yrs
- 11.0%
Air-quality risk 3/10 · Minor
- Unhealthy air days now
- 2 days/yr
- Unhealthy air days in 30 yrs
- 4 days/yr
Risk factors via First Street. Map © Google.
Why this score? — see what drove the B grade
The composite is a weighted blend of 9 inputs, each scored 0–100. Each bar is that input's sub-score; the figure is the points it added to the 100-point composite (weight × sub-score).
- Cash flow +30.0/30.0
- 1% rule +10.0/10.0
- DSCR +10.0/10.0
- ARV discount +7.5/15.0
- Rent growth +4.1/5.0
- Livability +3.7/5.0
- Schools +3.2/10.0
- Condition / age +2.5/5.0
- Appreciation +0.0/10.0
$179,000
🖨 Deal sheet 📄 Offer letter ✓ Due diligence
Multi-family units
County records classify this as Multi-Family (2-4 Unit). Listing-text estimate: 1 unit. estimate disagrees with records
Listing remarks MLS
HUD OWNED. CASE#441-587187. ALL BIDS & PROPERTY AVAILABILITY THRU THE R INTERNET WWW. GOLDENFEATHER. COM. INSURED W/ REPAIR ESCROW OF 1155.00 FOR FHA 203B FINANCING. SOLD AS IS. NONCASH BUYERS MUST HAVE WRITTEN PRE- APPROVAL PRIOR TO MAKING BID. BUYER PAYS ALL TRANSFER TAX(2%). LAST SOLD IN 1998 FOR 80,000. GREAT BUY IN WEST YORK. |
Key facts
- Garage
- Built 1925
- Listed 3 days
Property features AI
Exterior
- Parking: Detached side-entry garage (1 space); On-street parking
- Utilities: Public water; Public sewer; Electric for cooling and hot water; Natural gas heating
- Home design: Semi-detached property; Estimated year built
- Construction: Brick construction; Asphalt shingle roof; Block foundation; Garage structure
- Exterior features: Level lot; Wood fencing; Other exterior features
Interior
- Bedrooms: 2 bedrooms on the upper level
- Flooring: Carpet; Wood
- Bathrooms: 2 full bathrooms (both on the upper level)
- Heating & cooling: Forced air heating; Window air conditioning units; Electric hot water
- Interior features: Formal separate dining room; Full poured concrete basement; Accessible doors 32+ inches wide
- Laundry & utility: Laundry on upper floor
Neighborhood map
What this means for you Summary
Snapshot
- This is a 3-bed/1.0-bath multifamily listed at $179k.
Deal economics
- At list price, monthly cash flow is $1k ($16k/yr) — positive.
- The deal already cash-flows at list — no discount required.
- Meets the 1% rule at list price ($3k rent vs $179k).
- Cap rate 15.2% vs local median 3.8% in West York — top-decile yield for the area; either an underpriced asset or a hidden risk that comps aren't pricing in. Stress-test before assuming the spread holds.
Location & tenants
- Location reads 74/100 on livability (#488 in PA, #4,486 nationally) — a middle-class / working-renter tenant base. Strengths: cost of living A+, health & safety A+, housing A; Watch: employment D, amenities F, commute F.
- West York Area SD (suburban): math 29% / reading 45% proficiency, ranked #379 of 539 in PA (top 70%) — families likely to look elsewhere, expect single-tenant / working-renter base with shorter leases.
- Market conditions: Rents rising fast (+6.4%/yr); 249 active listings in the ZIP; 19 comparable units currently listed for rent nearby; rentals leasing fast (median 14d on market — plan ~1-2 weeks tenant-placement turnaround); solid renter incomes; 1,328 units permitted in York County in 2024 (338 in 5+ unit buildings).
- At $3,314/mo this rent would consume 51% of the median local household income ($79k/yr) (locally 722% of renters already pay >50% of income on rent) — very limited rent-growth headroom before tenants either downsize or default.
Forward outlook
- Local home prices are declining (-3.0%/yr); year-one equity from $1k of loan paydown is wiped out by about $5k of value loss. Plan a longer hold.
- At projected returns (-3.0% appreciation + 6.4% rent growth), your $50k cash investment doubles in ~4 years — after that, you're playing with house money.
Negotiation context
- Only 3 days on market — expect competitive offers; lowballing is unlikely to land.
- 3 sale attempts since 28y ago with the ask held roughly flat each time — persistent listings suggest the price (not the market) is what's stuck; bring a comps-based counter.
- Current owner paid $62k; list at $179k implies a 189% gain — meaningful room to come down on a strong offer.
Risks & watch-outs
- Watch-outs: built in 1925 — expect roof / HVAC / electrical / plumbing capex.
- Climate carrying-cost: extreme-heat days projected 7→15/yr by 2055 (HVAC capex compounding) — expect insurance premiums to compound above CPI over the hold.
Questions for the listing agent
- Built in 1925 — when were the roof, HVAC, electrical panel, plumbing, and water heater last replaced?
- Is there a deadline driving the sale (1031 exchange, divorce, estate, relocation)? That informs how much negotiation room exists.
- What's the average days-on-market for RENTAL listings here right now (not sales)? A rising rental-DOM trend means longer vacancies and softer asking-rent achievability than the comps imply.
- What's the recent tenant-quality profile in this submarket — average credit score on applications, eviction rate, late-payment / NSF rate, and stable-employment percentage? A property-management company in the area should have these aggregated.
- How much new apartment / multifamily construction is in the pipeline within 1–3 miles? Heavy new supply (>2% of stock underway) typically softens rents 12–24 months out; light construction supports rent growth.
Investment metrics
- 1% rule
- 1.85% ✓
- Cap rate
- 15.19%
- Cash-on-cash
- 31.79%
- DSCR
- 2.41
- GRM
- 4.5
CMA / ARV
No comps found within radius.
Projected returns pro-forma
-3.0% appreciation · 6.38% rent growth · sell at horizon
- IRR
- 30.6%
- Equity multiple
- 2.34×
- Total profit
- $67,293
- Equity at exit
- $26,689
- IRR
- 39.7%
- Equity multiple
- 5.37×
- Total profit
- $219,081
- Equity at exit
- $15,477
Cash invested: $50,120 (down + closing). Projections, not guarantees.
Landlord ↔ Tenant lean methodology
- Overall (STATE)
- 62 Landlord-Friendly
- State Pennsylvania
- 62 Landlord-Friendly · EVEN
- County
- — inherits STATE
- City
- — inherits STATE
ZIP-level market 17404
- Rents YoY
- 6.4%
- Active inventory
- 249
- Price-to-rent
- 13.5×
Monthly cashflow live
- Estimated rent
- $3,314 medium interval (Pro) →
- Mortgage (P&I)
- −$939
- Tax from tax record
- −$277 /mo · $3,325/yr
- Insurance
- −$75
- HOA
- −$0
- Vacancy / Maint / Mgmt
- −$696
- Net cashflow
- $1,328
Break-even live
3-unit breakdown (identical units grouped — click to expand)
| Units | Beds | Baths | Est. rent |
|---|---|---|---|
| 3× units | 2 | 2 | $3,315 |
| #1 | 2 | 2 | $1,105 |
| #2 | 2 | 2 | $1,105 |
| #3 | 2 | 2 | $1,105 |
| Total (3 units) | $3,314 | ||
UW: 25.0% down · 7.5% · 30yr · 1.5% tax · 5.0% vac · 8.0% maint · 8.0% mgmt
Financing live
Cash to close
- Down payment
- $44,750
- Closing costs
- $5,370
- Reserves months
- —
- Total cash needed
- —
Loan-product check · same deal, 3 products live
Conventional
25% down · 7.5% · 30yr
- Down + closing
- —
- Monthly P&I
- —
- Monthly cashflow
- —
- DSCR
- —
- Eligible?
- —
Personal DTI + credit; lowest rate.
DSCR
20% down · 8.5% · 30yr
- Down + closing
- —
- Monthly P&I
- —
- Monthly cashflow
- —
- DSCR
- —
- Eligible?
- —
No personal income docs; deal must DSCR.
Hard money
10% down · 12.0% · 12mo
- Down + closing
- —
- Monthly P&I
- —
- Monthly cashflow
- —
- DSCR
- —
- Eligible?
- —
Short-term bridge; refi at stabilization.
Rent comps 19 comps
| Address | Beds | Baths | Sqft | Rent | $/sqft | DOM | Units | Dist |
|---|---|---|---|---|---|---|---|---|
| 1627 Filbert St York, PA | 3.0 | 1.0 | 1193 | $1,395 | $1.17 | 21d | 1 | 0.12mi |
| 1410 Monroe St Ste M West York, PA | 2.0 | 1.0 | 1100 | $1,195 | $1.09 | 21d | 1 | 0.32mi |
| 50 S Highland Ave York, PA | 2.0–3.0 | 1.0–1.5 | 1015 | $1,394 | $1.37 | 13d | 1 | 0.35mi |
| 1559 W King St Unit 2 West York, PA | 3.0 | 1.0 | 1020 | $1,250 | $1.23 | 13d | 1 | 0.38mi |
| 101 N Forrest St York, PA | 3.0 | 1.0 | 1340 | $1,695 | $1.26 | 21d | 1 | 0.62mi |
| 813 Madison Ave York, PA | 2.0 | 1.5 | 1100 | $1,175 | $1.07 | 13d | 1 | 0.79mi |
| 200 Weldon Dr York, PA | 1.0–2.0 | 1.0–2.0 | 993 | $1,800 | $1.81 | 13d | 10 | 0.86mi |
| 925 W College Ave York, PA | 4.0 | 1.0 | 1660 | $1,425 | $0.86 | 13d | 1 | 0.94mi |
| 132 N West St York, PA | 4.0 | 1.0 | 1560 | $1,600 | $1.03 | 13d | 1 | 1.09mi |
| 588 Company St York, PA | 3.0 | 1.5 | 1416 | $1,475 | $1.04 | 43d | 1 | 1.13mi |
| 648 W College Ave York, PA | 3.0 | 1.0 | 1100 | $1,275 | $1.16 | 43d | 1 | 1.18mi |
| 631 Roosevelt Ave Unit 2 York, PA | 3.0 | 1.0 | 1170 | $1,150 | $0.98 | 13d | 1 | 1.19mi |
| 720 Elm Ter York, PA | 3.0 | 1.5 | 1200 | $1,950 | $1.62 | 21d | 1 | 1.24mi |
| 450 Madison Ave York, PA | 1.0–2.0 | 1.0 | 862 | $1,250 | $1.45 | 13d | 1 | 1.27mi |
| 231 Roosevelt Ave York, PA | 3.0 | 1.5 | 1584 | $1,750 | $1.10 | 13d | 1 | 1.34mi |
| 216 Park Pl York, PA | 4.0 | 1.0 | 1192 | $1,350 | $1.13 | 13d | 1 | 1.37mi |
| 1060 Crest Way York, PA | 1.0–2.0 | 1.0–2.0 | 1033 | $1,850 | $1.79 | 43d | 1 | 1.40mi |
| 1060 Crest Way York, PA | 2.0 | 2.0 | 1251 | $1,850 | $1.48 | 13d | 1 | 1.40mi |
| 466 W College Ave York, PA | 3.0 | 1.0 | 1068 | $1,295 | $1.21 | 43d | 1 | 1.44mi |
Listing history 11 events
-
2026-04-30status Pending
-
2026-04-28$179,000 Active
-
2026-04-24historical $179,000
-
2002-01-04soldstatus $62,000
-
2001-12-13soldstatus $62,000 340-char remark
Show marketing remark (340 chars)
HUD OWNED. CASE#441-587187. ALL BIDS & PROPERTY AVAILABILITY THRU THE R INTERNET WWW. GOLDENFEATHER. COM. INSURED W/ REPAIR ESCROW OF 1155.00 FOR FHA 203B FINANCING. SOLD AS IS. NONCASH BUYERS MUST HAVE WRITTEN PRE- APPROVAL PRIOR TO MAKING BID. BUYER PAYS ALL TRANSFER TAX(2%). LAST SOLD IN 1998 FOR 80,000. GREAT BUY IN WEST YORK. |
-
2001-11-13historical 340-char remark
Show marketing remark (340 chars)
HUD OWNED. CASE#441-587187. ALL BIDS & PROPERTY AVAILABILITY THRU THE R INTERNET WWW. GOLDENFEATHER. COM. INSURED W/ REPAIR ESCROW OF 1155.00 FOR FHA 203B FINANCING. SOLD AS IS. NONCASH BUYERS MUST HAVE WRITTEN PRE- APPROVAL PRIOR TO MAKING BID. BUYER PAYS ALL TRANSFER TAX(2%). LAST SOLD IN 1998 FOR 80,000. GREAT BUY IN WEST YORK. |
-
2001-11-02$63,000 340-char remark
Show marketing remark (340 chars)
HUD OWNED. CASE#441-587187. ALL BIDS & PROPERTY AVAILABILITY THRU THE R INTERNET WWW. GOLDENFEATHER. COM. INSURED W/ REPAIR ESCROW OF 1155.00 FOR FHA 203B FINANCING. SOLD AS IS. NONCASH BUYERS MUST HAVE WRITTEN PRE- APPROVAL PRIOR TO MAKING BID. BUYER PAYS ALL TRANSFER TAX(2%). LAST SOLD IN 1998 FOR 80,000. GREAT BUY IN WEST YORK. |
-
1998-12-14soldstatus $80,000 300-char remark
Show marketing remark (300 chars)
NOTE SEWER COST ALSO INCLUDES GARBAGE. GREAT PROPERTY. BEAUTIFUL HARDWOOD FLOORS IN LR & DR. BRIGHT AND CHEERIE KITCHEN. BACK DOOR LEADS TO FENCED YARD. NEW BERBER CARPET IN 2 BEDROOMS. FALL ATTIC, GREAT STORAGE. REC ROOM ON LOWER LEVEL, NEW FURNACE, 100 AMP ELECTRIC SERVICE. PLUS MUCH MORE. |
-
1998-11-14historical 300-char remark
Show marketing remark (300 chars)
NOTE SEWER COST ALSO INCLUDES GARBAGE. GREAT PROPERTY. BEAUTIFUL HARDWOOD FLOORS IN LR & DR. BRIGHT AND CHEERIE KITCHEN. BACK DOOR LEADS TO FENCED YARD. NEW BERBER CARPET IN 2 BEDROOMS. FALL ATTIC, GREAT STORAGE. REC ROOM ON LOWER LEVEL, NEW FURNACE, 100 AMP ELECTRIC SERVICE. PLUS MUCH MORE. |
-
1998-11-03$79,900 300-char remark
Show marketing remark (300 chars)
NOTE SEWER COST ALSO INCLUDES GARBAGE. GREAT PROPERTY. BEAUTIFUL HARDWOOD FLOORS IN LR & DR. BRIGHT AND CHEERIE KITCHEN. BACK DOOR LEADS TO FENCED YARD. NEW BERBER CARPET IN 2 BEDROOMS. FALL ATTIC, GREAT STORAGE. REC ROOM ON LOWER LEVEL, NEW FURNACE, 100 AMP ELECTRIC SERVICE. PLUS MUCH MORE. |
-
1995-06-26soldstatus $72,900
ⓘ Source: listings_history table (triggers on properties + properties_extension) + one-shot
backfill from property_details.listing_events for pre-trigger history.
Tax reassessment forecast PA · Partial reset (capped growth)
- Current annual tax
- $3,325 · $277/mo
- Projected year-2 tax
- $3,325 · $277/mo
- Expected delta
- $0/yr ($0/mo · 0.0%)
ⓘ Screening estimate from a state-policy table — verify with the county assessor before closing.
Climate risk First Street
- Flood 3/10 Moderate FEMA zone X (unshaded) · 20% chance over 30 yrs
- Wildfire 1/10 Low
- Heat 6/10 Major 7 d/yr ≥103°F today · 15 d/yr by 30 yrs out
- Wind 4/10 Moderate 11% chance of damaging wind over 30 yrs
- Air quality 3/10 Moderate 2 unhealthy d/yr today · 4 by 30 yrs out
Nearby sold comps map
Loading sold comps map…
Walkable amenities ~0.75 mi
Loading nearby amenities…
Taxation est. · year 1
- Rental income
- $39,768
- − Mortgage interest
- −$10,027
- − Property taxes
- −$3,325
- − Insurance
- −$895
- − Repairs & maintenance
- −$3,181
- − Management
- −$3,181
- − Depreciation
- −$5,207
- Taxable income
- $13,951
- Est. tax owed @ 24.0%
- −$3,348
- After-tax cash flow
- $12,584/yr
For passive investors: Depreciation is non-cash, so a rental often shows a tax loss while cash-flowing — sheltering income. Rental losses are passive: they offset passive income freely, and up to $25,000/yr can offset ordinary (W-2) income if you actively participate and your MAGI is under $100k (phasing out to $0 by $150k); unused losses carry forward. On sale, claimed depreciation is recaptured at up to 25%, and gains may owe capital-gains tax (a 1031 exchange can defer both). Figures are a year-1 estimate at your 24.0% rate — not tax advice; consult a CPA.
Schools (NCES district)
- District
- West York Area SD
- NCES district ID
- 4225980
- Math proficiency
- 29% ▼ -8.00%
- Reading proficiency
- 45% ▼ -12.00%
- Median HH income
- $54,375
- Composite
- 32.36/100
- National rank
- #5736
- State rank
- #379 of 539 in PA
Livability — West York
- Score
- 74/100
- State rank
- #488
- US rank
- #4486
Category grades
Schools grade is shown separately in the Schools card above.
Census & demographics
- Census place
- West York, PA
- County
- York County · 278,806 people
- Metro
- York-Hanover, PA
- Population (ZIP)
- 39,374
- Household income
- $78,506
- Rent vs Own
- Severe rent burden
- 722.0
Population outlook (York County) Hauer SSP2
- Today (2025)
- 454,205 people
- By 2030
- 457,407 · +0.7%
- By 2040
- 457,529 · +0.7%
- By 2050
- 448,261 · -1.3%
- By 2075
- 427,388 · -5.9%
- By 2100
- 384,218 · -15.4%
Race, ethnicity, and origin ACS 2023
- Neighborhood character
- Majority White (65%)
- Race & ethnicity
- White 65% Hispanic / Latino 19% Black 12% Two or more races 8%
- Hispanic origin (detail)
- Mexican 2% Puerto Rican 9% Dominican 4%
- Common ancestry
- Romanian 2% Slovak 2% Lithuanian 1%
- Foreign-born
- 6% · Canada, Vietnam
- Languages at home
- 85% English-only · Spanish 12% Russian/Polish/Slavic 1%
Political lean MEDSL · York
- 2024 margin
- Strong R (+25.3) · D 36.9% · R 62.1%
- 2008→2024 swing
- -11.7pp toward R · 2008: -13.6pp · 2024: -25.3pp
- All cycles
- 2024: R+25.3 2020: R+24.6 2016: R+29.3 2012: R+21.2 2008: R+13.6
Not yet ingested
- Civics
- —
Market trends
- HPI YoY
- ▼ -135.44%
- Current HPI
- 237.5683
- Rent YoY
- ▲ 6.38%
- Metro
- York-Hanover, PA
- State GDP YoY
- ▲ 1.68%
- F500 in state
- 34
Industry mix (Fortune 500 HQ in PA)
| Industry | F500 HQs | Revenue |
|---|---|---|
| Healthcare | 2 | $309B |
|
||
| Insurance | 2 | $27B |
|
||
| Telecommunications / Media | 1 | $124B |
|
||
| Industrial Distribution | 1 | $22B |
|
||
| Financial Services | 1 | $20B |
|
||
| Chemicals / Materials | 1 | $18B |
|
||
Price history
+145.5% since first listed11 events — show timeline
- 2026-04-30 Pending — BRIGHT MLS
- 2026-04-28 Listed $179,000 BRIGHT MLS
- 2026-04-24 Coming Soon $179,000 BRIGHT MLS
- 2002-01-04 Sold (Public Records) $62,000 Public Records
- 2001-12-13 Sold (MLS) $62,000 BRIGHT MLS
- 2001-11-13 Listing Removed — BRIGHT MLS
- 2001-11-02 Listed $63,000 BRIGHT MLS
- 1998-12-14 Sold (MLS) $80,000 BRIGHT MLS
- 1998-11-14 Listing Removed — BRIGHT MLS
- 1998-11-03 Listed $79,900 BRIGHT MLS
- 1995-06-26 Sold (Public Records) $72,900 Public Records
Property tax history
+3.9%/yrLatest (2025): $3,325 · +5.7% YoY. Source: county tax records.
Cash-flow waterfall
monthlySold comps — $/sqft
last 12 mo · ≤1 miLoading sold comps…