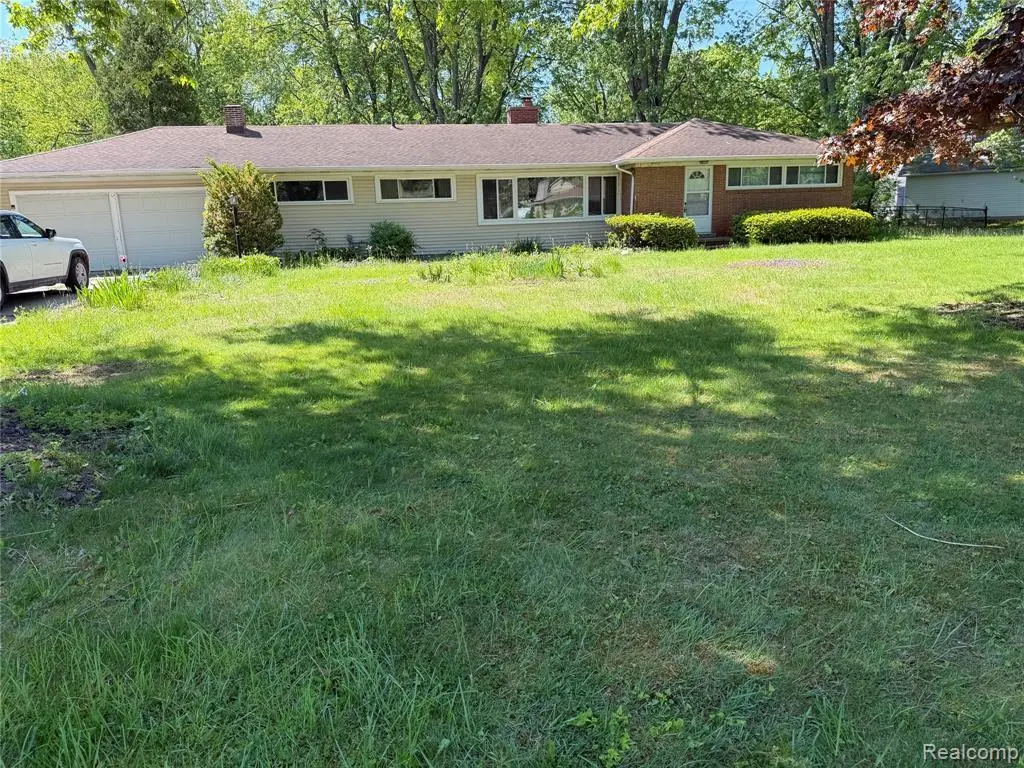
455 6th St · Marysville, MI
Flood risk 4/10 · Minor
- FEMA flood zone
- X (unshaded)
- Chance of flooding over 30 yrs
- 0.22%
- Est. flood insurance / yr
- $507 – $1,088
Fire risk 1/10 · Minimal
- Est. fire insurance / yr
- $784 – $1,456
Heat risk 2/10 · Minimal
- Hot days now (above 99°F)
- 7 days/yr
- Hot days in 30 yrs
- 14 days/yr
Wind risk 1/10 · Minimal
- Chance of severe wind over 30 yrs
- —
Air-quality risk 3/10 · Minor
- Unhealthy air days now
- 2 days/yr
- Unhealthy air days in 30 yrs
- 3 days/yr
Risk factors via First Street. Map © Google.
Why this score? — see what drove the C grade
The composite is a weighted blend of 9 inputs, each scored 0–100. Each bar is that input's sub-score; the figure is the points it added to the 100-point composite (weight × sub-score).
- Cash flow +17.8/30.0
- ARV discount +15.0/15.0
- 1% rule +6.6/10.0
- DSCR +5.6/10.0
- Schools +4.2/10.0
- Livability +3.9/5.0
- Rent growth +2.5/5.0
- Condition / age +2.5/5.0
- Appreciation +0.0/10.0
$135,000
🖨 Deal sheet 📄 Offer letter ✓ Due diligence
Listing remarks
Home needs extensive work and has/had moisture and mold issues. Still so many attributes: -The yard is enormous at just under an acre. Lots of space to play, grow, and store things. -Amazing outbuilding built in 2018 - used as a studio. Has a 220V, gas heat, and a non-potable water source. Its a must see!!! -Fence was installed in 2022. -Crawl space has a vapor barrier installed 2008. -Tankless water heater installed 2019. -Front flower bed have perennial bulbs tulips, day liliy, iris, peony, hostas -Gas and Wood burning fireplaces -Chimney rebricked and new lining in 2017 -Windows are fiberglass installed 2014? -Bedroom closets and hall entry closets are cedar lined HOME IS BEING SOLD A
Key facts
- Enormous yard
- Cedar lined closets
- 0.73 acre lot
Tags
Property features AI
Exterior
- Parking: Attached garage, 2 parking spaces; Garage dimensions approximately 25 x 25
- Utilities: Public water; Public sewer (assumed public utilities listed under water); Electric service (standard residential power)
- Home design: Residential single-story home; Built in 1954; Frontage approximately 147 feet
- Construction: Brick and vinyl siding exterior; Crawl space foundation
- Exterior features: Fenced yard; Irregular, wooded lot; Paved street access
Interior
- Kitchen: Kitchen (Entry) approx. 12 x 10; Appliances included: Range/Oven, Refrigerator
- Bedrooms: Bedroom 1 (Entry): 12 x 14, wood flooring; Bedroom 2 (Entry): 10 x 12, wood flooring; Bedroom 3 (Entry): approx. 10 wide, wood flooring
- Flooring: Wood flooring in bedrooms and dining room
- Bathrooms: Two total bathrooms/lavatories; Full bathrooms: 1; Lavatories: 1; Main bathroom (Entry) approx. 5 x 5
- Heating & cooling: Forced air heating; Natural gas heat source; Tankless hot water heater
- Interior features: Fireplace in family room (natural fireplace); 9 total rooms
- Laundry & utility: Laundry room (Entry) approx. 10 x 10; Washer and Dryer included
Neighborhood map
What this means for you Summary
Snapshot
- This is a 3-bed/1.5-bath single-family listed at $135k.
Deal economics
- At list price, monthly cash flow is $112 ($1k/yr) — positive.
- The deal already cash-flows at list — no discount required.
- Meets the 1% rule at list price ($2k rent vs $135k).
- Cap rate 7.3% vs local median 4.8% in Marysville — top-decile yield for the area; either an underpriced asset or a hidden risk that comps aren't pricing in. Stress-test before assuming the spread holds.
Location & tenants
- Location reads 78/100 on livability (#114 in MI, #2,700 nationally) — a middle-class / working-renter tenant base. Strengths: crime A+, cost of living A+, housing A+; Watch: amenities C-, employment D+, health & safety D.
- Marysville Public Schools (suburban): math 42% / reading 53% proficiency, ranked #115 of 540 in MI (top 21%) — families likely to look elsewhere, expect single-tenant / working-renter base with shorter leases.
- Market conditions: 84 active listings in the ZIP; 1 comparable units currently listed for rent nearby; 232 units permitted in St. Clair County in 2024 (0 in 5+ unit buildings).
Forward outlook
- Local home prices are declining (-3.0%/yr); year-one equity from $933 of loan paydown is wiped out by about $4k of value loss. Plan a longer hold.
- St. Clair County population projected at -20% by 2050 — secular population decline; favor cash flow + early exit over multi-decade hold.
Negotiation context
- Only 1 days on market — expect competitive offers; lowballing is unlikely to land.
Risks & watch-outs
- Watch-outs: property tax is 3.2% of price; built in 1954 — expect roof / HVAC / electrical / plumbing capex.
Questions for the listing agent
- Built in 1954 — when were the roof, HVAC, electrical panel, plumbing, and water heater last replaced?
- Property tax is high relative to price — has the assessment been appealed recently, and will the sale trigger a re-assessment?
- Is there a deadline driving the sale (1031 exchange, divorce, estate, relocation)? That informs how much negotiation room exists.
- Schools are B-rated — typically a magnet for longer-tenancy family renters. What's the average tenant stay here, and is there a school-zone premium baked into asking?
- What's the average days-on-market for RENTAL listings here right now (not sales)? A rising rental-DOM trend means longer vacancies and softer asking-rent achievability than the comps imply.
- What's the recent tenant-quality profile in this submarket — average credit score on applications, eviction rate, late-payment / NSF rate, and stable-employment percentage? A property-management company in the area should have these aggregated.
- How much new for-sale + rental construction is in the pipeline within 1–3 miles? Heavy new supply typically softens prices + rents 12–24 months out; constrained supply supports both.
Investment metrics
- 1% rule
- 1.16% ✓
- Cap rate
- 7.29%
- Cash-on-cash
- 3.55%
- DSCR
- 1.16
- GRM
- 7.2
CMA / ARV
- ARV (on-the-fly)
- $252,960
- Comps found
- 12
Show comp detail 12 sales within ~0.75 mi
| Address | Dist | Beds/Ba | Sqft | Sold | Price | $/sf | Match |
|---|---|---|---|---|---|---|---|
| 688 New Hampshire Ave | 0.16mi | 4/2.0 (+1) | 1,435 (-12%) | 1mo | $305,000 | $213 | 65 |
| 600 Applegate Dr | 0.54mi | 3/2.0 | 1,560 (-4%) | 1mo | $235,000 | $151 | 65 |
| 855 Illinois St | 0.41mi | 4/1.5 (+1) | 1,488 (-9%) | 2mo | $235,000 | $158 | 60 |
| 850 Montana St | 0.72mi | 3/1.5 | 1,631 (-0%) | 12mo | $280,000 | $172 | 56 |
| 675 Applegate Dr | 0.63mi | 3/2.0 | 1,560 (-4%) | 10mo | $215,000 | $138 | 53 |
| 802 Colorado St | 0.37mi | 3/1.0 | 1,449 (-11%) | 12mo | $222,000 | $153 | 52 |
| 422 Colorado Ave | 0.45mi | 3/2.5 | 1,848 (+13%) | 5mo | $308,500 | $167 | 49 |
| 1202 Connecticut Ave | 0.63mi | 3/1.0 | 1,540 (-6%) | 13mo | $241,500 | $157 | 48 |
| 229 Michigan Ave | 0.67mi | 3/2.0 | 1,800 (+10%) | 3mo | $229,900 | $128 | 47 |
| 690 Montana St | 0.68mi | 3/2.0 | 1,840 (+13%) | 0mo | $285,000 | $155 | 45 |
| 695 Bunce Ave | 0.68mi | 4/2.0 (+1) | 1,800 (+10%) | 4mo | $266,000 | $148 | 41 |
| 1006 13th St | 0.73mi | 2/1.0 (-1) | 1,552 (-5%) | 14mo | $189,900 | $122 | 39 |
Match score weights: distance 35% · size 25% · config 20% · recency 20%. Top-matched comps best support the ARV.
Projected returns pro-forma
-3.0% appreciation · 3.0% rent growth · sell at horizon
- IRR
- -10.6%
- Equity multiple
- 0.61×
- Total profit
- $-14,610
- Equity at exit
- $20,129
- IRR
- -1.1%
- Equity multiple
- 0.92×
- Total profit
- $-2,966
- Equity at exit
- $11,672
Cash invested: $37,800 (down + closing). Projections, not guarantees.
Landlord ↔ Tenant lean methodology
- Overall (STATE)
- 62 Landlord-Friendly
- State Michigan
- 62 Landlord-Friendly · EVEN
- County
- — inherits STATE
- City
- — inherits STATE
ZIP-level market 48040
- Home prices YoY
- -34.4%
- Active inventory
- 84
- Price-to-rent
- 7.2×
Monthly cashflow live
- Estimated rent
- $1,570 medium interval (Pro) →
- Mortgage (P&I)
- −$708
- Tax from tax record
- −$364 /mo · $4,371/yr
- Insurance
- −$56
- HOA
- −$0
- Vacancy / Maint / Mgmt
- −$330
- Net cashflow
- $112
Break-even live
UW: 25.0% down · 7.5% · 30yr · 1.5% tax · 5.0% vac · 8.0% maint · 8.0% mgmt
Financing live
Cash to close
- Down payment
- $33,750
- Closing costs
- $4,050
- Reserves months
- —
- Total cash needed
- —
Loan-product check · same deal, 3 products live
Conventional
25% down · 7.5% · 30yr
- Down + closing
- —
- Monthly P&I
- —
- Monthly cashflow
- —
- DSCR
- —
- Eligible?
- —
Personal DTI + credit; lowest rate.
DSCR
20% down · 8.5% · 30yr
- Down + closing
- —
- Monthly P&I
- —
- Monthly cashflow
- —
- DSCR
- —
- Eligible?
- —
No personal income docs; deal must DSCR.
Hard money
10% down · 12.0% · 12mo
- Down + closing
- —
- Monthly P&I
- —
- Monthly cashflow
- —
- DSCR
- —
- Eligible?
- —
Short-term bridge; refi at stabilization.
Rent comps 1 comps
| Address | Beds | Baths | Sqft | Rent | $/sqft | DOM | Units | Dist |
|---|---|---|---|---|---|---|---|---|
| 3991 Brookstone Pl Port Huron, MI | 2.0–3.0 | 1.0–2.0 | 1078 | $1,570 | $1.46 | 1d | 7 | 1.26mi |
Listing history 4 events
-
2026-06-15statusdays on market $135,000 Pending 1 DOM
-
2026-06-15days on market $135,000 Active 3 DOM
-
2026-06-13remarks 699-char remark
-
2026-06-13$135,000 Active 1 DOM
ⓘ Source: listings_history table (triggers on properties + properties_extension) + one-shot
backfill from property_details.listing_events for pre-trigger history.
Tax reassessment forecast MI · Partial reset (capped growth)
- Current annual tax
- $4,371 · $364/mo
- Projected year-2 tax
- $4,371 · $364/mo
- Expected delta
- $0/yr ($0/mo · 0.0%)
ⓘ Screening estimate from a state-policy table — verify with the county assessor before closing.
Climate risk First Street
- Flood 4/10 Moderate FEMA zone X (unshaded) · 22% chance over 30 yrs
- Wildfire 1/10 Low
- Heat 2/10 Low 7 d/yr ≥99°F today · 14 d/yr by 30 yrs out
- Wind 1/10 Low
- Air quality 3/10 Moderate 2 unhealthy d/yr today · 3 by 30 yrs out
Nearby sold comps map
Loading sold comps map…
Walkable amenities ~0.75 mi
Loading nearby amenities…
Taxation est. · year 1
- Rental income
- $18,840
- − Mortgage interest
- −$7,562
- − Property taxes
- −$4,371
- − Insurance
- −$675
- − Repairs & maintenance
- −$1,507
- − Management
- −$1,507
- − Depreciation
- −$3,927
- Taxable loss
- −$710
- Est. tax savings @ 24.0%
- +$170
- After-tax cash flow
- $1,512/yr
For passive investors: Depreciation is non-cash, so a rental often shows a tax loss while cash-flowing — sheltering income. Rental losses are passive: they offset passive income freely, and up to $25,000/yr can offset ordinary (W-2) income if you actively participate and your MAGI is under $100k (phasing out to $0 by $150k); unused losses carry forward. On sale, claimed depreciation is recaptured at up to 25%, and gains may owe capital-gains tax (a 1031 exchange can defer both). Figures are a year-1 estimate at your 24.0% rate — not tax advice; consult a CPA.
Schools (NCES district)
- District
- Marysville Public Schools
- NCES district ID
- 2623040
- Math proficiency
- 42% ▼ -14.00%
- Reading proficiency
- 53% ▼ -12.00%
- Median HH income
- $58,817
- Composite
- 41.51/100
- National rank
- #3454
- State rank
- #115 of 540 in MI
Livability — Marysville
- Score
- 78/100
- State rank
- #114
- US rank
- #2700
Category grades
Schools grade is shown separately in the Schools card above.
Census & demographics
- Census place
- Marysville, MI
- City population
- 9,942
- Population (ZIP)
- 9,942
Population outlook (St. Clair County) Hauer SSP2
- Today (2025)
- 154,587 people
- By 2030
- 150,031 · -2.9%
- By 2040
- 138,177 · -10.6%
- By 2050
- 124,390 · -19.5%
- By 2075
- 95,825 · -38.0%
- By 2100
- 68,672 · -55.6%
Race, ethnicity, and origin ACS 2023
- Neighborhood character
- Predominantly White (93%)
- Race & ethnicity
- White 93% Two or more races 3% Hispanic / Latino 1% Asian 1% Black 1%
- Common ancestry
- Romanian 11% Iranian 6% Lithuanian 5%
- Foreign-born
- 2% · Canada, Philippines
- Languages at home
- 98% English-only · Other Asian/Pacific 1%
Political lean MEDSL · St. Clair
- 2024 margin
- Solid R (+34.6) · D 32.0% · R 66.6% · Other 1.4%
- 2008→2024 swing
- -37.3pp toward R · 2008: 2.6pp · 2024: -34.6pp
- All cycles
- 2024: R+34.6 2020: R+30.2 2016: R+31.4 2012: R+7.1 2008: D+2.6
Not yet ingested
- Civics
- —
Market trends
- HPI YoY
- ▼ -98.64%
- Current HPI
- 188.3932
- Rent YoY
- —
- Metro
- —
- State GDP YoY
- ▲ 1.37%
- F500 in state
- 28
Industry mix (Fortune 500 HQ in MI)
| Industry | F500 HQs | Revenue |
|---|---|---|
| Automotive Parts | 3 | $48B |
|
||
| Automotive | 2 | $372B |
|
||
| Chemicals | 1 | $45B |
|
||
| Automotive Retail | 1 | $29B |
|
||
| Healthcare / Medical Devices | 1 | $23B |
|
||
| Automotive Technology | 1 | $20B |
|
||
Price history
1 event — show timeline
- 2026-06-12 Listed $135,000 MiRealSource-MiMLS
Property tax history
+6.5%/yrLatest (2025): $4,371 · -8.6% YoY. Source: county tax records.
Cash-flow waterfall
monthlySold comps — $/sqft
last 12 mo · ≤1 miLoading sold comps…