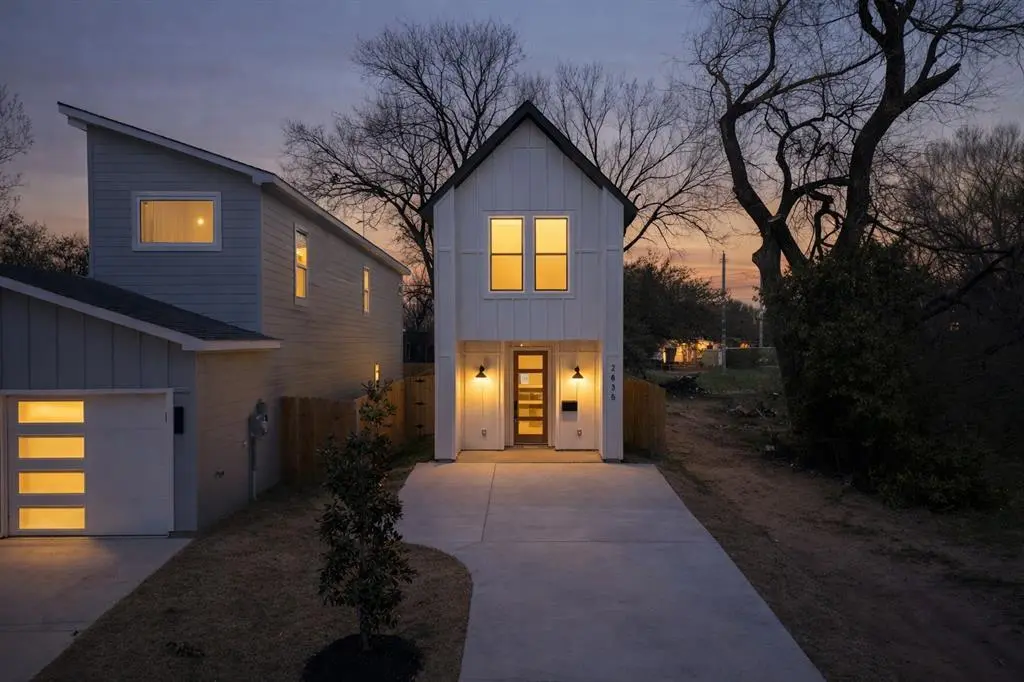
2835 Macon St · Dallas, TX
Flood risk 1/10 · Minimal
- FEMA flood zone
- X (shaded)
- Chance of flooding over 30 yrs
- 0.0%
- Est. flood insurance / yr
- $507 – $1,088
Fire risk 3/10 · Minor
- Est. fire insurance / yr
- $1,222 – $2,270
Heat risk 7/10 · Major
- Hot days now (above 110°F)
- 7 days/yr
- Hot days in 30 yrs
- 24 days/yr
Wind risk 6/10 · Moderate
- Chance of severe wind over 30 yrs
- 27.0%
Air-quality risk 2/10 · Minimal
- Unhealthy air days now
- 2 days/yr
- Unhealthy air days in 30 yrs
- 2 days/yr
Risk factors via First Street. Map © Google.
Why this score? — see what drove the D- grade
The composite is a weighted blend of 9 inputs, each scored 0–100. Each bar is that input's sub-score; the figure is the points it added to the 100-point composite (weight × sub-score).
- Cash flow +7.9/30.0
- Appreciation +5.4/10.0
- ARV discount +4.7/15.0
- Rent growth +4.3/5.0
- Livability +4.0/5.0
- Schools +2.8/10.0
- Condition / age +2.5/5.0
- 1% rule +2.4/10.0
- DSCR +1.9/10.0
$269,999
🖨 Deal sheet 📄 Offer letter ✓ Due diligence
Listing remarks MLS
Modern new construction tucked at the end of the street, offering added privacy, minimal traffic, and extra parking space—plus a generously sized yard rarely found at this price point. Located in a rapidly growing area of South Dallas, the neighborhood is experiencing ongoing redevelopment, with older homes being replaced by new construction—bringing strong appreciation potential and long-term value. Whether you’re a first-time homebuyer or looking to add a solid rental to your portfolio, this property is a great opportunity to own in an evolving area with continued growth. This two-story home features 3 bedrooms, 2.5 bathrooms, and a thoughtfully designed layout that blends comfort with functionality. The open-concept main level seamlessly connects the living, dining, and kitchen areas, making it ideal for both everyday living and entertaining. Upstairs, you’ll find spacious secondary bedrooms along with a private primary suite featuring its own bathroom and ample closet space.
Key facts
- Extra parking space
- Ample closet space
- 2,614 sq ft lot
Tags
Neighborhood map
What this means for you Summary
Snapshot
- This is a 3-bed/2.5-bath land listed at $270k.
Deal economics
- At list price, monthly cash flow is $-293 ($-4k/yr) — negative.
- To cash-flow at today's rent, offer at most $228k (15.7% below list).
- To meet the 1% rule (rent ≥ 1% of price), the offer needs to be $199k (26.3% below list).
- Recommended offer: $199k (26.3% below list) — sets the bar for 1% rule.
- Cap rate 5.0% vs local median 2.3% in Dallas — top-decile yield for the area; either an underpriced asset or a hidden risk that comps aren't pricing in. Stress-test before assuming the spread holds.
Location & tenants
- Location reads 81/100 on livability (#24 in TX, #1,380 nationally) — a professional / high-income tenant draw. Strengths: amenities A+, commute A+, housing A+; Watch: schools C-, crime F.
- Dallas ISD (urban): math 31% / reading 36% proficiency, ranked #559 of 826 in TX (top 68%) — families likely to look elsewhere, expect single-tenant / working-renter base with shorter leases; 83% free/reduced lunch — lower-income household profile, screen leases tightly.
- Market conditions: Rents rising fast (+7.2%/yr); 248 active listings in the ZIP; 40 comparable units currently listed for rent nearby; rentals at typical pace (median 24d on market — plan ~3-4 weeks tenant-placement turnaround); 12,577 units permitted in Dallas County in 2024 (6,829 in 5+ unit buildings).
- At $1,991/mo this rent would consume 52% of the median local household income ($46k/yr) (locally 1464% of renters already pay >50% of income on rent) — very limited rent-growth headroom before tenants either downsize or default.
Forward outlook
- In year one you build about $4k of equity ($2k loan paydown + $2k appreciation (0.8% local appreciation)).
- Dallas County population projected at +35% by 2050 — long-run rental-demand tailwind backs the buy-and-hold thesis.
- By year 8, paydown + projected appreciation supports a ~$33k cash-out refi (75% LTV) — recoverable capital for the next deal without selling this one.
Negotiation context
- It's been on market 83 days — a 6% lower offer ($254k) is reasonable based on typical stale-listing flexibility.
- 3 sale attempts since 5y ago with the ask held roughly flat each time — persistent listings suggest the price (not the market) is what's stuck; bring a comps-based counter.
Risks & watch-outs
- Climate carrying-cost: major wind risk, 27% chance of damaging wind over 30y; extreme-heat days projected 7→24/yr by 2055 (HVAC capex compounding) — expect insurance premiums to compound above CPI over the hold.
Questions for the listing agent
- What do current leases actually rent for vs. the listed asking? Can we see a recent rent roll and the last 12 months of T-12 income?
- It's been on market 83 days. Have you received any prior offers? Is the seller open to a 26% concession, seller financing, or rate buy-down credit?
- Why hasn't it sold? Are there any deal-killer items the seller is aware of (foundation, flood, title, zoning, code violations)?
- Is there a deadline driving the sale (1031 exchange, divorce, estate, relocation)? That informs how much negotiation room exists.
- Crime grade is F in this area — have there been break-ins, vandalism, or insurance claims at this property in the last 3 years? What carrier currently insures it and at what premium?
- The area grade is low — what's the realistic commute time and amenity access for the typical tenant pool here? Any planned neighborhood developments (good or bad) we should know about?
- What's the average days-on-market for RENTAL listings here right now (not sales)? A rising rental-DOM trend means longer vacancies and softer asking-rent achievability than the comps imply.
- What's the recent tenant-quality profile in this submarket — average credit score on applications, eviction rate, late-payment / NSF rate, and stable-employment percentage? A property-management company in the area should have these aggregated.
- How much new for-sale + rental construction is in the pipeline within 1–3 miles? Heavy new supply typically softens prices + rents 12–24 months out; constrained supply supports both.
Investment metrics
- 1% rule
- 0.74% ✗
- Cap rate
- 4.99%
- Cash-on-cash
- -4.65%
- DSCR
- 0.79
- GRM
- 11.3
CMA / ARV
- ARV (median comp)
- $253,959
- List price
- $269,999
- Delta
- 6.32%
- Verdict
- FAIR
- Comps
- 20 within 1.0 mi
Projected returns pro-forma
0.79% appreciation · 7.19% rent growth · sell at horizon
- IRR
- -2.0%
- Equity multiple
- 0.90×
- Total profit
- $-7,611
- Equity at exit
- $89,223
- IRR
- 5.7%
- Equity multiple
- 1.74×
- Total profit
- $55,918
- Equity at exit
- $116,321
Cash invested: $75,600 (down + closing). Projections, not guarantees.
Landlord ↔ Tenant lean methodology
- Overall (STATE)
- 87 Strongly Landlord-Friendly
- State Texas
- 87 Strongly Landlord-Friendly · R+5
- County
- — inherits STATE
- City
- — inherits STATE
ZIP-level market 75215
- Home prices YoY
- 0.3%
- Rents YoY
- 7.2%
- Active inventory
- 248
- Price-to-rent
- 11.3×
Monthly cashflow live
- Estimated rent
- $1,991 high interval (Pro) →
- Mortgage (P&I)
- −$1,416
- Tax est. 1.5%
- −$337 /mo · $4,050/yr
- Insurance
- −$112
- HOA
- −$0
- Vacancy / Maint / Mgmt
- −$418
- Net cashflow
- $-293
Break-even live
UW: 25.0% down · 7.5% · 30yr · 1.5% tax · 5.0% vac · 8.0% maint · 8.0% mgmt
Financing live
Cash to close
- Down payment
- $67,500
- Closing costs
- $8,100
- Reserves months
- —
- Total cash needed
- —
Loan-product check · same deal, 3 products live
Conventional
25% down · 7.5% · 30yr
- Down + closing
- —
- Monthly P&I
- —
- Monthly cashflow
- —
- DSCR
- —
- Eligible?
- —
Personal DTI + credit; lowest rate.
DSCR
20% down · 8.5% · 30yr
- Down + closing
- —
- Monthly P&I
- —
- Monthly cashflow
- —
- DSCR
- —
- Eligible?
- —
No personal income docs; deal must DSCR.
Hard money
10% down · 12.0% · 12mo
- Down + closing
- —
- Monthly P&I
- —
- Monthly cashflow
- —
- DSCR
- —
- Eligible?
- —
Short-term bridge; refi at stabilization.
Rent comps 40 comps
| Address | Beds | Baths | Sqft | Rent | $/sqft | DOM | Units | Dist |
|---|---|---|---|---|---|---|---|---|
| 2838 Frost Ave Dallas, TX | 2.0 | 1.0 | 1200 | $1,400 | $1.17 | 24d | 1 | 0.13mi |
| 2840 Oakdale St Dallas, TX | 3.0 | 2.0 | 1379 | $1,900 | $1.38 | 43d | 1 | 0.20mi |
| 5000 Linder Ave Dallas, TX | 3.0 | 2.0 | 1327 | $1,950 | $1.47 | 43d | 1 | 0.22mi |
| 4722 Meadow St Dallas, TX | 2.0–3.0 | 2.0 | 1107 | $1,475 | $1.33 | 11d | 4 | 0.50mi |
| 2521 Bethurum Ave Dallas, TX | 3.0 | 2.5 | 1600 | $2,300 | $1.44 | 43d | 1 | 0.52mi |
| 2927 Dorris St Dallas, TX | 3.0 | 2.0 | 1298 | $1,914 | $1.47 | 43d | 1 | 0.56mi |
| 2246 Hooper St Dallas, TX | 3.0 | 3.0 | 1870 | $2,400 | $1.28 | 43d | 1 | 0.61mi |
| 2807 Valentine St Dallas, TX | 3.0 | 2.0 | 1400 | $1,500 | $1.07 | 14d | 1 | 0.63mi |
| 2618 Carpenter Ave Dallas, TX | 4.0 | 3.0 | 2050 | $3,200 | $1.56 | 43d | 1 | 0.65mi |
| 4611 Bradshaw St Dallas, TX | 3.0 | 2.0 | 1145 | $1,550 | $1.35 | 24d | 1 | 0.69mi |
| 2207 Anderson St Dallas, TX | 3.0 | 2.5 | 1419 | $2,300 | $1.62 | 7d | 1 | 0.70mi |
| 2203 Anderson St Dallas, TX | 3.0 | 2.5 | 1219 | $2,200 | $1.80 | 43d | 1 | 0.70mi |
| 4503 Bradshaw St Dallas, TX | 4.0 | 2.0 | 1263 | $1,600 | $1.27 | 7d | 1 | 0.75mi |
| 2216 Dyson St Dallas, TX | 3.0 | 2.0 | 1056 | $2,100 | $1.99 | 24d | 1 | 0.79mi |
| 2312 Stoneman St Dallas, TX | 4.0 | 3.0 | 2106 | $3,100 | $1.47 | 4d | 1 | 0.79mi |
| 1711 Herald St Dallas, TX | 3.0 | 2.5 | 2140 | $2,350 | $1.10 | 43d | 1 | 0.80mi |
| 1713 Herald St Dallas, TX | 3.0 | 2.5 | 2142 | $2,300 | $1.07 | 7d | 1 | 0.80mi |
| 2325 Budd St Dallas, TX | 3.0 | 2.5 | 1696 | $2,350 | $1.39 | 43d | 1 | 0.82mi |
| 3526 Elsie Faye Heggins St Dallas, TX | 3.0 | 2.0 | 1113 | $1,795 | $1.61 | 7d | 1 | 0.82mi |
| 3526 Elsie Faye Heggins St Dallas, TX | 3.0 | 2.0 | 1113 | $1,795 | $1.61 | 24d | 1 | 0.82mi |
| 2413 Easley St Dallas, TX | 3.0 | 2.5 | 1597 | $2,400 | $1.50 | 7d | 1 | 0.83mi |
| 4024 Myrtle St Dallas, TX | 3.0 | 2.0 | 1106 | $1,595 | $1.44 | 4d | 1 | 0.84mi |
| 3627 Sidney St Dallas, TX | 3.0 | 2.0 | 1090 | $1,614 | $1.48 | 6d | 1 | 0.87mi |
| 3619 York St Dallas, TX | 3.0 | 2.0 | 1298 | $1,740 | $1.34 | 7d | 1 | 0.95mi |
| 6602 Bexar St Dallas, TX | 3.0 | 2.5 | 1600 | $2,499 | $1.56 | 7d | 1 | 0.99mi |
| 2727 Choice St Dallas, TX | 3.0 | 2.0 | 1175 | $1,799 | $1.53 | 24d | 1 | 1.01mi |
| 3331 Spring Ave Dallas, TX | 3.0 | 2.0 | 1652 | $2,200 | $1.33 | 24d | 1 | 1.05mi |
| 3331 Spring Ave Dallas, TX | 3.0 | 2.0 | 1652 | $2,200 | $1.33 | 7d | 1 | 1.05mi |
| 2822 McDermott Ave Dallas, TX | 3.0 | 2.0 | 1200 | $1,795 | $1.50 | 24d | 1 | 1.10mi |
| 4024 Colonial Ave Dallas, TX | 4.0 | 2.0 | 1560 | $2,400 | $1.54 | 24d | 1 | 1.12mi |
| 3915 Coolidge St Dallas, TX | 4.0 | 2.0 | 1416 | $2,100 | $1.48 | 43d | 1 | 1.12mi |
| 5340 Dimple Jackson St Dallas, TX | 3.0 | 2.0 | 1298 | $1,864 | $1.44 | 6d | 1 | 1.12mi |
| 3639 Pine St Dallas, TX | 3.0 | 2.0 | 1090 | $1,490 | $1.37 | 13d | 1 | 1.17mi |
| 3726 Copeland St Dallas, TX | 3.0 | 2.0 | 1298 | $1,690 | $1.30 | 6d | 1 | 1.17mi |
| 3801 Carpenter Ave Dallas, TX | 4.0 | 2.0 | 1454 | $2,400 | $1.65 | 43d | 1 | 1.17mi |
| 2714 Hector St Dallas, TX | 3.0 | 2.0 | 1233 | $2,100 | $1.70 | 24d | 1 | 1.23mi |
| 3523 Herrling St Dallas, TX | 3.0 | 2.0 | 1525 | $1,800 | $1.18 | 16d | 1 | 1.24mi |
| 2847 Metropolitan Ave Dallas, TX | 3.0 | 1.0 | 1344 | $2,050 | $1.53 | 21d | 1 | 1.24mi |
| 4014 Marshall Dr Dallas, TX | 4.0 | 2.0 | 1600 | $1,850 | $1.16 | 24d | 1 | 1.26mi |
| 3502 Edgewood St Dallas, TX | 4.0 | 2.0 | 1866 | $2,523 | $1.35 | 1d | 1 | 1.41mi |
Listing history 33 events
-
2026-06-18days on market $269,999 Active 83 DOM
-
2026-06-17days on market $269,999 Active 82 DOM
-
2026-06-16days on market $269,999 Active 81 DOM
-
2026-06-15days on market $269,999 Active 80 DOM
-
2026-06-13days on market $269,999 Active 78 DOM
-
2026-06-09days on market $269,999 Active 74 DOM
-
2026-06-08days on market $269,999 Active 73 DOM
-
2026-06-07days on market $269,999 Active 72 DOM
-
2026-06-04days on market $269,999 Active 69 DOM
-
2026-06-03days on market $269,999 Active 68 DOM
-
2026-06-02days on market $269,999 Active 67 DOM
-
2026-06-01days on market $269,999 Active 66 DOM
-
2026-06-01price $269,999 Active 65 DOM
-
2026-05-31days on market $274,999 Active 65 DOM
-
2026-05-11price $274,999 1027-char remark
Show marketing remark (1027 chars)
Modern new construction tucked at the end of the street, offering added privacy, minimal traffic, and extra parking space—plus a generously sized yard rarely found at this price point. Located in a rapidly growing area of South Dallas, the neighborhood is experiencing ongoing redevelopment, with older homes being replaced by new construction—bringing strong appreciation potential and long-term value. Whether you’re a first-time homebuyer or looking to add a solid rental to your portfolio, this property is a great opportunity to own in an evolving area with continued growth. This two-story home features 3 bedrooms, 2.5 bathrooms, and a thoughtfully designed layout that blends comfort with functionality. The open-concept main level seamlessly connects the living, dining, and kitchen areas, making it ideal for both everyday living and entertaining. Upstairs, you’ll find spacious secondary bedrooms along with a private primary suite featuring its own bathroom and ample closet space.
-
2026-03-27$279,999 Active 1027-char remark
Show marketing remark (1027 chars)
Modern new construction tucked at the end of the street, offering added privacy, minimal traffic, and extra parking space—plus a generously sized yard rarely found at this price point. Located in a rapidly growing area of South Dallas, the neighborhood is experiencing ongoing redevelopment, with older homes being replaced by new construction—bringing strong appreciation potential and long-term value. Whether you’re a first-time homebuyer or looking to add a solid rental to your portfolio, this property is a great opportunity to own in an evolving area with continued growth. This two-story home features 3 bedrooms, 2.5 bathrooms, and a thoughtfully designed layout that blends comfort with functionality. The open-concept main level seamlessly connects the living, dining, and kitchen areas, making it ideal for both everyday living and entertaining. Upstairs, you’ll find spacious secondary bedrooms along with a private primary suite featuring its own bathroom and ample closet space.
-
2025-09-19soldstatus
-
2025-06-27$65,000 Active
-
2024-10-18soldstatus
-
2022-02-21soldstatus
-
2022-02-19price $30,000
-
2022-02-18soldstatus Sold
-
2022-02-10status Pending
-
2022-02-10price $37,500
-
2022-01-20price $37,500
-
2021-12-01price $39,900
-
2021-11-09price $42,500
-
2021-10-18price $47,500
-
2021-09-30$50,000 Active
-
2021-09-16soldstatus
-
1996-09-25soldstatus
-
1996-09-25soldstatus
-
1996-01-26soldstatus
ⓘ Source: listings_history table (triggers on properties + properties_extension) + one-shot
backfill from property_details.listing_events for pre-trigger history.
Climate risk First Street
- Flood 1/10 Low FEMA zone X (shaded) · 0% chance over 30 yrs
- Wildfire 3/10 Moderate
- Heat 7/10 Severe 7 d/yr ≥110°F today · 24 d/yr by 30 yrs out
- Wind 6/10 Major 27% chance of damaging wind over 30 yrs
- Air quality 2/10 Low 2 unhealthy d/yr today · 2 by 30 yrs out
Nearby sold comps map
Loading sold comps map…
Walkable amenities ~0.75 mi
Loading nearby amenities…
Taxation est. · year 1
- Rental income
- $23,892
- − Mortgage interest
- −$15,124
- − Property taxes
- −$4,050
- − Insurance
- −$1,350
- − Repairs & maintenance
- −$1,911
- − Management
- −$1,911
- − Depreciation
- −$7,855
- Taxable loss
- −$8,310
- Est. tax savings @ 24.0%
- +$1,994
- After-tax cash flow
- $-1,522/yr
For passive investors: Depreciation is non-cash, so a rental often shows a tax loss while cash-flowing — sheltering income. Rental losses are passive: they offset passive income freely, and up to $25,000/yr can offset ordinary (W-2) income if you actively participate and your MAGI is under $100k (phasing out to $0 by $150k); unused losses carry forward. On sale, claimed depreciation is recaptured at up to 25%, and gains may owe capital-gains tax (a 1031 exchange can defer both). Figures are a year-1 estimate at your 24.0% rate — not tax advice; consult a CPA.
Schools (NCES district)
- District
- Dallas ISD
- NCES district ID
- 4816230
- Math proficiency
- 31% ▼ -16.00%
- Reading proficiency
- 36% ▼ -4.00%
- Median HH income
- $42,881
- Composite
- 28.41/100
- National rank
- #6763
- State rank
- #559 of 826 in TX
Livability — Dallas
- Score
- 81/100
- State rank
- #24
- US rank
- #1380
Category grades
Schools grade is shown separately in the Schools card above.
Census & demographics
- Census place
- Dallas, TX
- County
- Dallas County · 2,612,404 people
- City population
- 1,168,437
- Metro
- Dallas-Fort Worth-Arlington, TX
- Population (ZIP)
- 18,895
- Household income
- $45,557
- Rent vs Own
- Severe rent burden
- 1464.0
Population outlook (Dallas County) Hauer SSP2
- Today (2025)
- 2,979,839 people
- By 2030
- 3,191,823 · +7.1%
- By 2040
- 3,619,611 · +21.5%
- By 2050
- 4,026,915 · +35.1%
- By 2075
- 4,957,073 · +66.4%
- By 2100
- 5,508,725 · +84.9%
Race, ethnicity, and origin ACS 2023
- Neighborhood character
- Diverse neighborhood (Simpson 0.58)
- Race & ethnicity
- Black 59% Hispanic / Latino 25% White 11% Two or more races 10%
- Hispanic origin (detail)
- Mexican 21%
- Common ancestry
- Italian 1% Hispanic 1%
- Foreign-born
- 16% · Canada
- Languages at home
- 74% English-only · Spanish 26%
Political lean MEDSL · Dallas
- 2024 margin
- Strong D (+22.2) · D 60.2% · R 38.0% · Other 1.8%
- 2008→2024 swing
- +6.9pp toward D · 2008: 15.3pp · 2024: 22.2pp
- All cycles
- 2024: D+22.2 2020: D+31.6 2016: D+26.2 2012: D+15.4 2008: D+15.3
Not yet ingested
- Civics
- —
Market trends
- HPI YoY
- ▲ 0.79%
- Current HPI
- 224.2955
- Rent YoY
- ▲ 7.19%
- Metro
- Dallas-Fort Worth-Arlington, TX
- State GDP YoY
- ▲ 3.95%
- F500 in state
- 110
Industry mix (Fortune 500 HQ in TX)
| Industry | F500 HQs | Revenue |
|---|---|---|
| Energy | 16 | $1,198B |
|
||
| Technology | 5 | $198B |
|
||
| Engineering / Construction | 4 | $72B |
|
||
| Energy Services | 3 | $60B |
|
||
| Utilities | 3 | $41B |
|
||
| Healthcare | 2 | $330B |
|
||
Price history
+450.0% since first listed19 events — show timeline
- 2026-05-11 Price Changed $274,999 NTREIS
- 2026-03-27 Listed $279,999 NTREIS
- 2025-09-19 Sold (Public Records) — Public Records
- 2025-06-27 Listed $65,000 NTREIS
- 2024-10-18 Sold (Public Records) — Public Records
- 2022-02-21 Sold (Public Records) — Public Records
- 2022-02-19 Price Changed $30,000 NTREIS
- 2022-02-18 Sold (MLS) — NTREIS
- 2022-02-10 Pending — NTREIS
- 2022-02-10 Price Changed $37,500 NTREIS
- 2022-01-20 Price Changed $37,500 NTREIS
- 2021-12-01 Price Changed $39,900 NTREIS
- 2021-11-09 Price Changed $42,500 NTREIS
- 2021-10-18 Price Changed $47,500 NTREIS
- 2021-09-30 Listed $50,000 NTREIS
- 2021-09-16 Sold (Public Records) — Public Records
- 1996-09-25 Sold (Public Records) — Public Records
- 1996-09-25 Sold (Public Records) — Public Records
- 1996-01-26 Sold (Public Records) — Public Records
Property tax history
+13.7%/yrLatest (2025): $411 · +42.4% YoY. Source: county tax records.
Cash-flow waterfall
monthlySold comps — $/sqft
last 12 mo · ≤1 miLoading sold comps…