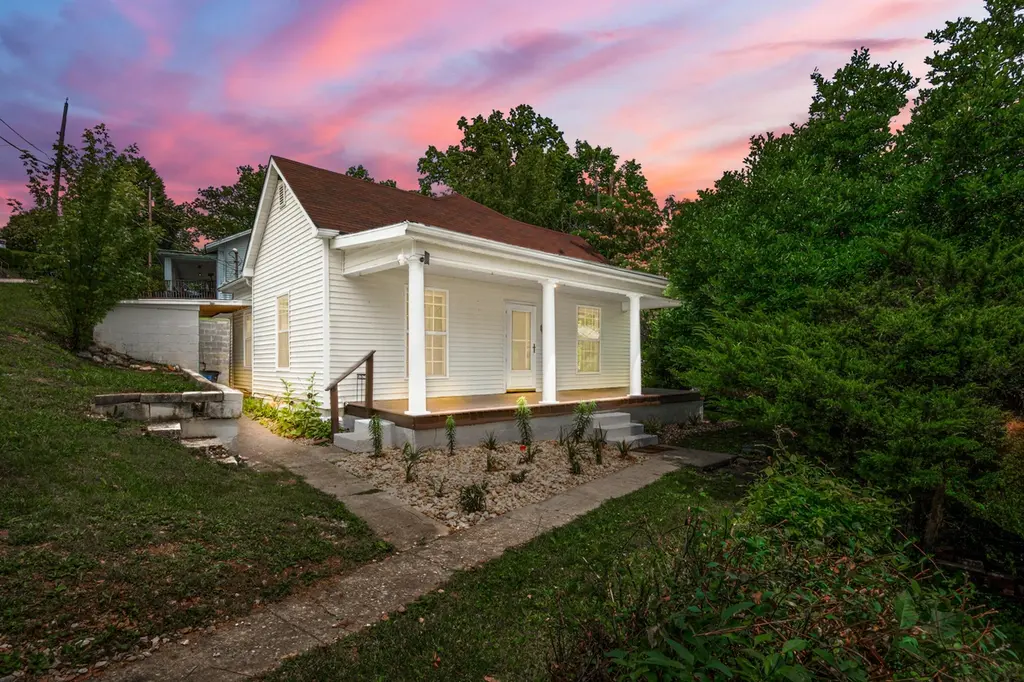
316 W 1st St · Corbin, KY
Flood risk 1/10 · Minimal
- FEMA flood zone
- X (unshaded)
- Chance of flooding over 30 yrs
- 0.0%
- Est. flood insurance / yr
- $473 – $860
Fire risk 4/10 · Minor
- Est. fire insurance / yr
- $839 – $1,559
Heat risk 4/10 · Minor
- Hot days now (above 100°F)
- 7 days/yr
- Hot days in 30 yrs
- 19 days/yr
Wind risk 2/10 · Minimal
- Chance of severe wind over 30 yrs
- 4.0%
Air-quality risk 2/10 · Minimal
- Unhealthy air days now
- 0 days/yr
- Unhealthy air days in 30 yrs
- 1 days/yr
Risk factors via First Street. Map © Google.
Why this score? — see what drove the C- grade
The composite is a weighted blend of 9 inputs, each scored 0–100. Each bar is that input's sub-score; the figure is the points it added to the 100-point composite (weight × sub-score).
- Cash flow +15.1/30.0
- ARV discount +9.4/15.0
- Appreciation +5.9/10.0
- DSCR +4.6/10.0
- 1% rule +4.2/10.0
- Schools +3.8/10.0
- Livability +3.5/5.0
- Rent growth +2.5/5.0
- Condition / age +2.5/5.0
$149,900
🖨 Deal sheet 📄 Offer letter ✓ Due diligence
Listing remarks
Main character energy meets small-town charm in this adorable downtown Corbin cottage! Perched above the city, the welcoming front porch is the perfect spot to enjoy your morning coffee, unwind after work, or take in the views of the town below. Step inside and you'll find a surprisingly open layout filled with cozy character and inviting spaces. This 2-bedroom, 1-bath home features a comfortable living area, functional kitchen, and dedicated utility room—all designed for easy living. Located on the corner of W 1st Street and Padgett Street, you'll love being just minutes from downtown Corbin's favorite restaurants, coffee shops, local boutiques, parks, and entertainment hotspots. Whe
Key facts
- Functional kitchen
- Open layout
- 6,098 sq ft lot
Tags
Property features AI
Finance
- Other: Located in the City Limits subdivision; Parcel number 137-41-01-001.00
Exterior
- Parking: Off-street parking
- Utilities: Public water; Public sewer; Electricity connected; Natural gas connected; Sewer connected; Water connected
- Home design: Single-story house
- Construction: Vinyl siding; Block foundation; Shingle roof; Built area approximately 1,086 (building area)
- Exterior features: Garden; Few trees; Neighborhood view
Interior
- Kitchen: Dishwasher; Gas range; Refrigerator
- Bedrooms: Total of 6 rooms (bedroom count not specified)
- Bathrooms: 1 full bathroom
- Heating & cooling: Heat pump; Natural gas heating; Electric cooling
- Interior features: Primary bedroom on the first floor; Ceiling fans; Blinds
- Laundry & utility: Washer hookup; Electric dryer hookup
Neighborhood map
What this means for you Summary
Snapshot
- This is a 2-bed/1.0-bath single-family listed at $150k.
Deal economics
- At list price, monthly cash flow is $50 ($604/yr) — positive.
- The deal already cash-flows at list — no discount required.
- To meet the 1% rule (rent ≥ 1% of price), the offer needs to be $138k (8.3% below list).
- Recommended offer: $138k (8.3% below list) — sets the bar for 1% rule.
- Cap rate 6.7% vs local median 3.3% in Corbin — top-decile yield for the area; either an underpriced asset or a hidden risk that comps aren't pricing in. Stress-test before assuming the spread holds.
Location & tenants
- Location reads 69/100 on livability (#179 in KY) — a middle-class / working-renter tenant base. Strengths: cost of living A+, housing A+, crime A-; Watch: amenities F, commute F, employment F.
- Corbin Independent (town): math 42% / reading 50% proficiency, ranked #20 of 165 in KY (top 12%) — families likely to look elsewhere, expect single-tenant / working-renter base with shorter leases.
- Zoned schools: Corbin Middle School (math 46% / reading 56%, grade C, #20 of 217 statewide, top 10%, 646 students, 58% FRL); Corbin High School (math 22% / reading 42%, grade F, #97 of 254 statewide, top 46%, 829 students, 53% FRL).
- Market conditions: 332 active listings in the ZIP; 1 comparable units currently listed for rent nearby; 65 units permitted in Whitley County in 2024 (0 in 5+ unit buildings).
Forward outlook
- In year one you build about $4k of equity ($1k loan paydown + $3k appreciation (1.8% local appreciation)).
- Whitley County population projected to shrink 8% by 2050 — rents likely to lag national; underwrite the cash flow, not the appreciation.
- At projected returns (1.8% appreciation + 3.0% rent growth), your $42k cash investment doubles in ~8 years — after that, you're playing with house money.
- By year 9, paydown + projected appreciation supports a ~$33k cash-out refi (75% LTV) — recoverable capital for the next deal without selling this one.
Negotiation context
- Only 7 days on market — expect competitive offers; lowballing is unlikely to land.
- Current owner paid $89k; list at $150k implies a 68% gain — meaningful room to come down on a strong offer.
Questions for the listing agent
- Is there a deadline driving the sale (1031 exchange, divorce, estate, relocation)? That informs how much negotiation room exists.
- Schools are B-rated — typically a magnet for longer-tenancy family renters. What's the average tenant stay here, and is there a school-zone premium baked into asking?
- What's the average days-on-market for RENTAL listings here right now (not sales)? A rising rental-DOM trend means longer vacancies and softer asking-rent achievability than the comps imply.
- What's the recent tenant-quality profile in this submarket — average credit score on applications, eviction rate, late-payment / NSF rate, and stable-employment percentage? A property-management company in the area should have these aggregated.
- How much new for-sale + rental construction is in the pipeline within 1–3 miles? Heavy new supply typically softens prices + rents 12–24 months out; constrained supply supports both.
Investment metrics
- 1% rule
- 0.92% ✗
- Cap rate
- 6.70%
- Cash-on-cash
- 1.44%
- DSCR
- 1.06
- GRM
- 9.1
CMA / ARV
- ARV (on-the-fly)
- $156,384
- Comps found
- 12
Show comp detail 12 sales within ~0.75 mi
| Address | Dist | Beds/Ba | Sqft | Sold | Price | $/sf | Match |
|---|---|---|---|---|---|---|---|
| 502 W 3rd St | 0.10mi | 2/1.0 | 1,036 (-5%) | 9mo | $92,000 | $89 | 80 |
| 504 W 3rd St | 0.11mi | 3/1.0 (+1) | 1,020 (-6%) | 6mo | $65,000 | $64 | 74 |
| 207 W Center St | 0.18mi | 3/1.0 (+1) | 1,140 (+5%) | 9mo | $100,000 | $88 | 71 |
| 49 Creekside Ln | 0.47mi | 3/2.0 (+1) | 1,084 (-0%) | 1mo | $198,000 | $183 | 68 |
| 320 W 8th Street St | 0.33mi | 2/2.0 | 1,040 (-4%) | 10mo | $107,000 | $103 | 65 |
| 7 Gilliam St | 0.08mi | 3/2.0 (+1) | 1,176 (+8%) | 11mo | $175,000 | $149 | 64 |
| 908 W 5th Street St | 0.45mi | 2/1.0 | 1,014 (-7%) | 10mo | $137,400 | $136 | 59 |
| 502 Chestnut St | 0.32mi | 3/2.0 (+1) | 1,212 (+12%) | 6mo | $175,000 | $144 | 52 |
| 206 Hamlin Ave | 0.67mi | 3/1.0 (+1) | 1,160 (+7%) | 1mo | $110,000 | $95 | 51 |
| 507 Caldwell St | 0.68mi | 3/1.0 (+1) | 1,104 (+2%) | 12mo | $166,200 | $151 | 51 |
| 913 W 8th St | 0.52mi | 3/2.0 (+1) | 1,244 (+14%) | 10mo | $225,900 | $182 | 34 |
| 131 Reasor St | 0.61mi | 3/2.0 (+1) | 1,233 (+14%) | 9mo | $280,000 | $227 | 33 |
Match score weights: distance 35% · size 25% · config 20% · recency 20%. Top-matched comps best support the ARV.
Projected returns pro-forma
1.82% appreciation · 3.0% rent growth · sell at horizon
- IRR
- 5.4%
- Equity multiple
- 1.29×
- Total profit
- $12,170
- Equity at exit
- $57,706
- IRR
- 9.1%
- Equity multiple
- 2.21×
- Total profit
- $50,786
- Equity at exit
- $82,021
Cash invested: $41,972 (down + closing). Projections, not guarantees.
Landlord ↔ Tenant lean methodology
- Overall (STATE)
- 83 Strongly Landlord-Friendly
- State Kentucky
- 83 Strongly Landlord-Friendly · R+16
- County
- — inherits STATE
- City
- — inherits STATE
ZIP-level market 40701
- Home prices YoY
- 0.6%
- Active inventory
- 332
- Price-to-rent
- 9.1×
Monthly cashflow live
- Estimated rent
- $1,375 medium interval (Pro) →
- Mortgage (P&I)
- −$786
- Tax est. 1.5%
- −$187 /mo · $2,248/yr
- Insurance
- −$62
- HOA
- −$0
- Vacancy / Maint / Mgmt
- −$289
- Net cashflow
- $50
Break-even live
UW: 25.0% down · 7.5% · 30yr · 1.5% tax · 5.0% vac · 8.0% maint · 8.0% mgmt
Financing live
Cash to close
- Down payment
- $37,475
- Closing costs
- $4,497
- Reserves months
- —
- Total cash needed
- —
Loan-product check · same deal, 3 products live
Conventional
25% down · 7.5% · 30yr
- Down + closing
- —
- Monthly P&I
- —
- Monthly cashflow
- —
- DSCR
- —
- Eligible?
- —
Personal DTI + credit; lowest rate.
DSCR
20% down · 8.5% · 30yr
- Down + closing
- —
- Monthly P&I
- —
- Monthly cashflow
- —
- DSCR
- —
- Eligible?
- —
No personal income docs; deal must DSCR.
Hard money
10% down · 12.0% · 12mo
- Down + closing
- —
- Monthly P&I
- —
- Monthly cashflow
- —
- DSCR
- —
- Eligible?
- —
Short-term bridge; refi at stabilization.
Rent comps 1 comps
| Address | Beds | Baths | Sqft | Rent | $/sqft | DOM | Units | Dist |
|---|---|---|---|---|---|---|---|---|
| 1003 W 5th St Corbin, KY | 3.0 | 1.0 | 1186 | $1,375 | $1.16 | 43d | 1 | 0.46mi |
Listing history 7 events
-
2026-06-18days on market $149,900 Active 7 DOM
-
2026-06-17days on market $149,900 Active 6 DOM
-
2026-06-16days on market $149,900 Active 5 DOM
-
2026-06-15days on market $149,900 Active 4 DOM
-
2026-06-13days on market $149,900 Active 2 DOM
-
2026-06-12remarks 693-char remark
-
2026-06-12$149,900 Active 1 DOM
ⓘ Source: listings_history table (triggers on properties + properties_extension) + one-shot
backfill from property_details.listing_events for pre-trigger history.
Climate risk First Street
- Flood 1/10 Low FEMA zone X (unshaded) · 0% chance over 30 yrs
- Wildfire 4/10 Moderate
- Heat 4/10 Moderate 7 d/yr ≥100°F today · 19 d/yr by 30 yrs out
- Wind 2/10 Low 4% chance of damaging wind over 30 yrs
- Air quality 2/10 Low 0 unhealthy d/yr today · 1 by 30 yrs out
Nearby sold comps map
Loading sold comps map…
Walkable amenities ~0.75 mi
Loading nearby amenities…
Taxation est. · year 1
- Rental income
- $16,500
- − Mortgage interest
- −$8,397
- − Property taxes
- −$2,248
- − Insurance
- −$750
- − Repairs & maintenance
- −$1,320
- − Management
- −$1,320
- − Depreciation
- −$4,361
- Taxable loss
- −$1,895
- Est. tax savings @ 24.0%
- +$455
- After-tax cash flow
- $1,059/yr
For passive investors: Depreciation is non-cash, so a rental often shows a tax loss while cash-flowing — sheltering income. Rental losses are passive: they offset passive income freely, and up to $25,000/yr can offset ordinary (W-2) income if you actively participate and your MAGI is under $100k (phasing out to $0 by $150k); unused losses carry forward. On sale, claimed depreciation is recaptured at up to 25%, and gains may owe capital-gains tax (a 1031 exchange can defer both). Figures are a year-1 estimate at your 24.0% rate — not tax advice; consult a CPA.
Schools (NCES district)
- District
- Corbin Independent
- NCES district ID
- 2101320
- Math proficiency
- 42% ▼ -19.00%
- Reading proficiency
- 50% ▼ -13.00%
- Median HH income
- $36,928
- Composite
- 38.19/100
- National rank
- #4259
- State rank
- #20 of 165 in KY
Livability — Corbin
- Score
- 69/100
- State rank
- #179
- US rank
- #8891
Category grades
Schools grade is shown separately in the Schools card above.
Census & demographics
- Census place
- Corbin, KY
- Population (ZIP)
- 29,767
Population outlook (Whitley County) Hauer SSP2
- Today (2025)
- 35,362 people
- By 2030
- 34,807 · -1.6%
- By 2040
- 33,525 · -5.2%
- By 2050
- 32,550 · -8.0%
- By 2075
- 29,555 · -16.4%
- By 2100
- 24,308 · -31.3%
Race, ethnicity, and origin ACS 2023
- Neighborhood character
- Predominantly White (95%)
- Race & ethnicity
- White 95% Two or more races 3% Hispanic / Latino 1%
- Common ancestry
- Serbian 2% Slovak 2% Italian 1%
- Foreign-born
- 1% · Canada
- Languages at home
- 99% English-only · Spanish 1%
Political lean MEDSL · Whitley
- 2024 margin
- Solid R (+69.3) · D 14.8% · R 84.2% · Other 1.0%
- 2008→2024 swing
- -21.7pp toward R · 2008: -47.7pp · 2024: -69.3pp
- All cycles
- 2024: R+69.3 2020: R+65.2 2016: R+67.2 2012: R+57.8 2008: R+47.7
Not yet ingested
- Civics
- —
Market trends
- HPI YoY
- ▲ 1.82%
- Current HPI
- 294.7961
- Rent YoY
- —
- Metro
- —
- State GDP YoY
- ▲ 1.81%
- F500 in state
- 4
Industry mix (Fortune 500 HQ in KY)
| Industry | F500 HQs | Revenue |
|---|---|---|
| Healthcare | 1 | $118B |
|
||
| Food / Beverage | 1 | $7B |
|
||
Price history
+318.7% since first listed4 events — show timeline
- 2026-06-11 Listed $149,900 ImagineMLS
- 2021-08-02 Sold (Public Records) $89,000 Public Records
- 2021-02-26 Sold (Public Records) $35,800 Public Records
- 2008-05-19 Sold (Public Records) $35,800 Public Records
Property tax history
+7.1%/yrLatest (2024): $293 · -3.8% YoY. Source: county tax records.
Cash-flow waterfall
monthlySold comps — $/sqft
last 12 mo · ≤1 miLoading sold comps…