9060 Auburn Folsom Rd #19 · Granite Bay, CA
Flood risk 1/10 · Minimal
- FEMA flood zone
- X (unshaded)
- Chance of flooding over 30 yrs
- 0.0%
- Est. flood insurance / yr
- $507 – $1,088
Fire risk 7/10 · Major
- Est. fire insurance / yr
- $659 – $1,223
Heat risk 7/10 · Major
- Hot days now (above 103°F)
- 7 days/yr
- Hot days in 30 yrs
- 16 days/yr
Wind risk 1/10 · Minimal
- Chance of severe wind over 30 yrs
- —
Air-quality risk 10/10 · Severe
- Unhealthy air days now
- 30 days/yr
- Unhealthy air days in 30 yrs
- 38 days/yr
Risk factors via First Street. Map © Google.
Why this score? — see what drove the B- grade
The composite is a weighted blend of 9 inputs, each scored 0–100. Each bar is that input's sub-score; the figure is the points it added to the 100-point composite (weight × sub-score).
- Cash flow +30.0/30.0
- 1% rule +10.0/10.0
- DSCR +10.0/10.0
- Schools +6.2/10.0
- Condition / age +4.8/5.0
- Livability +3.2/5.0
- Rent growth +2.5/5.0
- ARV discount +0.0/15.0
- Appreciation +0.0/10.0
$74,500
🖨 Deal sheet 📄 Offer letter ✓ Due diligence
Listing remarks
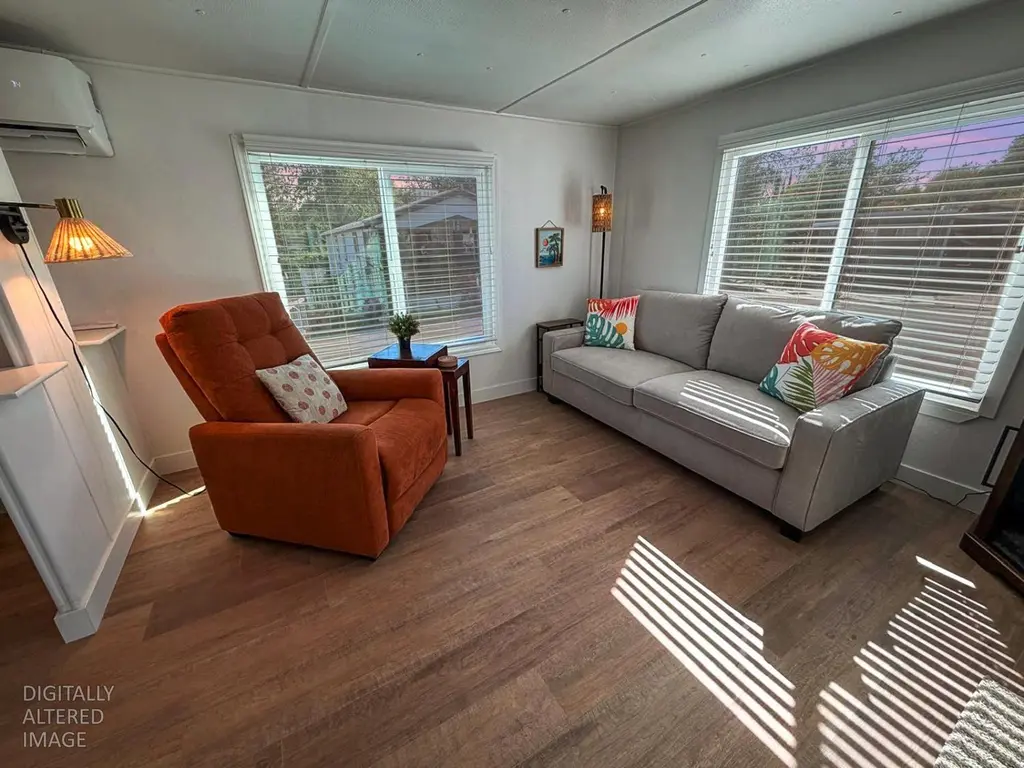
A MUST SEE Inside!! Full remodel with no expense spared! All the appliances are new and will stay including the washer and dryer. All new plumbing and gas lines to bathroom and laundry. New Sub-floors under your New floors, New Kitchen everything and baseboards, new bath vanity, and toilet, new water heater, newer AC mini-split, new 4x6 support beams, new floor joist to rim joist, no dry-rot - it feels like a 2026 model! Come see for yourself, the home is on a corner lot with 2 sheds, 2 spots for parking, age-restricted 55+ Ridgeview Park off Auburn Folsom Rd. Space rent is $1,075.month. Quiet, Safe, Location and like New!
Key facts
- New plumbing
- New kitchen
- New sub-floors
Tags
Property features AI
Finance
- Other: Land lease amount: $1,075
- Financial info: Land lease required
- HOA & community: No homeowners association; Senior community
Exterior
- Parking: 2 parking spaces; Off-street covered parking; Guest parking available
- Utilities: Individual electric meter; Individual gas meter; Public water; Public sewer; Internet available
- Home design: Manufactured home in park; Single wide; Built in 1972; Kaufman Broad make; Skirted with vinyl
- Construction: Metal roof; Vinyl skirting
- Exterior features: Carport awning; Porch awning; Corner lot; Garden; Landscaped backyard
Interior
- Kitchen: Free standing gas range; Free standing refrigerator; Dishwasher; Garbage disposal; Microwave; Breakfast area; Dining space in kitchen
- Bedrooms: 1 bedroom
- Flooring: Laminate flooring
- Bathrooms: 1 full bathroom with shower stall
- Heating & cooling: Ductless heating; Ductless cooling
- Interior features: Updated/remodeled interior; Covered patio; Dual-pane windows with coverings and screens; Storage shed(s); Living room with additional features
- Laundry & utility: Washer and dryer included (stacked); Laundry located inside
Neighborhood map
What this means for you Summary
Snapshot
- This is a 1-bed/1.0-bath manufactured listed at $74k. Condition is rated excellent.
Deal economics
- At list price, monthly cash flow is $1k ($16k/yr) — positive.
- The deal already cash-flows at list — no discount required.
- Meets the 1% rule at list price ($2k rent vs $74k).
- Recommended offer: $68k (9.0% below list) — sets the bar for market timing.
- Cap rate 27.5% vs local median 1.2% in Granite Bay — top-decile yield for the area; either an underpriced asset or a hidden risk that comps aren't pricing in. Stress-test before assuming the spread holds.
Location & tenants
- Location reads 65/100 on livability (#386 in CA) — a middle-class / working-renter tenant base. Strengths: schools A+, employment A+, housing A+; Watch: amenities F, commute F, cost of living F.
- Eureka Union (suburban): math 61% / reading 74% proficiency, ranked #48 of 517 in CA (top 9%) — acceptable for families but not a draw, mixed tenant base, ~2y average lease; only 8% free/reduced lunch — higher-income household profile.
- Market conditions: 164 active listings in the ZIP; high-income renter base; 3,535 units permitted in Placer County in 2024 (689 in 5+ unit buildings).
- This rent is only 15% of the median local income ($183k/yr) — well below the 30% rent-burden line; pricing power to push rent on renewal without tenant pushback.
Forward outlook
- Local home prices are declining (-3.0%/yr); year-one equity from $515 of loan paydown is wiped out by about $2k of value loss. Plan a longer hold.
- Placer County population projected at +20% by 2050 — long-run rental-demand tailwind backs the buy-and-hold thesis.
- At projected returns (-3.0% appreciation + 3.0% rent growth), your $21k cash investment doubles in ~2 years — after that, you're playing with house money.
Negotiation context
- It's been on market 92 days — a 9% lower offer ($68k) is reasonable based on typical stale-listing flexibility.
Risks & watch-outs
- Climate carrying-cost: major wildfire risk; extreme-heat days projected 7→16/yr by 2055 (HVAC capex compounding) — expect insurance premiums to compound above CPI over the hold.
Questions for the listing agent
- It's been on market 92 days. Have you received any prior offers? Is the seller open to a 9% concession, seller financing, or rate buy-down credit?
- Built in 1972 — when were the roof, HVAC, electrical panel, plumbing, and water heater last replaced?
- Why hasn't it sold? Are there any deal-killer items the seller is aware of (foundation, flood, title, zoning, code violations)?
- Is there a deadline driving the sale (1031 exchange, divorce, estate, relocation)? That informs how much negotiation room exists.
- Schools are A-rated — typically a magnet for longer-tenancy family renters. What's the average tenant stay here, and is there a school-zone premium baked into asking?
- What's the average days-on-market for RENTAL listings here right now (not sales)? A rising rental-DOM trend means longer vacancies and softer asking-rent achievability than the comps imply.
- What's the recent tenant-quality profile in this submarket — average credit score on applications, eviction rate, late-payment / NSF rate, and stable-employment percentage? A property-management company in the area should have these aggregated.
- How much new for-sale + rental construction is in the pipeline within 1–3 miles? Heavy new supply typically softens prices + rents 12–24 months out; constrained supply supports both.
Investment metrics
- 1% rule
- 3.11% ✓
- Cap rate
- 27.51%
- Cash-on-cash
- 75.77%
- DSCR
- 4.37
- GRM
- 2.7
CMA / ARV
- ARV (on-the-fly)
- $60,984
- Comps found
- 3
Show comp detail 3 sales within ~0.75 mi
| Address | Dist | Beds/Ba | Sqft | Sold | Price | $/sf | Match |
|---|---|---|---|---|---|---|---|
| 9060 Auburn Folsom Rd #21 | 0.04mi | 1/1.0 | 490 (-3%) | 20mo | $42,000 | $86 | 77 |
| 8880 Auburn Folsom Blvd #52 | 0.19mi | 1/1.0 | 430 (-15%) | 9mo | $52,000 | $121 | 59 |
| 6805 Douglas Blvd #96 | 0.66mi | 2/1.0 (+1) | 566 (+12%) | 21mo | $75,000 | $133 | 26 |
Match score weights: distance 35% · size 25% · config 20% · recency 20%. Top-matched comps best support the ARV.
Projected returns pro-forma
-3.0% appreciation · 3.0% rent growth · sell at horizon
- IRR
- 75.7%
- Equity multiple
- 4.44×
- Total profit
- $71,853
- Equity at exit
- $11,108
- IRR
- 79.4%
- Equity multiple
- 9.18×
- Total profit
- $170,733
- Equity at exit
- $6,441
Cash invested: $20,860 (down + closing). Projections, not guarantees.
Landlord ↔ Tenant lean methodology
- Overall (STATE)
- 18 Strongly Tenant-Friendly
- State California
- 18 Strongly Tenant-Friendly · D+13
- County
- — inherits STATE
- City
- — inherits STATE
ZIP-level market 95746
- Active inventory
- 164
- Price-to-rent
- 2.7×
Monthly cashflow live
- Estimated rent
- $2,319 medium interval (Pro) →
- Mortgage (P&I)
- −$391
- Tax est. 1.5%
- −$93 /mo · $1,118/yr
- Insurance
- −$31
- HOA
- −$0
- Vacancy / Maint / Mgmt
- −$487
- Net cashflow
- $1,317
Break-even live
UW: 25.0% down · 7.5% · 30yr · 1.5% tax · 5.0% vac · 8.0% maint · 8.0% mgmt
Financing live
Cash to close
- Down payment
- $18,625
- Closing costs
- $2,235
- Reserves months
- —
- Total cash needed
- —
Loan-product check · same deal, 3 products live
Conventional
25% down · 7.5% · 30yr
- Down + closing
- —
- Monthly P&I
- —
- Monthly cashflow
- —
- DSCR
- —
- Eligible?
- —
Personal DTI + credit; lowest rate.
DSCR
20% down · 8.5% · 30yr
- Down + closing
- —
- Monthly P&I
- —
- Monthly cashflow
- —
- DSCR
- —
- Eligible?
- —
No personal income docs; deal must DSCR.
Hard money
10% down · 12.0% · 12mo
- Down + closing
- —
- Monthly P&I
- —
- Monthly cashflow
- —
- DSCR
- —
- Eligible?
- —
Short-term bridge; refi at stabilization.
Listing history 13 events
-
2026-06-18days on market $74,500 Active 92 DOM
-
2026-06-17days on market $74,500 Active 91 DOM
-
2026-06-16days on market $74,500 Active 90 DOM
-
2026-06-15days on market $74,500 Active 89 DOM
-
2026-06-13days on market $74,500 Active 87 DOM
-
2026-06-13days on market $74,500 Active 86 DOM
-
2026-06-09days on market $74,500 Active 83 DOM
-
2026-06-08days on market $74,500 Active 82 DOM
-
2026-06-07days on market $74,500 Active 81 DOM
-
2026-06-03days on market $74,500 Active 77 DOM
-
2026-06-02days on market $74,500 Active 76 DOM
-
2026-06-01days on market $74,500 Active 75 DOM
-
2026-05-31days on market $74,500 Active 74 DOM
ⓘ Source: listings_history table (triggers on properties + properties_extension) + one-shot
backfill from property_details.listing_events for pre-trigger history.
Climate risk First Street
- Flood 1/10 Low FEMA zone X (unshaded) · 0% chance over 30 yrs
- Wildfire 7/10 Severe
- Heat 7/10 Severe 7 d/yr ≥103°F today · 16 d/yr by 30 yrs out
- Wind 1/10 Low
- Air quality 10/10 Extreme 30 unhealthy d/yr today · 38 by 30 yrs out
Nearby sold comps map
Loading sold comps map…
Walkable amenities ~0.75 mi
Loading nearby amenities…
Taxation est. · year 1
- Rental income
- $27,828
- − Mortgage interest
- −$4,173
- − Property taxes
- −$1,118
- − Insurance
- −$372
- − Repairs & maintenance
- −$2,226
- − Management
- −$2,226
- − Depreciation
- −$2,167
- Taxable income
- $15,545
- Est. tax owed @ 24.0%
- −$3,731
- After-tax cash flow
- $12,075/yr
For passive investors: Depreciation is non-cash, so a rental often shows a tax loss while cash-flowing — sheltering income. Rental losses are passive: they offset passive income freely, and up to $25,000/yr can offset ordinary (W-2) income if you actively participate and your MAGI is under $100k (phasing out to $0 by $150k); unused losses carry forward. On sale, claimed depreciation is recaptured at up to 25%, and gains may owe capital-gains tax (a 1031 exchange can defer both). Figures are a year-1 estimate at your 24.0% rate — not tax advice; consult a CPA.
Condition & rehab AI · 12 photos
This fully remodeled manufactured home is in excellent condition with no repairs needed. It's move-in ready and offers a great value for both resale and rental.
Value-add opportunities
- Both Painting exterior siding — Enhances curb appeal and value.
- Both Landscaping front yard — Improves curb appeal and rental value.
- Both Upgrade to LED lighting — Saves on energy costs and enhances ambiance.
Renovation cost estimate screening
Value-add ROI direction
- Both Painting exterior siding — Enhances curb appeal and value. ↑
- Both Landscaping front yard — Improves curb appeal and rental value. ↑
- Both Upgrade to LED lighting — Saves on energy costs and enhances ambiance. ↑
ⓘ Cost ranges are severity-bucket heuristics (US national rule-of-thumb). Get contractor quotes + a written scope before underwriting a rehab budget.
Schools (NCES district)
- District
- Eureka Union
- NCES district ID
- 0613080
- Math proficiency
- 61% ▼ -8.00%
- Reading proficiency
- 74% ▼ -5.00%
- Median HH income
- $103,282
- Composite
- 62.34/100
- National rank
- #695
- State rank
- #48 of 517 in CA
Livability — Granite Bay
- Score
- 65/100
- State rank
- #386
- US rank
- #13127
Category grades
Schools grade is shown separately in the Schools card above.
Census & demographics
- Census place
- Granite Bay, CA
- County
- Placer County · 390,510 people
- City population
- 22,985
- Metro
- Sacramento-Roseville-Folsom, CA
- Population (ZIP)
- 22,985
- Household income
- $183,305
- Rent vs Own
- Severe rent burden
- 176.0
Population outlook (Placer County) Hauer SSP2
- Today (2025)
- 422,709 people
- By 2030
- 444,249 · +5.1%
- By 2040
- 480,192 · +13.6%
- By 2050
- 506,390 · +19.8%
- By 2075
- 550,219 · +30.2%
- By 2100
- 547,760 · +29.6%
Race, ethnicity, and origin ACS 2023
- Neighborhood character
- Predominantly White (72%)
- Race & ethnicity
- White 72% Asian 10% Hispanic / Latino 10% Two or more races 8% Black 3%
- Hispanic origin (detail)
- Mexican 6%
- Common ancestry
- Lithuanian 3% Slovak 3% Romanian 3%
- Foreign-born
- 11% · Canada, China, Vietnam
- Languages at home
- 85% English-only · Spanish 4% Other Indo-European 4% Chinese 1%
Political lean MEDSL · Placer
- 2024 margin
- Lean R (+8.5) · D 44.3% · R 52.8% · Other 2.9%
- 2008→2024 swing
- +2.8pp toward D · 2008: -11.3pp · 2024: -8.5pp
- All cycles
- 2024: R+8.5 2020: R+6.7 2016: R+11.3 2012: R+20.1 2008: R+11.3
Not yet ingested
- Civics
- —
Market trends
- HPI YoY
- ▼ -664.09%
- Current HPI
- 264.5367
- Rent YoY
- —
- Metro
- Sacramento-Roseville-Folsom, CA
- State GDP YoY
- ▲ 3.21%
- F500 in state
- 116
Industry mix (Fortune 500 HQ in CA)
| Industry | F500 HQs | Revenue |
|---|---|---|
| Technology | 27 | $1,492B |
|
||
| Financial Services | 3 | $174B |
|
||
| Retail | 3 | $44B |
|
||
| Insurance | 3 | $26B |
|
||
| Media / Entertainment | 2 | $115B |
|
||
| Pharmaceuticals / Biotech | 2 | $62B |
|
||
Cash-flow waterfall
monthlySold comps — $/sqft
last 12 mo · ≤1 miLoading sold comps…