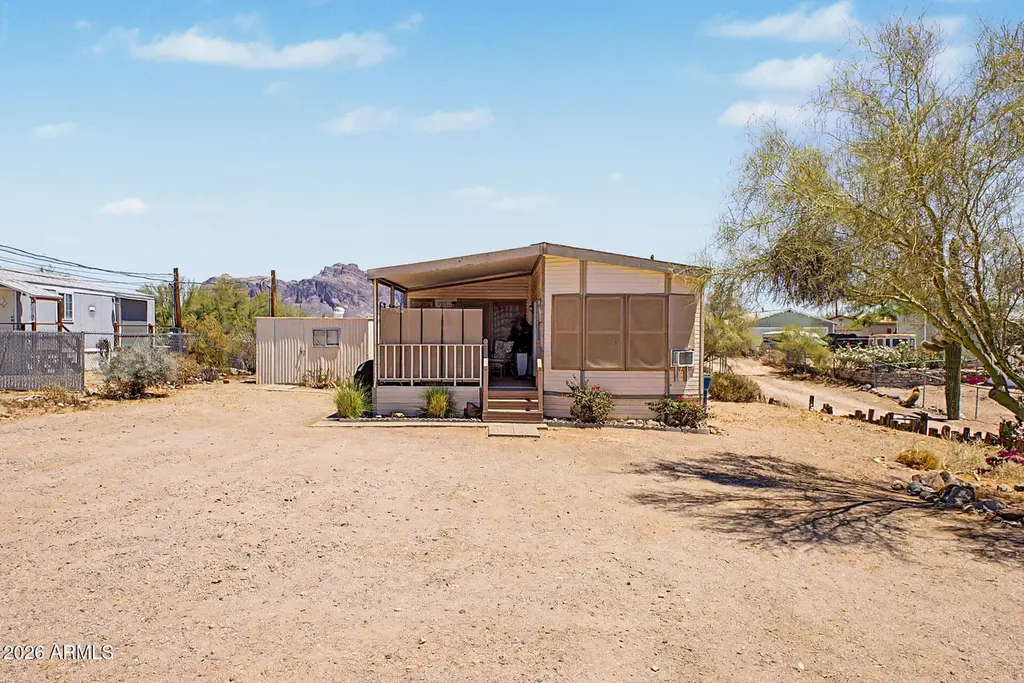
479 N Cactus Rd · Apache Junction, AZ
Flood risk 1/10 · Minimal
- FEMA flood zone
- X (unshaded)
- Chance of flooding over 30 yrs
- 0.0%
- Est. flood insurance / yr
- $507 – $1,088
Fire risk 6/10 · Moderate
- Est. fire insurance / yr
- $610 – $1,132
Heat risk 8/10 · Major
- Hot days now (above 111°F)
- 6 days/yr
- Hot days in 30 yrs
- 16 days/yr
Wind risk 1/10 · Minimal
- Chance of severe wind over 30 yrs
- —
Air-quality risk 3/10 · Minor
- Unhealthy air days now
- 3 days/yr
- Unhealthy air days in 30 yrs
- 4 days/yr
Risk factors via First Street. Map © Google.
Why this score? — see what drove the C- grade
The composite is a weighted blend of 9 inputs, each scored 0–100. Each bar is that input's sub-score; the figure is the points it added to the 100-point composite (weight × sub-score).
- Cash flow +22.6/30.0
- ARV discount +7.5/15.0
- DSCR +7.2/10.0
- 1% rule +4.6/10.0
- Livability +3.3/5.0
- Rent growth +2.9/5.0
- Condition / age +2.5/5.0
- Schools +1.5/10.0
- Appreciation +0.0/10.0
$165,000
🖨 Deal sheet 📄 Offer letter ✓ Due diligence
Listing remarks MLS
Great home with NO HOA. This home has been completely remodeled and upgraded. Fresh paint inside & out, new flooring, new appliances, new skirting and new ceiling fans. This large lot has stunning views of the Superstition Mountains. This would be a great winter retreat, investment property or full-time residence. Come see this wonderful home before it is gone!
Key facts
- 0.25 acre lot
- Built 1990
- Listed 3 days
Property features AI
Finance
- HOA & community: No association fees
Exterior
- Utilities: Septic (connected and in use); Private water company
- Home design: Manufactured/mobile home; Fee simple ownership
- Construction: Wood frame construction; Painted exterior; Composition roof
- Exterior features: Storage shed(s); Storage space; Chain-link fencing; East/West exposure; Natural desert front and back; Mountain view
Interior
- Kitchen: Built-in microwave; Disposal; Laminate countertops
- Bedrooms: 2 possible bedrooms
- Flooring: Laminate flooring
- Bathrooms: 1 full bathroom
- Heating & cooling: Electric heating; Central air; Ceiling fans
- Interior features: Vaulted ceilings; High-speed internet available; No interior steps; Dual-pane windows; Laminate counters
- Laundry & utility: Indoor laundry with washer/dryer hookup only
Neighborhood map
What this means for you Summary
Snapshot
- This is a 2-bed/1.0-bath manufactured listed at $165k.
Deal economics
- At list price, monthly cash flow is $281 ($3k/yr) — positive.
- The deal already cash-flows at list — no discount required.
- To meet the 1% rule (rent ≥ 1% of price), the offer needs to be $159k (3.7% below list).
- Recommended offer: $159k (3.7% below list) — sets the bar for 1% rule.
- Cap rate 8.3% vs local median 3.5% in Apache Junction — top-decile yield for the area; either an underpriced asset or a hidden risk that comps aren't pricing in. Stress-test before assuming the spread holds.
Location & tenants
- Location reads 66/100 on livability (#70 in AZ) — a middle-class / working-renter tenant base. Strengths: cost of living A+, housing A+; Watch: crime D+, amenities F, commute F.
- Apache Junction Unified District (4443) (suburban): math 15% / reading 20% proficiency, ranked #195 of 249 in AZ (top 78%) — low school quality limits family demand, transient renter base, plan for 1-2y turnover.
- Zoned schools: Desert Vista Elementary School (math 18% / reading 23%, grade F, #729 of 1,109 statewide, top 67%, 536 students, 50% FRL); Cactus Canyon Junior High (math 14% / reading 19%, grade F, #151 of 218 statewide, top 70%, 702 students, 50% FRL); Apache Junction High School (math 12% / reading 17%, grade F, #267 of 381 statewide, top 72%, 999 students, 48% FRL) — zoned schools at 49% FRL track the district average.
- Market conditions: Rents rising (+1.6%/yr); 354 active listings in the ZIP; 6 comparable units currently listed for rent nearby; rentals at typical pace (median 22d on market — plan ~3-4 weeks tenant-placement turnaround); 9,504 units permitted in Pinal County in 2024 (776 in 5+ unit buildings).
Forward outlook
- Local home prices are declining (-3.0%/yr); year-one equity from $1k of loan paydown is wiped out by about $5k of value loss. Plan a longer hold.
Negotiation context
- Only 3 days on market — expect competitive offers; lowballing is unlikely to land.
- 4 sale attempts since 19y ago with the ask held roughly flat each time — persistent listings suggest the price (not the market) is what's stuck; bring a comps-based counter.
- Current owner paid $85k; list at $165k implies a 94% gain — meaningful room to come down on a strong offer.
Risks & watch-outs
- Climate carrying-cost: major wildfire risk; extreme-heat days projected 6→16/yr by 2055 (HVAC capex compounding) — expect insurance premiums to compound above CPI over the hold.
Questions for the listing agent
- Is there a deadline driving the sale (1031 exchange, divorce, estate, relocation)? That informs how much negotiation room exists.
- Schools are F-rated, which usually means shorter tenancies and higher turnover. Who's the typical renter profile here, and what's been the actual vacancy rate?
- Crime grade is D in this area — have there been break-ins, vandalism, or insurance claims at this property in the last 3 years? What carrier currently insures it and at what premium?
- What's the average days-on-market for RENTAL listings here right now (not sales)? A rising rental-DOM trend means longer vacancies and softer asking-rent achievability than the comps imply.
- What's the recent tenant-quality profile in this submarket — average credit score on applications, eviction rate, late-payment / NSF rate, and stable-employment percentage? A property-management company in the area should have these aggregated.
- How much new for-sale + rental construction is in the pipeline within 1–3 miles? Heavy new supply typically softens prices + rents 12–24 months out; constrained supply supports both.
Investment metrics
- 1% rule
- 0.96% ✗
- Cap rate
- 8.34%
- Cash-on-cash
- 7.30%
- DSCR
- 1.32
- GRM
- 8.7
CMA / ARV
- ARV (on-the-fly)
- $33,880
- Comps found
- 7
Show comp detail 7 sales within ~0.75 mi
| Address | Dist | Beds/Ba | Sqft | Sold | Price | $/sf | Match |
|---|---|---|---|---|---|---|---|
| 269 N Winchester Rd #66 | 0.46mi | 2/1.0 | 840 (+9%) | 1mo | $55,000 | $65 | 62 |
| 1050 E Broadway Ave #10 | 0.61mi | 2/1.0 | 768 (-0%) | 10mo | $23,000 | $30 | 62 |
| 1050 E Broadway Ave #39 | 0.61mi | 2/2.0 | 800 (+4%) | 8mo | $35,000 | $44 | 55 |
| 1050 E Broadway Ave #7 | 0.67mi | 1/1.0 (-1) | 750 (-3%) | 7mo | $27,000 | $36 | 54 |
| 269 N Winchester Rd #36 | 0.50mi | 1/1.0 (-1) | 660 (-14%) | 3mo | $18,000 | $27 | 45 |
| 673 N Vista Rd | 0.62mi | 2/1.0 | 660 (-14%) | 15mo | $363,750 | $551 | 35 |
| 1725 E 2nd Ave | 0.54mi | 2/1.8 | 879 (+14%) | 21mo | $278,000 | $316 | 30 |
Match score weights: distance 35% · size 25% · config 20% · recency 20%. Top-matched comps best support the ARV.
Projected returns pro-forma
-3.0% appreciation · 1.57% rent growth · sell at horizon
- IRR
- -6.6%
- Equity multiple
- 0.76×
- Total profit
- $-11,171
- Equity at exit
- $24,602
- IRR
- 1.3%
- Equity multiple
- 1.09×
- Total profit
- $4,017
- Equity at exit
- $14,266
Cash invested: $46,200 (down + closing). Projections, not guarantees.
Landlord ↔ Tenant lean methodology
- Overall (STATE)
- 87 Strongly Landlord-Friendly
- State Arizona
- 87 Strongly Landlord-Friendly · R+3
- County
- — inherits STATE
- City
- — inherits STATE
ZIP-level market 85119
- Home prices YoY
- -33.5%
- Rents YoY
- 1.6%
- Active inventory
- 354
- Price-to-rent
- 8.7×
Monthly cashflow live
- Estimated rent
- $1,588 high interval (Pro) →
- Mortgage (P&I)
- −$865
- Tax from tax record
- −$40 /mo · $476/yr
- Insurance
- −$69
- HOA
- −$0
- Vacancy / Maint / Mgmt
- −$334
- Net cashflow
- $281
Break-even live
UW: 25.0% down · 7.5% · 30yr · 1.5% tax · 5.0% vac · 8.0% maint · 8.0% mgmt
Financing live
Cash to close
- Down payment
- $41,250
- Closing costs
- $4,950
- Reserves months
- —
- Total cash needed
- —
Loan-product check · same deal, 3 products live
Conventional
25% down · 7.5% · 30yr
- Down + closing
- —
- Monthly P&I
- —
- Monthly cashflow
- —
- DSCR
- —
- Eligible?
- —
Personal DTI + credit; lowest rate.
DSCR
20% down · 8.5% · 30yr
- Down + closing
- —
- Monthly P&I
- —
- Monthly cashflow
- —
- DSCR
- —
- Eligible?
- —
No personal income docs; deal must DSCR.
Hard money
10% down · 12.0% · 12mo
- Down + closing
- —
- Monthly P&I
- —
- Monthly cashflow
- —
- DSCR
- —
- Eligible?
- —
Short-term bridge; refi at stabilization.
Rent comps 6 comps
| Address | Beds | Baths | Sqft | Rent | $/sqft | DOM | Units | Dist |
|---|---|---|---|---|---|---|---|---|
| 695 E Superstition Blvd Apache Junction, AZ | 1.0–3.0 | 1.0–2.0 | 983 | $1,860 | $1.89 | 2d | 13 | 0.36mi |
| 111 S Outpost Rd Unit 4 Apache Junction, AZ | 2.0 | 1.0 | 775 | $1,175 | $1.52 | 24d | 1 | 0.64mi |
| 1297 E Broadway Ave Apache Junction, AZ | 1.0–3.0 | 1.0–2.0 | 954 | $1,937 | $2.03 | 1d | 29 | 0.86mi |
| 975 S Royal Palm Rd Apache Junction, AZ | 2.0–3.0 | 2.0 | 1000 | $1,325 | $1.32 | 2d | 13 | 0.91mi |
| 1440 N Idaho Rd Apache Junction, AZ | 1.0–2.0 | 1.0–1.5 | 1010 | $1,900 | $1.88 | 24d | 3 | 1.02mi |
| 452 E 10th Ave Unit 104 Apache Junction, AZ | 2.0 | 1.0 | 783 | $1,000 | $1.28 | 22d | 1 | 1.03mi |
Listing history 13 events
-
2026-05-11status Pending
-
2026-05-08$165,000 Active
-
2019-10-21soldstatus $85,000
-
2016-03-09soldstatus $56,300 Closed 367-char remark
Show marketing remark (367 chars)
Great home with NO HOA. This home has been completely remodeled and upgraded. Fresh paint inside & out, new flooring, new appliances, new skirting and new ceiling fans. This large lot has stunning views of the Superstition Mountains. This would be a great winter retreat, investment property or full-time residence. Come see this wonderful home before it is gone!
-
2016-03-09soldstatus $58,800
Show marketing remark (367 chars)
Great home with NO HOA. This home has been completely remodeled and upgraded. Fresh paint inside & out, new flooring, new appliances, new skirting and new ceiling fans. This large lot has stunning views of the Superstition Mountains. This would be a great winter retreat, investment property or full-time residence. Come see this wonderful home before it is gone!
-
2016-02-09status Pending 367-char remark
Show marketing remark (367 chars)
Great home with NO HOA. This home has been completely remodeled and upgraded. Fresh paint inside & out, new flooring, new appliances, new skirting and new ceiling fans. This large lot has stunning views of the Superstition Mountains. This would be a great winter retreat, investment property or full-time residence. Come see this wonderful home before it is gone!
-
2016-02-03$58,800 Active 367-char remark
Show marketing remark (367 chars)
Great home with NO HOA. This home has been completely remodeled and upgraded. Fresh paint inside & out, new flooring, new appliances, new skirting and new ceiling fans. This large lot has stunning views of the Superstition Mountains. This would be a great winter retreat, investment property or full-time residence. Come see this wonderful home before it is gone!
-
2015-05-26soldstatus $24,000 Closed 170-char remark
Show marketing remark (170 chars)
One bedroom park model with great room and front porch. Needs TLC. The home is on a 1/4 acre lot with views of the Superstition Mountains. Good investment opportunity.
-
2015-05-20status Pending 170-char remark
Show marketing remark (170 chars)
One bedroom park model with great room and front porch. Needs TLC. The home is on a 1/4 acre lot with views of the Superstition Mountains. Good investment opportunity.
-
2015-05-06$30,000 Active 170-char remark
Show marketing remark (170 chars)
One bedroom park model with great room and front porch. Needs TLC. The home is on a 1/4 acre lot with views of the Superstition Mountains. Good investment opportunity.
-
2007-05-04historical
-
2007-04-03$79,000
-
1997-07-24soldstatus $46,000
ⓘ Source: listings_history table (triggers on properties + properties_extension) + one-shot
backfill from property_details.listing_events for pre-trigger history.
Tax reassessment forecast AZ · Resets to sale price
- Current annual tax
- $476 · $40/mo
- Projected year-2 tax
- $1,089 · $91/mo
- Expected delta
- +$613/yr (+$51/mo · 128.8%)
ⓘ Screening estimate from a state-policy table — verify with the county assessor before closing.
Climate risk First Street
- Flood 1/10 Low FEMA zone X (unshaded) · 0% chance over 30 yrs
- Wildfire 6/10 Major
- Heat 8/10 Severe 6 d/yr ≥111°F today · 16 d/yr by 30 yrs out
- Wind 1/10 Low
- Air quality 3/10 Moderate 3 unhealthy d/yr today · 4 by 30 yrs out
Nearby sold comps map
Loading sold comps map…
Walkable amenities ~0.75 mi
Loading nearby amenities…
Taxation est. · year 1
- Rental income
- $19,059
- − Mortgage interest
- −$9,243
- − Property taxes
- −$476
- − Insurance
- −$825
- − Repairs & maintenance
- −$1,525
- − Management
- −$1,525
- − Depreciation
- −$4,800
- Taxable income
- $666
- Est. tax owed @ 24.0%
- −$160
- After-tax cash flow
- $3,212/yr
For passive investors: Depreciation is non-cash, so a rental often shows a tax loss while cash-flowing — sheltering income. Rental losses are passive: they offset passive income freely, and up to $25,000/yr can offset ordinary (W-2) income if you actively participate and your MAGI is under $100k (phasing out to $0 by $150k); unused losses carry forward. On sale, claimed depreciation is recaptured at up to 25%, and gains may owe capital-gains tax (a 1031 exchange can defer both). Figures are a year-1 estimate at your 24.0% rate — not tax advice; consult a CPA.
Schools (NCES district)
- District
- Apache Junction Unified District (4443)
- NCES district ID
- 0400790
- Math proficiency
- 15% ▼ -17.00%
- Reading proficiency
- 20% ▼ -13.00%
- Median HH income
- $44,930
- Composite
- 15.34/100
- National rank
- #9325
- State rank
- #195 of 249 in AZ
Livability — Apache Junction
- Score
- 66/100
- State rank
- #70
- US rank
- #11242
Category grades
Schools grade is shown separately in the Schools card above.
Census & demographics
- Census place
- Apache Junction, AZ
- County
- Pinal County · 399,947 people
- City population
- 56,611
- Metro
- Phoenix-Mesa-Chandler, AZ
- Population (ZIP)
- 25,420
- Household income
- $71,585
- Rent vs Own
- Severe rent burden
- 305.0
Population outlook (Pinal County) Hauer SSP2
- Today (2025)
- 437,574 people
- By 2030
- 446,903 · +2.1%
- By 2040
- 452,589 · +3.4%
- By 2050
- 444,126 · +1.5%
- By 2075
- 430,300 · -1.7%
- By 2100
- 393,536 · -10.1%
Race, ethnicity, and origin ACS 2023
- Neighborhood character
- Predominantly White (74%)
- Race & ethnicity
- White 74% Hispanic / Latino 19% Two or more races 12% Black 2% Asian 1%
- Hispanic origin (detail)
- Mexican 17%
- Common ancestry
- Slovak 5% Portuguese 3% Lithuanian 3%
- Foreign-born
- 8% · Canada
- Languages at home
- 87% English-only · Spanish 11%
Political lean MEDSL · Pinal
- 2024 margin
- Strong R (+22.1) · D 38.5% · R 60.6%
- 2008→2024 swing
- -7.6pp toward R · 2008: -14.5pp · 2024: -22.1pp
- All cycles
- 2024: R+22.1 2020: R+17.3 2016: R+19.3 2012: R+17.1 2008: R+14.5
Not yet ingested
- Civics
- —
Market trends
- HPI YoY
- ▼ -138.19%
- Current HPI
- 274.3808
- Rent YoY
- ▲ 1.57%
- Metro
- Phoenix-Mesa-Chandler, AZ
- State GDP YoY
- ▲ 4.54%
- F500 in state
- 20
Industry mix (Fortune 500 HQ in AZ)
| Industry | F500 HQs | Revenue |
|---|---|---|
| Technology | 2 | $13B |
|
||
| Mining / Metals | 1 | $23B |
|
||
| Environmental Services | 1 | $16B |
|
||
| Metals / Steel | 1 | $14B |
|
||
| Technology Distribution | 1 | $9B |
|
||
| Homebuilding | 1 | $8B |
|
||
Price history
+258.7% since first listed13 events — show timeline
- 2026-05-11 Pending — ARMLS
- 2026-05-08 Listed $165,000 ARMLS
- 2019-10-21 Sold (Public Records) $85,000 Public Records
- 2016-03-09 Sold (Public Records) $58,800 Public Records
- 2016-03-09 Sold (MLS) $56,300 ARMLS
- 2016-02-09 Pending — ARMLS
- 2016-02-03 Listed $58,800 ARMLS
- 2015-05-26 Sold (MLS) $24,000 ARMLS
- 2015-05-20 Pending — ARMLS
- 2015-05-06 Listed $30,000 ARMLS
- 2007-05-04 Listing Removed — ARMLS
- 2007-04-03 Listed $79,000 ARMLS
- 1997-07-24 Sold (Public Records) $46,000 Public Records
Property tax history
-0.5%/yrLatest (2025): $476 · +4.3% YoY. Source: county tax records.
Cash-flow waterfall
monthlySold comps — $/sqft
last 12 mo · ≤1 miLoading sold comps…