 Duplex
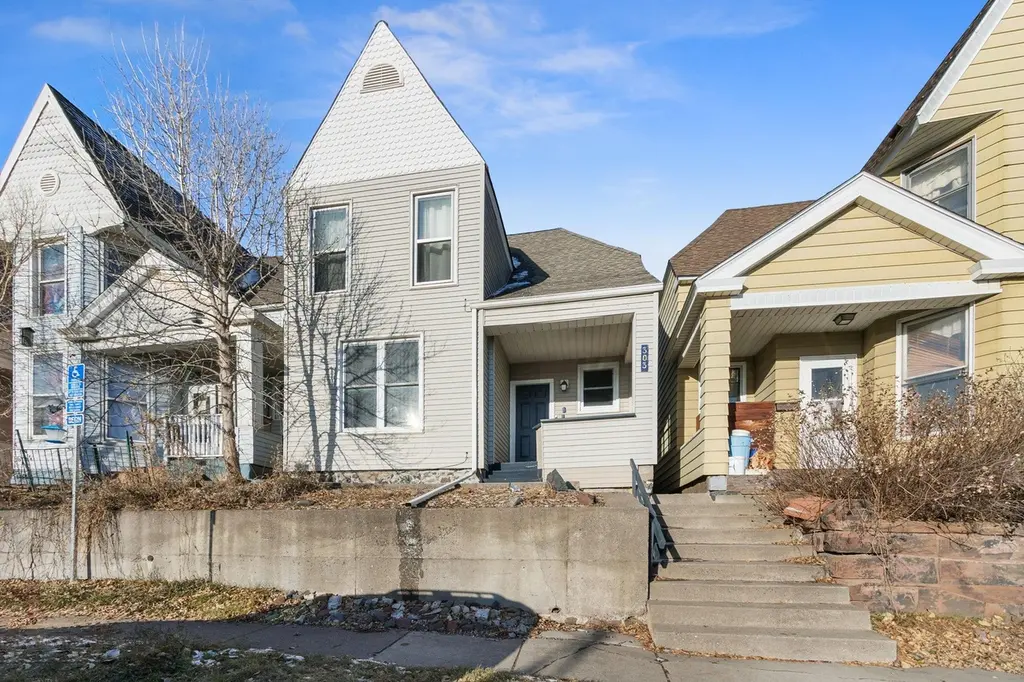
303 W 4th St · Duluth, MN
Flood risk 1/10 · Minimal
- FEMA flood zone
- X
- Chance of flooding over 30 yrs
- 0.0%
- Est. flood insurance / yr
- $473 – $860
Fire risk 1/10 · Minimal
- Est. fire insurance / yr
- $888 – $1,650
Heat risk 2/10 · Minimal
- Hot days now (above 91°F)
- 7 days/yr
- Hot days in 30 yrs
- 13 days/yr
Wind risk 1/10 · Minimal
- Chance of severe wind over 30 yrs
- —
Air-quality risk 2/10 · Minimal
- Unhealthy air days now
- 0 days/yr
- Unhealthy air days in 30 yrs
- 1 days/yr
Risk factors via First Street. Map © Google.
Why this score? — see what drove the C+ grade
The composite is a weighted blend of 9 inputs, each scored 0–100. Each bar is that input's sub-score; the figure is the points it added to the 100-point composite (weight × sub-score).
- Cash flow +30.0/30.0
- 1% rule +10.0/10.0
- DSCR +10.0/10.0
- Schools +4.2/10.0
- Livability +4.1/5.0
- Rent growth +2.5/5.0
- Condition / age +2.5/5.0
- ARV discount +0.0/15.0
- Appreciation +0.0/10.0
$225,000
🖨 Deal sheet 📄 Offer letter ✓ Due diligence
Multi-family units
County records classify this as Multi-Family (2-4 Unit). Listing-text estimate: 2 units. confirmed
Listing remarks MLS
Very SOLID up-down renovated duplex. Owner occupy, use as your retreat & cash flow with the other unit or college rental or investment. Central location for all the colleges, downtown, canal park, Goat Hill & Hermantown. Son graduated so ready for a new owner to enjoy and/or make a profit. Both units completely updated. New paint, flooring, some new sheetrock walls & ceilings, kitchens including plumbing, cabinets counter tops, appliances. Both baths completed updated; new plumbing, vanities, toilets tub/shower. The main level unit has new in unit laundry, dishwasher, small private patio area. Basement access is in the kitchen. Dependable Trane furnace, new 50 gallon water heater. Beautiful panoramic views of Lake Superior, lift bridge, Canal Park and skyline. Vinyl siding, wrapped soffit and facia for minimum maintenance. Many new vinyl windows, Nice covered front porch for grilling & chilling viewing lake superior, the harbor & city.
Key facts
- Recent updates
- Dishwasher
- Panoramic views
Tags
Property features AI
Finance
- Other: Rental property (residential income duplex)
- Financial info: Two units total; Gross income: $30,264; Net operating income: $22,340; Fuel expense: $2,436; Electric expense: $1,847; Maintenance expense: $951; Rental license: Standard; property is licensed for rental; Tenants pay electricity
Exterior
- Utilities: City water connected; City sewer connected; Natural gas
- Home design: Residential income property; Duplex (up and down); Two-story; Owner not occupying
- Construction: 920 sq ft foundation area; Other foundation type
- Exterior features: Stone and vinyl exterior; Front porch; Lake view; road between home and waterfront
Interior
- Kitchen: Ranges; Refrigerators; Dishwasher (in one unit); Microwave (in one unit)
- Bedrooms: Total of 4 bedrooms (two 2-bedroom units)
- Bathrooms: Two full bathrooms (one in each unit)
- Heating & cooling: Forced air heating
- Interior features: Two levels; Unfinished basement with single-tenant access; Front porch; City and lake views (Lake Superior)
- Laundry & utility: In-unit washer and dryer (in one unit)
Neighborhood map
What this means for you Summary
Snapshot
- This is a 2 × 2-bed/1.0-bath units multifamily listed at $225k.
Deal economics
- At list price, monthly cash flow is $1k ($15k/yr) — positive. Per door: $646/mo.
- The deal already cash-flows at list — no discount required.
- Meets the 1% rule at list price ($4k rent vs $225k).
- Recommended offer: $222k (1.5% below list) — sets the bar for market timing.
- Cap rate 13.2% vs local median 4.9% in Duluth — top-decile yield for the area; either an underpriced asset or a hidden risk that comps aren't pricing in. Stress-test before assuming the spread holds.
Location & tenants
- Location reads 82/100 on livability (#36 in MN, #1,060 nationally) — a professional / high-income tenant draw. Strengths: commute A+, cost of living A+, housing A+; Watch: amenities F.
- Duluth Public School District (urban): math 44% / reading 55% proficiency, ranked #132 of 301 in MN (top 44%) — families likely to look elsewhere, expect single-tenant / working-renter base with shorter leases.
- Market conditions: 44 active listings in the ZIP; 10 comparable units currently listed for rent nearby; rentals lingering (median 44d on market — plan ~5-8 weeks vacancy on turnover, expect pricing pressure); 50% of comp listings sitting > 30 days — soft ceiling on asking rent; lower-income renter base — watch delinquency; 639 units permitted in St. Louis County in 2024 (338 in 5+ unit buildings).
- At $3,515/mo this rent would consume 98% of the median local household income ($43k/yr) (locally 506% of renters already pay >50% of income on rent) — very limited rent-growth headroom before tenants either downsize or default.
Forward outlook
- Local home prices are declining (-3.0%/yr); year-one equity from $2k of loan paydown is wiped out by about $7k of value loss. Plan a longer hold.
- At projected returns (-3.0% appreciation + 3.0% rent growth), your $63k cash investment doubles in ~5 years — after that, you're playing with house money.
Negotiation context
- It's been on market 18 days — a 2% lower offer ($222k) is reasonable based on typical stale-listing flexibility.
- 5 sale attempts since 13y ago with the ask held roughly flat each time — persistent listings suggest the price (not the market) is what's stuck; bring a comps-based counter.
Risks & watch-outs
- Watch-outs: built in 1882 — expect roof / HVAC / electrical / plumbing capex.
Questions for the listing agent
- Can we see the unit-by-unit rent roll, current vacancy, and any below-market leases? What's the average tenancy length?
- What capital expenditures (roof, boiler, parking lot, exteriors) have been made in the last 5 years, and what's planned in the next 2?
- Built in 1882 — when were the roof, HVAC, electrical panel, plumbing, and water heater last replaced?
- Is there a deadline driving the sale (1031 exchange, divorce, estate, relocation)? That informs how much negotiation room exists.
- Schools are B-rated — typically a magnet for longer-tenancy family renters. What's the average tenant stay here, and is there a school-zone premium baked into asking?
- What's the average days-on-market for RENTAL listings here right now (not sales)? A rising rental-DOM trend means longer vacancies and softer asking-rent achievability than the comps imply.
- What's the recent tenant-quality profile in this submarket — average credit score on applications, eviction rate, late-payment / NSF rate, and stable-employment percentage? A property-management company in the area should have these aggregated.
- How much new apartment / multifamily construction is in the pipeline within 1–3 miles? Heavy new supply (>2% of stock underway) typically softens rents 12–24 months out; light construction supports rent growth.
Investment metrics
- 1% rule
- 1.56% ✓
- Cap rate
- 13.18%
- Cash-on-cash
- 24.60%
- DSCR
- 2.09
- GRM
- 5.3
CMA / ARV
- ARV (on-the-fly)
- $169,470
- Comps found
- 4
Show comp detail 4 sales within ~0.75 mi
| Address | Dist | Beds/Ba | Sqft | Sold | Price | $/sf | Match |
|---|---|---|---|---|---|---|---|
| 305 W 4th St | 0.01mi | 4/2.0 (+1) | 1,648 (+2%) | 11mo | $165,000 | $100 | 82 |
| 307 W 4th St | 0.01mi | 4/2.0 (+1) | 1,572 (-3%) | 11mo | $165,000 | $105 | 81 |
| 628 W 3rd St | 0.33mi | 3/2.0 | 1,592 (-1%) | 3mo | $185,000 | $116 | 80 |
| 321 N 11th Ave Ave W | 0.70mi | 4/1.0 (+1) | 1,440 (-11%) | 23mo | $127,000 | $88 | 21 |
Match score weights: distance 35% · size 25% · config 20% · recency 20%. Top-matched comps best support the ARV.
Projected returns pro-forma
-3.0% appreciation · 3.0% rent growth · sell at horizon
- IRR
- 18.0%
- Equity multiple
- 1.73×
- Total profit
- $45,797
- Equity at exit
- $33,548
- IRR
- 26.4%
- Equity multiple
- 3.31×
- Total profit
- $145,827
- Equity at exit
- $19,454
Cash invested: $63,000 (down + closing). Projections, not guarantees.
Landlord ↔ Tenant lean methodology
- Overall (STATE)
- 46 Balanced
- State Minnesota
- 46 Balanced · D+2
- County
- — inherits STATE
- City
- — inherits STATE
ZIP-level market 55806
- Active inventory
- 44
- Price-to-rent
- 10.7×
Monthly cashflow live
- Estimated rent
- $3,515 high interval (Pro) →
- Mortgage (P&I)
- −$1,180
- Tax from tax record
- −$212 /mo · $2,542/yr
- Insurance
- −$94
- HOA
- −$0
- Vacancy / Maint / Mgmt
- −$738
- Net cashflow
- $1,291
Break-even live
2-unit breakdown (identical units grouped — click to expand)
| Units | Beds | Baths | Est. rent |
|---|---|---|---|
| 2× units | 2 | 1 | $3,516 |
| #1 | 2 | 1 | $1,758 |
| #2 | 2 | 1 | $1,758 |
| Total (2 units) | $3,515 | ||
UW: 25.0% down · 7.5% · 30yr · 1.5% tax · 5.0% vac · 8.0% maint · 8.0% mgmt
Financing live
Cash to close
- Down payment
- $56,250
- Closing costs
- $6,750
- Reserves months
- —
- Total cash needed
- —
Loan-product check · same deal, 3 products live
Conventional
25% down · 7.5% · 30yr
- Down + closing
- —
- Monthly P&I
- —
- Monthly cashflow
- —
- DSCR
- —
- Eligible?
- —
Personal DTI + credit; lowest rate.
DSCR
20% down · 8.5% · 30yr
- Down + closing
- —
- Monthly P&I
- —
- Monthly cashflow
- —
- DSCR
- —
- Eligible?
- —
No personal income docs; deal must DSCR.
Hard money
10% down · 12.0% · 12mo
- Down + closing
- —
- Monthly P&I
- —
- Monthly cashflow
- —
- DSCR
- —
- Eligible?
- —
Short-term bridge; refi at stabilization.
Rent comps 10 comps
| Address | Beds | Baths | Sqft | Rent | $/sqft | DOM | Units | Dist |
|---|---|---|---|---|---|---|---|---|
| 513 N 1st Ave W Unit 509 Duluth, MN | 2.0 | 1.0 | 1300 | $1,355 | $1.04 | 43d | 1 | 0.18mi |
| 100 N 5th Ave W Duluth, MN | 3.0 | 1.0–2.0 | 1209 | $3,299 | $2.73 | 20d | 7 | 0.24mi |
| 100 N 5th Ave W Duluth, MN | 3.0 | 1.0–2.0 | 1207 | $3,999 | $3.31 | 13d | 1 | 0.24mi |
| 13 E 8th St Duluth, MN | 4.0 | 1.5 | 1388 | $2,000 | $1.44 | 43d | 1 | 0.40mi |
| 311 E Superior St #902 Duluth, MN | 2.0 | 2.0 | 1500 | $3,995 | $2.66 | 43d | 1 | 0.65mi |
| 333 E Superior St Duluth, MN | 2.0 | 1.0–2.0 | 1154 | $5,822 | $5.05 | 13d | 96 | 0.68mi |
| 425 E 5th St Duluth, MN | 3.0 | 1.0 | 1124 | $1,995 | $1.77 | 43d | 1 | 0.70mi |
| 916 E 3rd St Duluth, MN | 2.0 | 1.0 | 1325 | $1,750 | $1.32 | 13d | 1 | 1.12mi |
| 825 N 10th Ave E Duluth, MN | 3.0 | 1.0 | 1120 | $1,800 | $1.61 | 43d | 1 | 1.19mi |
| 426 N 13th Ave E Duluth, MN | 3.0 | 1.0 | 1248 | $1,900 | $1.52 | 13d | 1 | 1.44mi |
Listing history 15 events
-
2026-06-19days on market $225,000 Active 18 DOM
-
2026-06-18days on market $225,000 Active 17 DOM
-
2026-06-17days on market $225,000 Active 16 DOM
-
2026-06-16days on market $225,000 Active 15 DOM
-
2026-06-15days on market $225,000 Active 14 DOM
-
2026-06-14days on market $225,000 Active 12 DOM
-
2026-06-13days on market $225,000 Active 11 DOM
-
2026-06-10days on market $225,000 Active 9 DOM
-
2026-06-09days on market $225,000 Active 8 DOM
-
2026-06-08days on market $225,000 Active 7 DOM
-
2026-06-07days on market $225,000 Active 6 DOM
-
2026-06-05days on market $225,000 Active 3 DOM
-
2026-06-03days on market $225,000 Active 2 DOM
-
2026-06-01remarks 482-char remark
-
2026-06-01$225,000 Active 1 DOM
ⓘ Source: listings_history table (triggers on properties + properties_extension) + one-shot
backfill from property_details.listing_events for pre-trigger history.
Tax reassessment forecast MN · Partial reset (capped growth)
- Current annual tax
- $2,542 · $212/mo
- Projected year-2 tax
- $2,542 · $212/mo
- Expected delta
- $0/yr ($0/mo · 0.0%)
ⓘ Screening estimate from a state-policy table — verify with the county assessor before closing.
Climate risk First Street
- Flood 1/10 Low FEMA zone X · 0% chance over 30 yrs
- Wildfire 1/10 Low
- Heat 2/10 Low 7 d/yr ≥91°F today · 13 d/yr by 30 yrs out
- Wind 1/10 Low
- Air quality 2/10 Low 0 unhealthy d/yr today · 1 by 30 yrs out
Nearby sold comps map
Loading sold comps map…
Walkable amenities ~0.75 mi
Loading nearby amenities…
Taxation est. · year 1
- Rental income
- $42,180
- − Mortgage interest
- −$12,603
- − Property taxes
- −$2,542
- − Insurance
- −$1,125
- − Repairs & maintenance
- −$3,374
- − Management
- −$3,374
- − Depreciation
- −$6,545
- Taxable income
- $12,615
- Est. tax owed @ 24.0%
- −$3,028
- After-tax cash flow
- $12,468/yr
For passive investors: Depreciation is non-cash, so a rental often shows a tax loss while cash-flowing — sheltering income. Rental losses are passive: they offset passive income freely, and up to $25,000/yr can offset ordinary (W-2) income if you actively participate and your MAGI is under $100k (phasing out to $0 by $150k); unused losses carry forward. On sale, claimed depreciation is recaptured at up to 25%, and gains may owe capital-gains tax (a 1031 exchange can defer both). Figures are a year-1 estimate at your 24.0% rate — not tax advice; consult a CPA.
Schools (NCES district)
- District
- Duluth Public School District
- NCES district ID
- 2711040
- Math proficiency
- 44% ▼ -10.00%
- Reading proficiency
- 55% ▼ -6.00%
- Median HH income
- $45,692
- Composite
- 41.92/100
- National rank
- #3360
- State rank
- #132 of 301 in MN
Livability — Duluth
- Score
- 82/100
- State rank
- #36
- US rank
- #1060
Category grades
Schools grade is shown separately in the Schools card above.
Census & demographics
- Census place
- Duluth, MN
- County
- Saint Louis County · 115,152 people
- City population
- 71,097
- Metro
- Duluth, MN-WI
- Population (ZIP)
- 9,356
- Household income
- $42,833
- Rent vs Own
- Severe rent burden
- 506.0
Population outlook (St. Louis County) Hauer SSP2
- Today (2025)
- 202,411 people
- By 2030
- 203,234 · +0.4%
- By 2040
- 202,520 · +0.1%
- By 2050
- 200,853 · -0.8%
- By 2075
- 200,943 · -0.7%
- By 2100
- 192,058 · -5.1%
Race, ethnicity, and origin ACS 2023
- Neighborhood character
- Predominantly White (79%)
- Race & ethnicity
- White 79% Two or more races 7% Black 7% Native American 5% Hispanic / Latino 3% Asian 1%
- Common ancestry
- Portuguese 10% Romanian 5% Scottish 2%
- Foreign-born
- 4% · Canada, China
- Languages at home
- 93% English-only · Other Indo-European 2% Spanish 2% Chinese 1%
Political lean MEDSL · St. Louis
- 2024 margin
- D (+13.7) · D 55.9% · R 42.2% · Other 1.8%
- 2008→2024 swing
- -18.8pp toward R · 2008: 32.5pp · 2024: 13.7pp
- All cycles
- 2024: D+13.7 2020: D+15.6 2016: D+11.8 2012: D+29.6 2008: D+32.5
Not yet ingested
- Civics
- —
Market trends
- HPI YoY
- ▼ -122.85%
- Current HPI
- 195.9805
- Rent YoY
- —
- Metro
- Duluth, MN-WI
- State GDP YoY
- ▲ 2.41%
- F500 in state
- 34
Industry mix (Fortune 500 HQ in MN)
| Industry | F500 HQs | Revenue |
|---|---|---|
| Healthcare | 2 | $407B |
|
||
| Retail | 2 | $150B |
|
||
| Consumer Goods | 2 | $32B |
|
||
| Industrial Machinery | 2 | $6B |
|
||
| Agriculture | 1 | $40B |
|
||
| Healthcare / Medical Devices | 1 | $32B |
|
||
Price history
+246.7% since first listed13 events — show timeline
- 2026-06-01 Listed $225,000 NORTHSTARMLS as Distributed by MLS Grid
- 2023-10-13 Sold (Public Records) $205,000 Public Records
- 2023-09-12 Sold (MLS) $205,000 NORTHSTARMLS as Distributed by MLS Grid
- 2023-08-15 Pending — NORTHSTARMLS as Distributed by MLS Grid
- 2023-08-03 Listed $199,900 NORTHSTARMLS as Distributed by MLS Grid
- 2020-02-27 Sold (MLS) $77,920 LSAR
- 2020-02-27 Sold (MLS) $77,920 NORTHSTARMLS as Distributed by MLS Grid
- 2020-01-06 Pending — NORTHSTARMLS as Distributed by MLS Grid
- 2019-09-05 Listed $95,000 NORTHSTARMLS as Distributed by MLS Grid
- 2019-08-19 Listed $95,000 LSAR
- 2013-10-28 Sold (Public Records) $64,000 Public Records
- 2013-09-27 Sold (MLS) $64,000 NORTHSTARMLS as Distributed by MLS Grid
- 2013-05-08 Listed $64,900 NORTHSTARMLS as Distributed by MLS Grid
Property tax history
+6.3%/yrLatest (2025): $2,542 · +48.5% YoY. Source: county tax records.
Cash-flow waterfall
monthlySold comps — $/sqft
last 12 mo · ≤1 miLoading sold comps…