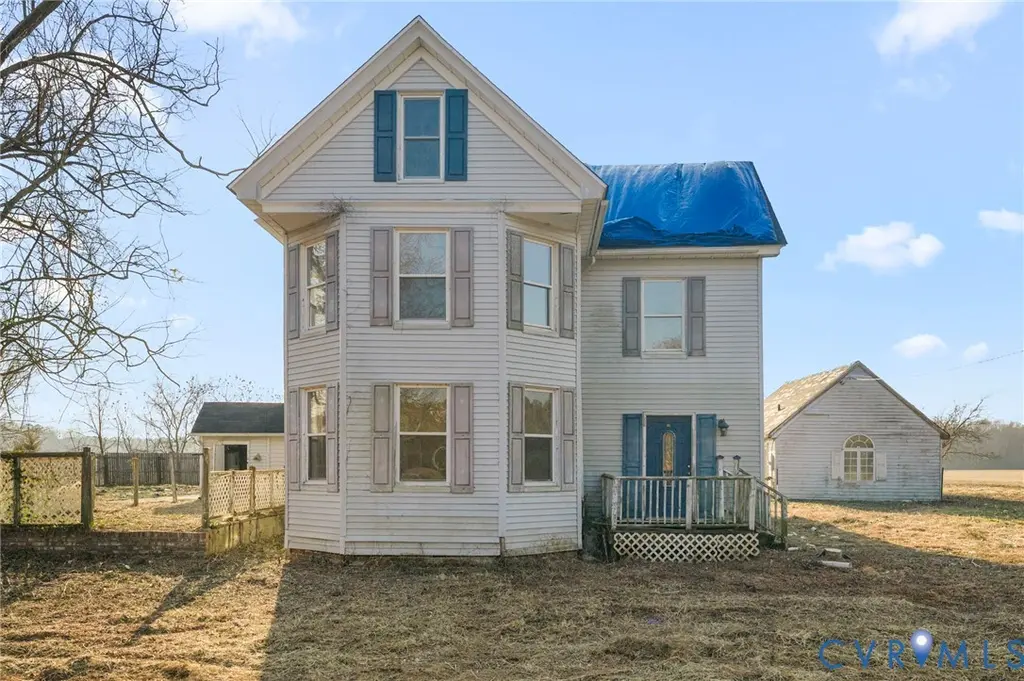
9144 General Puller Hwy · Weems, VA
Flood risk 1/10 · Minimal
- FEMA flood zone
- X (unshaded)
- Chance of flooding over 30 yrs
- 0.0%
- Est. flood insurance / yr
- $507 – $1,088
Fire risk 3/10 · Minor
- Est. fire insurance / yr
- $666 – $1,236
Heat risk 9/10 · Severe
- Hot days now (above 105°F)
- 7 days/yr
- Hot days in 30 yrs
- 17 days/yr
Wind risk 8/10 · Major
- Chance of severe wind over 30 yrs
- 80.0%
Air-quality risk 1/10 · Minimal
- Unhealthy air days now
- 0 days/yr
- Unhealthy air days in 30 yrs
- 0 days/yr
Risk factors via First Street. Map © Google.
Why this score? — see what drove the B grade
The composite is a weighted blend of 9 inputs, each scored 0–100. Each bar is that input's sub-score; the figure is the points it added to the 100-point composite (weight × sub-score).
- Cash flow +30.0/30.0
- DSCR +10.0/10.0
- 1% rule +9.7/10.0
- ARV discount +7.5/15.0
- Schools +4.5/10.0
- Appreciation +4.2/10.0
- Rent growth +2.5/5.0
- Livability +2.5/5.0
- Condition / age +2.5/5.0
$99,950
🖨 Deal sheet 📄 Offer letter ✓ Due diligence
Listing remarks
* * SELLER FINANCING AVAILABLE * * WHAT A DEAL!! Welcome to this charming handyman special. Offering (2,500) square feet with 3 spacious bedrooms, 2 full bathrooms, 1 half bathroom, additional living quarters, and a large open yard. This property is being sold as-is, presenting a unique opportunity for customization. Although this is not an REO property, it does need repairs, and some TLC. This is a perfect opportunity to remodel to your taste and make it the perfect home for you to move into. For investors, this home will make a great investment property and should cash flow very well while building wealth or rehab for a quick profit. List price is based on needed repairs. Similar updat
Key facts
- 1.34 acre lot
- Built 1924
Property features AI
Exterior
- Utilities: Well water; Septic tank
- Home design: 2-story home; Above-grade finished area approximately 2,500
- Construction: Frame construction with vinyl siding; Shingle roof
- Exterior features: Lot approximately 1.345 acres; Zoned LDR
Interior
- Bathrooms: Three full bathrooms; One half bathroom; First-floor half bath; First-floor full bath with tub & shower
- Heating & cooling: Baseboard electric heating
- Interior features: 8 total rooms; Resale condition
Neighborhood map
What this means for you Summary
Snapshot
- This is a 3-bed/2.5-bath single-family listed at $100k.
Deal economics
- At list price, monthly cash flow is $483 ($6k/yr) — positive.
- The deal already cash-flows at list — no discount required.
- Meets the 1% rule at list price ($1k rent vs $100k).
- Cap rate 12.1% vs local median 1.1% in Weems — top-decile yield for the area; either an underpriced asset or a hidden risk that comps aren't pricing in. Stress-test before assuming the spread holds.
Location & tenants
- Location reads: area grade B — affects rentability + tenant quality, not the cash-flow math above.
- Middlesex County Public School District (rural): math 45% / reading 59% proficiency, ranked #90 of 131 in VA (top 69%) — acceptable for families but not a draw, mixed tenant base, ~2y average lease.
- Market conditions: 15 active listings in the ZIP; 97 units permitted in Middlesex County in 2024 (0 in 5+ unit buildings).
Forward outlook
- Local home prices are declining (-1.7%/yr); year-one equity from $692 of loan paydown is wiped out by about $2k of value loss. Plan a longer hold.
- Middlesex County population projected at -21% by 2050 — secular population decline; favor cash flow + early exit over multi-decade hold.
- At projected returns (-1.7% appreciation + 3.0% rent growth), your $28k cash investment doubles in ~5 years — after that, you're playing with house money.
Negotiation context
- Only 1 days on market — expect competitive offers; lowballing is unlikely to land.
- 3 sale attempts with the ask held roughly flat each time — persistent listings suggest the price (not the market) is what's stuck; bring a comps-based counter.
- Current owner paid $80k; 25% above their basis — modest negotiation headroom, anchor on the comps not their cost.
Risks & watch-outs
- Watch-outs: built in 1924 — expect roof / HVAC / electrical / plumbing capex.
- Climate carrying-cost: severe wind risk, 80% chance of damaging wind over 30y; extreme-heat days projected 7→17/yr by 2055 (HVAC capex compounding) — expect insurance premiums to compound above CPI over the hold.
Questions for the listing agent
- Built in 1924 — when were the roof, HVAC, electrical panel, plumbing, and water heater last replaced?
- Is there a deadline driving the sale (1031 exchange, divorce, estate, relocation)? That informs how much negotiation room exists.
- What's the average days-on-market for RENTAL listings here right now (not sales)? A rising rental-DOM trend means longer vacancies and softer asking-rent achievability than the comps imply.
- What's the recent tenant-quality profile in this submarket — average credit score on applications, eviction rate, late-payment / NSF rate, and stable-employment percentage? A property-management company in the area should have these aggregated.
- How much new for-sale + rental construction is in the pipeline within 1–3 miles? Heavy new supply typically softens prices + rents 12–24 months out; constrained supply supports both.
Investment metrics
- 1% rule
- 1.47% ✓
- Cap rate
- 12.09%
- Cash-on-cash
- 20.71%
- DSCR
- 1.92
- GRM
- 5.7
CMA / ARV
- ARV (median comp)
- $446,183
- List price
- $99,950
- Delta
- -76.27%
- Verdict
- UNDERPRICED
- Comps
- 18 within 1.0 mi
Show comp detail 2 sales within ~0.75 mi
| Address | Dist | Beds/Ba | Sqft | Sold | Price | $/sf | Match |
|---|---|---|---|---|---|---|---|
| 283 Steamboat Ln | 0.66mi | 3/3.0 | 2,364 (-5%) | 5mo | $570,000 | $241 | 54 |
| 322 Fairfield Rd | 0.74mi | 2/2.0 (-1) | 2,688 (+8%) | 3mo | $500,000 | $186 | 44 |
Match score weights: distance 35% · size 25% · config 20% · recency 20%. Top-matched comps best support the ARV.
Projected returns pro-forma
-1.68% appreciation · 3.0% rent growth · sell at horizon
- IRR
- 16.6%
- Equity multiple
- 1.72×
- Total profit
- $20,212
- Equity at exit
- $20,897
- IRR
- 23.2%
- Equity multiple
- 3.23×
- Total profit
- $62,371
- Equity at exit
- $19,296
Cash invested: $27,986 (down + closing). Projections, not guarantees.
Landlord ↔ Tenant lean methodology
- Overall (STATE)
- 55 Moderately Landlord-Leaning
- State Virginia
- 55 Moderately Landlord-Leaning · D+2
- County
- — inherits STATE
- City
- — inherits STATE
ZIP-level market 23169
- Home prices YoY
- -0.5%
- Active inventory
- 15
- Price-to-rent
- 5.7×
Monthly cashflow live
- Estimated rent
- $1,466 medium interval (Pro) →
- Mortgage (P&I)
- −$524
- Tax from tax record
- −$110 /mo · $1,316/yr
- Insurance
- −$42
- HOA
- −$0
- Vacancy / Maint / Mgmt
- −$308
- Net cashflow
- $483
Break-even live
UW: 25.0% down · 7.5% · 30yr · 1.5% tax · 5.0% vac · 8.0% maint · 8.0% mgmt
Financing live
Cash to close
- Down payment
- $24,988
- Closing costs
- $2,998
- Reserves months
- —
- Total cash needed
- —
Loan-product check · same deal, 3 products live
Conventional
25% down · 7.5% · 30yr
- Down + closing
- —
- Monthly P&I
- —
- Monthly cashflow
- —
- DSCR
- —
- Eligible?
- —
Personal DTI + credit; lowest rate.
DSCR
20% down · 8.5% · 30yr
- Down + closing
- —
- Monthly P&I
- —
- Monthly cashflow
- —
- DSCR
- —
- Eligible?
- —
No personal income docs; deal must DSCR.
Hard money
10% down · 12.0% · 12mo
- Down + closing
- —
- Monthly P&I
- —
- Monthly cashflow
- —
- DSCR
- —
- Eligible?
- —
Short-term bridge; refi at stabilization.
Listing history 21 events
-
2026-06-18pricedays on market $99,950 Active 1 DOM
-
2026-06-17days on market $105,900 Active 62 DOM
-
2026-06-16days on market $105,900 Active 61 DOM
-
2026-06-15days on market $105,900 Active 60 DOM
-
2026-06-15days on market $105,900 Active 59 DOM
-
2026-06-13days on market $105,900 Active 58 DOM
-
2026-06-12days on market $105,900 Active 57 DOM
-
2026-06-09days on market $105,900 Active 54 DOM
-
2026-06-08days on market $105,900 Active 53 DOM
-
2026-06-08days on market $105,900 Active 52 DOM
-
2026-06-07days on market $105,900 Active 51 DOM
-
2026-06-03days on market $105,900 Active 48 DOM
-
2026-06-02days on market $105,900 Active 47 DOM
-
2026-06-01days on market $105,900 Active 46 DOM
-
2026-05-31days on market $105,900 Active 45 DOM
-
2026-05-14price $109,900 869-char remark
-
2026-04-16$114,900 Active 869-char remark
-
2026-04-15historical
-
2026-03-06price $119,900
-
2026-02-12$124,900 Active
-
2026-01-23soldstatus $80,000
ⓘ Source: listings_history table (triggers on properties + properties_extension) + one-shot
backfill from property_details.listing_events for pre-trigger history.
Tax reassessment forecast VA · Resets to sale price
- Current annual tax
- $1,316 · $110/mo
- Projected year-2 tax
- $1,316 · $110/mo
- Expected delta
- $0/yr ($0/mo · 0.0%)
ⓘ Screening estimate from a state-policy table — verify with the county assessor before closing.
Climate risk First Street
- Flood 1/10 Low FEMA zone X (unshaded) · 0% chance over 30 yrs
- Wildfire 3/10 Moderate
- Heat 9/10 Extreme 7 d/yr ≥105°F today · 17 d/yr by 30 yrs out
- Wind 8/10 Severe 80% chance of damaging wind over 30 yrs
- Air quality 1/10 Low 0 unhealthy d/yr today · 0 by 30 yrs out
Nearby sold comps map
Loading sold comps map…
Walkable amenities ~0.75 mi
Loading nearby amenities…
Taxation est. · year 1
- Rental income
- $17,596
- − Mortgage interest
- −$5,599
- − Property taxes
- −$1,316
- − Insurance
- −$500
- − Repairs & maintenance
- −$1,408
- − Management
- −$1,408
- − Depreciation
- −$2,908
- Taxable income
- $4,459
- Est. tax owed @ 24.0%
- −$1,070
- After-tax cash flow
- $4,726/yr
For passive investors: Depreciation is non-cash, so a rental often shows a tax loss while cash-flowing — sheltering income. Rental losses are passive: they offset passive income freely, and up to $25,000/yr can offset ordinary (W-2) income if you actively participate and your MAGI is under $100k (phasing out to $0 by $150k); unused losses carry forward. On sale, claimed depreciation is recaptured at up to 25%, and gains may owe capital-gains tax (a 1031 exchange can defer both). Figures are a year-1 estimate at your 24.0% rate — not tax advice; consult a CPA.
Schools (NCES district)
- District
- Middlesex County Public School District
- NCES district ID
- 5102490
- Math proficiency
- 45% ▼ -35.00%
- Reading proficiency
- 59% ▼ -11.00%
- Median HH income
- $51,986
- Composite
- 44.58/100
- National rank
- #2783
- State rank
- #90 of 131 in VA
Livability — Weems
No livability data for this city. (Only ~50 U.S. cities are tracked.)
Census & demographics
- Population (ZIP)
- 975
Population outlook (Middlesex County) Hauer SSP2
- Today (2025)
- 9,829 people
- By 2030
- 9,340 · -5.0%
- By 2040
- 8,411 · -14.4%
- By 2050
- 7,795 · -20.7%
- By 2075
- 7,471 · -24.0%
- By 2100
- 7,049 · -28.3%
Race, ethnicity, and origin ACS 2023
- Neighborhood character
- Predominantly White (83%)
- Race & ethnicity
- White 83% Black 8% Asian 4% Hispanic / Latino 3% Two or more races 2%
- Common ancestry
- Serbian 4% Romanian 4% German 2%
- Foreign-born
- 9% · China
- Languages at home
- 86% English-only · Spanish 4% Russian/Polish/Slavic 4% Chinese 4%
Political lean MEDSL · Middlesex
- 2024 margin
- Strong R (+27.4) · D 35.9% · R 63.3%
- 2008→2024 swing
- -8.2pp toward R · 2008: -19.2pp · 2024: -27.4pp
- All cycles
- 2024: R+27.4 2020: R+25.1 2016: R+26.0 2012: R+20.6 2008: R+19.2
Not yet ingested
- Civics
- —
Market trends
- HPI YoY
- ▼ -1.68%
- Current HPI
- 324.5634
- Rent YoY
- —
- Metro
- —
- State GDP YoY
- ▲ 2.40%
- F500 in state
- 50
Industry mix (Fortune 500 HQ in VA)
| Industry | F500 HQs | Revenue |
|---|---|---|
| Aerospace / Defense | 4 | $236B |
|
||
| Technology / Defense | 3 | $32B |
|
||
| Financial Services | 2 | $176B |
|
||
| Utilities | 2 | $27B |
|
||
| Insurance | 2 | $25B |
|
||
| Technology | 2 | $15B |
|
||
Price history
+24.9% since first listed9 events — show timeline
- 2026-06-18 Listed $99,950 CVRMLS
- 2026-06-17 Listing Removed — CVRMLS
- 2026-05-29 Price Changed $105,900 CVRMLS
- 2026-05-14 Price Changed $109,900 CVRMLS
- 2026-04-16 Listed $114,900 CVRMLS
- 2026-04-15 Listing Removed — CVRMLS
- 2026-03-06 Price Changed $119,900 CVRMLS
- 2026-02-12 Listed $124,900 CVRMLS
- 2026-01-23 Sold (Public Records) $80,000 Public Records
Property tax history
+2.9%/yrLatest (2025): $1,316 · +0.0% YoY. Source: county tax records.
Cash-flow waterfall
monthlySold comps — $/sqft
last 12 mo · ≤1 miLoading sold comps…