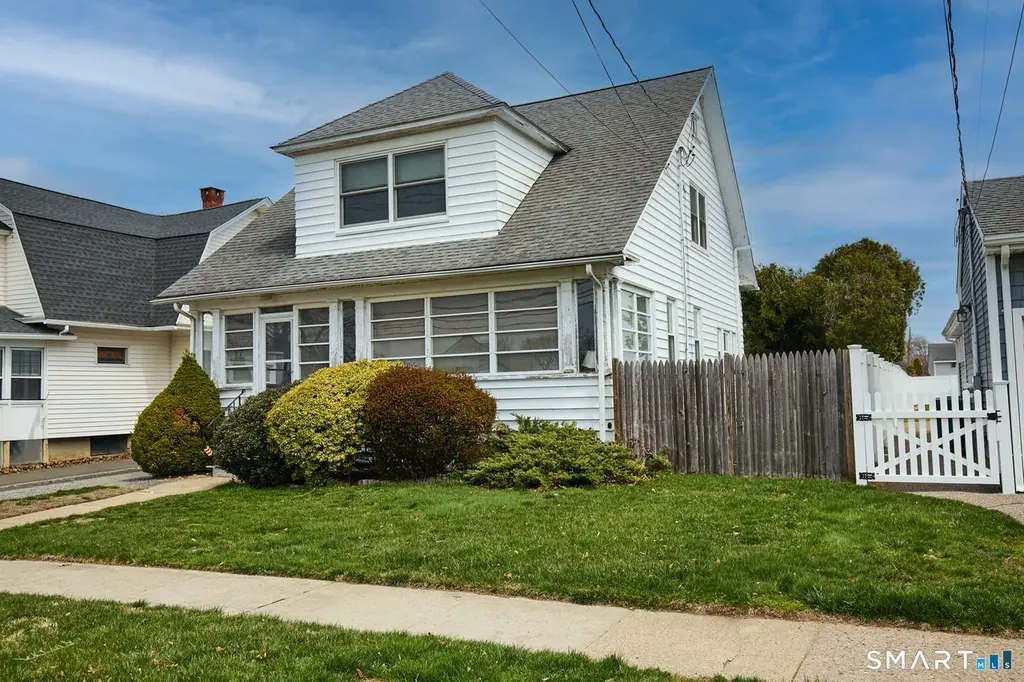
184 Pauline St · Lordship, CT
Flood risk 1/10 · Minimal
- FEMA flood zone
- X (unshaded)
- Chance of flooding over 30 yrs
- 0.0%
- Est. flood insurance / yr
- $473 – $860
Fire risk 1/10 · Minimal
- Est. fire insurance / yr
- $829 – $1,539
Heat risk 6/10 · Moderate
- Hot days now (above 96°F)
- 7 days/yr
- Hot days in 30 yrs
- 15 days/yr
Wind risk 6/10 · Moderate
- Chance of severe wind over 30 yrs
- 65.0%
Air-quality risk 4/10 · Minor
- Unhealthy air days now
- 5 days/yr
- Unhealthy air days in 30 yrs
- 7 days/yr
Risk factors via First Street. Map © Google.
Why this score? — see what drove the F grade
The composite is a weighted blend of 9 inputs, each scored 0–100. Each bar is that input's sub-score; the figure is the points it added to the 100-point composite (weight × sub-score).
- ARV discount +12.8/15.0
- Cash flow +3.7/30.0
- Schools +2.8/10.0
- Rent growth +2.5/5.0
- Livability +2.5/5.0
- Condition / age +2.5/5.0
- 1% rule +0.0/10.0
- DSCR +0.0/10.0
- Appreciation +0.0/10.0
$549,500
🖨 Deal sheet (PDF) 📄 Offer letter ✓ Due diligence
Listing remarks
WELCOME HOME TO YOUR LORDSHIP RETREAT ALL STEPS TO BEACHES, RESTAURANTS AND DINING, GOLF COURSE AND PARKS/REC. YOUR CUSTOM BUILT HOME FEATURES SPACIOUS ROOMS THROUGHOUT INCLUDING LIVING ROOM WITH POCKET DOORS, BANQUET SIZE DINING ROOM WITH BUILT-INS, REMODELED EAT IN KITCHEN OFFERING CUSTOM CABINETRY, STAINLESS STEEL APPLIANCES, MAIN LEVEL LAUNDRY, 1/2 BATH AND FULL SIZE PANTRY. YOUR UPPER LEVEL OFFERS 3 LARGE BEDROOMS EACH WITH A WALK IN CLOSET, HUGE LINEN CLOSET, UPDATED FULL BATH AND WALK UP TO 3RD LEVEL STORAGE. NEWER HEATING, HOT WATER, CENTRAL AIR, ELECTRIC MAIN PANEL (200 AMP), ROOF, OVERSIZED 2 CAR GARAGE AND DEEP, PRIVATE YARD WITH IN-GROUND POOL AWAITS YOU IN YOUR NEW HOME. SALE I
Key facts
- 9,147 sq ft lot
- 2 garage spots
- Pool
Property features AI
Exterior
- Parking: Detached 2-car garage; Paved driveway with off-street parking for a total of 4 spaces
- Security: Safety fence around the in-ground pool
- Utilities: Public water connected; Public sewer connected; Natural gas for heat and hot water
- Home design: Single-family home; Private paved asphalt driveway
- Construction: Frame construction with aluminum siding; Asphalt shingle roof; Block and concrete foundation; White exterior color
- Exterior features: Enclosed porch plus additional porch and patio; Sidewalk and garden area with exterior lighting; Gutters; Chain-link fenced, level lot; Walk to water with beach rights in a water community
Interior
- Kitchen: Oven/Range; Microwave; Refrigerator; Dishwasher
- Bedrooms: 3 bedrooms
- Bathrooms: 1 full bathroom; 1 half bathroom
- Heating & cooling: Central air conditioning; Hot air heating fueled by natural gas; Programmable thermostat; Thermopane windows; storm doors and storm windows
- Interior features: Cable available; Full, unfinished basement with storage, interior access and walk-out; concrete floor; Attic with floored storage space and walk-up access; Foyer
- Laundry & utility: Washer and dryer in main-level laundry room; 40-gallon natural gas hot water tank
Neighborhood map
What this means for you Summary
Snapshot
- This is a 2-bed/1.5-bath single-family listed at $550k.
Deal economics
- At list price, monthly cash flow is $-2k ($-19k/yr) — negative.
- To cash-flow at today's rent, offer at most $265k (51.8% below list).
- To meet the 1% rule (rent ≥ 1% of price), the offer needs to be $273k (50.3% below list).
- Recommended offer: $265k (51.8% below list) — sets the bar for cash-flow.
Location & tenants
- Location reads: area grade F — affects rentability + tenant quality, not the cash-flow math above.
- Stratford School District (urban): math 22% / reading 38% proficiency, ranked #122 of 153 in CT (top 80%) — families likely to look elsewhere, expect single-tenant / working-renter base with shorter leases.
- Zoned schools: Lordship School (math 22% / reading 32%, grade F, #401 of 553 statewide, top 74%, 177 students, 48% FRL); David Wooster Middle School (math 18% / reading 40%, grade F, #143 of 175 statewide, top 83%, 539 students, 51% FRL); Stratford High School (math 19% / reading 46%, grade F, #125 of 194 statewide, top 66%, 1,127 students, 45% FRL) — zoned schools average 48% FRL vs 31% district-wide (17 pts higher); higher-poverty schools than district average — tighter screening recommended.
- Market conditions: 76 active listings in the ZIP; 2 comparable units currently listed for rent nearby; solid renter incomes; 852 units permitted in Greater Bridgeport Planning Region in 2024 (698 in 5+ unit buildings).
- This rent runs 40% of the median local income ($82k/yr) — at the standard rent-burdened threshold; future hikes will face affordability resistance.
Forward outlook
- Local home prices are declining (-3.0%/yr); year-one equity from $4k of loan paydown is wiped out by about $16k of value loss. Plan a longer hold.
Negotiation context
- It's been on market 40 days — a 3% lower offer ($533k) is reasonable based on typical stale-listing flexibility.
Risks & watch-outs
- Watch-outs: built in 1927 — expect roof / HVAC / electrical / plumbing capex.
- Climate carrying-cost: major wind risk, 65% chance of damaging wind over 30y; extreme-heat days projected 7→15/yr by 2055 (HVAC capex compounding) — expect insurance premiums to compound above CPI over the hold.
Questions for the listing agent
- What do current leases actually rent for vs. the listed asking? Can we see a recent rent roll and the last 12 months of T-12 income?
- It's been on market 40 days. Have you received any prior offers? Is the seller open to a 52% concession, seller financing, or rate buy-down credit?
- Built in 1927 — when were the roof, HVAC, electrical panel, plumbing, and water heater last replaced?
- Is there a deadline driving the sale (1031 exchange, divorce, estate, relocation)? That informs how much negotiation room exists.
- The area grade is low — what's the realistic commute time and amenity access for the typical tenant pool here? Any planned neighborhood developments (good or bad) we should know about?
- What's the average days-on-market for RENTAL listings here right now (not sales)? A rising rental-DOM trend means longer vacancies and softer asking-rent achievability than the comps imply.
- What's the recent tenant-quality profile in this submarket — average credit score on applications, eviction rate, late-payment / NSF rate, and stable-employment percentage? A property-management company in the area should have these aggregated.
- How much new for-sale + rental construction is in the pipeline within 1–3 miles? Heavy new supply typically softens prices + rents 12–24 months out; constrained supply supports both.
Investment metrics
- 1% rule
- 0.50% ✗
- Cap rate
- 2.77%
- Cash-on-cash
- -12.57%
- DSCR
- 0.44
- GRM
- 16.8
CMA / ARV
- ARV (median comp)
- $623,180
- List price
- $549,500
- Delta
- -11.82%
- Verdict
- UNDERPRICED
- Comps
- 20 within 1.0 mi
Show comp detail 12 sales within ~0.75 mi
| Address | Dist | Beds/Ba | Sqft | Sold | Price | $/sf | Match |
|---|---|---|---|---|---|---|---|
| 184 Pauline St | 0.00mi | 3/1.5 (+1) | 1,466 (0%) | 0mo | $582,000 | $397 | 95 |
| 275 Washington Pkwy | 0.17mi | 3/1.5 (+1) | 1,532 (+4%) | 11mo | $600,000 | $392 | 70 |
| 240 Prospect Dr | 0.26mi | 2/1.5 | 1,428 (-3%) | 20mo | $600,000 | $420 | 67 |
| 159 Jefferson St | 0.16mi | 3/2.0 (+1) | 1,342 (-8%) | 10mo | $560,000 | $417 | 63 |
| 545 Washington Pkwy | 0.18mi | 2/1.5 | 1,288 (-12%) | 17mo | $442,000 | $343 | 58 |
| 131 5th Ave | 0.47mi | 3/2.0 (+1) | 1,483 (+1%) | 22mo | $550,000 | $371 | 51 |
| 187 Crown St | 0.03mi | 3/2.0 (+1) | 1,684 (+15%) | 22mo | $580,000 | $344 | 48 |
| 60 Birch St | 0.33mi | 2/1.0 | 1,638 (+12%) | 18mo | $465,000 | $284 | 48 |
| 265 Lighthouse Ave | 0.70mi | 3/1.0 (+1) | 1,373 (-6%) | 10mo | $555,000 | $404 | 42 |
| 124 Lighthouse Ave | 0.65mi | 3/2.0 (+1) | 1,373 (-6%) | 13mo | $550,000 | $401 | 42 |
| 1 3rd Ave | 0.46mi | 3/2.0 (+1) | 1,644 (+12%) | 24mo | $619,000 | $377 | 31 |
| 62 Baxter St | 0.66mi | 3/1.0 (+1) | 1,661 (+13%) | 20mo | $520,000 | $313 | 23 |
Match score weights: distance 35% · size 25% · config 20% · recency 20%. Top-matched comps best support the ARV.
Projected returns pro-forma
-3.0% appreciation · 3.0% rent growth · sell at horizon
- IRR
- -39.6%
- Equity multiple
- -0.25×
- Total profit
- $-191,690
- Equity at exit
- $81,932
- IRR
- -62.5%
- Equity multiple
- -0.94×
- Total profit
- $-299,028
- Equity at exit
- $47,511
Cash invested: $153,860 (down + closing). Projections, not guarantees.
Landlord ↔ Tenant lean methodology
- Overall (STATE)
- 27 Tenant-Leaning
- State Connecticut
- 27 Tenant-Leaning · D+7
- County
- — inherits STATE
- City
- — inherits STATE
ZIP-level market 06615
- Active inventory
- 76
- Price-to-rent
- 16.8×
Monthly cashflow live
- Estimated rent
- $2,731 medium interval (Pro) →
- Mortgage (P&I)
- −$2,882
- Tax from tax record
- −$659 /mo · $7,910/yr
- Insurance
- −$229
- HOA
- −$0
- Vacancy / Maint / Mgmt
- −$574
- Net cashflow
- $-1,612
Break-even live
Sensitivity live
| Price | -10% $-1,301 | -5% $-1,457 | +0% $-1,612 | +5% $-1,768 | +10% $-1,923 |
|---|---|---|---|---|---|
| Rent | -10% $-1,828 | -5% $-1,720 | +0% $-1,612 | +5% $-1,504 | +10% $-1,396 |
| Rate | -1.0pp $-1,335 | -0.5pp $-1,472 | base $-1,612 | +0.5pp $-1,754 | +1.0pp $-1,899 |
UW: 25.0% down · 7.5% · 30yr · 1.5% tax · 5.0% vac · 8.0% maint · 8.0% mgmt
Financing live
Cash to close
- Down payment
- $137,375
- Closing costs
- $16,485
- Reserves months
- —
- Total cash needed
- —
Loan-product check · same deal, 3 products live
Conventional
25% down · 7.5% · 30yr
- Down + closing
- —
- Monthly P&I
- —
- Monthly cashflow
- —
- DSCR
- —
- Eligible?
- —
Personal DTI + credit; lowest rate.
DSCR
20% down · 8.5% · 30yr
- Down + closing
- —
- Monthly P&I
- —
- Monthly cashflow
- —
- DSCR
- —
- Eligible?
- —
No personal income docs; deal must DSCR.
Hard money
10% down · 12.0% · 12mo
- Down + closing
- —
- Monthly P&I
- —
- Monthly cashflow
- —
- DSCR
- —
- Eligible?
- —
Short-term bridge; refi at stabilization.
Rent comps 2 comps
| Address | Beds | Baths | Sqft | Rent | $/sqft | DOM | Units | Dist |
|---|---|---|---|---|---|---|---|---|
| 15 Shoreline Dr #15 Stratford, CT | 2.0 | 1.0 | 1344 | $8,000 | $5.95 | 25d | 1 | 0.33mi |
| 164 Meadowview Ave Stratford, CT | 3.0 | 1.5 | 1188 | $2,800 | $2.36 | 45d | 1 | 1.25mi |
Listing history 8 events
-
2026-06-08statusdays on market $549,500 Under Contract 40 DOM
-
2026-06-07days on market $549,500 Under Contract - Continue to Show 39 DOM
-
2026-06-03days on market $549,500 Under Contract - Continue to Show 35 DOM
-
2026-06-03days on market $549,500 Under Contract - Continue to Show 34 DOM
-
2026-06-01days on market $549,500 Under Contract - Continue to Show 33 DOM
-
2026-05-31days on market $549,500 Under Contract - Continue to Show 32 DOM
-
2026-05-05historical Under Contract - Continue to Show 729-char remark
-
2026-04-29$549,500 Active 729-char remark
ⓘ Source: listings_history table (triggers on properties + properties_extension) + one-shot
backfill from property_details.listing_events for pre-trigger history.
Tax reassessment forecast CT · Partial reset (capped growth)
- Current annual tax
- $7,910 · $659/mo
- Projected year-2 tax
- $9,835 · $820/mo
- Expected delta
- +$1,925/yr (+$160/mo · 24.3%)
ⓘ Screening estimate from a state-policy table — verify with the county assessor before closing.
Climate risk First Street
- Flood 1/10 Low FEMA zone X (unshaded) · 0% chance over 30 yrs
- Wildfire 1/10 Low
- Heat 6/10 Major 7 d/yr ≥96°F today · 15 d/yr by 30 yrs out
- Wind 6/10 Major 65% chance of damaging wind over 30 yrs
- Air quality 4/10 Moderate 5 unhealthy d/yr today · 7 by 30 yrs out
Nearby sold comps map
Loading sold comps map…
Walkable amenities ~0.75 mi
Loading nearby amenities…
Taxation est. · year 1
- Rental income
- $32,776
- − Mortgage interest
- −$30,781
- − Property taxes
- −$7,910
- − Insurance
- −$2,748
- − Repairs & maintenance
- −$2,622
- − Management
- −$2,622
- − Depreciation
- −$15,985
- Taxable loss
- −$29,892
- Est. tax savings @ 24.0%
- +$7,174
- After-tax cash flow
- $-12,170/yr
For passive investors: Depreciation is non-cash, so a rental often shows a tax loss while cash-flowing — sheltering income. Rental losses are passive: they offset passive income freely, and up to $25,000/yr can offset ordinary (W-2) income if you actively participate and your MAGI is under $100k (phasing out to $0 by $150k); unused losses carry forward. On sale, claimed depreciation is recaptured at up to 25%, and gains may owe capital-gains tax (a 1031 exchange can defer both). Figures are a year-1 estimate at your 24.0% rate — not tax advice; consult a CPA.
Schools (NCES district)
- District
- Stratford School District
- NCES district ID
- 0904440
- Math proficiency
- 22% ▼ -12.00%
- Reading proficiency
- 38% ▼ -10.00%
- Median HH income
- $67,912
- Composite
- 27.85/100
- National rank
- #6877
- State rank
- #122 of 153 in CT
Livability — Lordship
No livability data for this city. (Only ~50 U.S. cities are tracked.)
Census & demographics
- Census place
- Lordship, CT
- County
- Fairfield County · 765,532 people
- Metro
- Bridgeport-Stamford-Norwalk, CT
- Population (ZIP)
- 17,136
- Household income
- $81,534
- Rent vs Own
- Severe rent burden
- 507.0
Population outlook (Greater Bridgeport County) Hauer SSP2
- By 2040
- 365,581
Race, ethnicity, and origin ACS 2023
- Neighborhood character
- Diverse neighborhood (Simpson 0.63)
- Race & ethnicity
- White 53% Hispanic / Latino 24% Black 18% Two or more races 6% Asian 3%
- Hispanic origin (detail)
- Mexican 2% Puerto Rican 13%
- Common ancestry
- Romanian 5% Hispanic 3% Lithuanian 2%
- Foreign-born
- 18% · Canada, South Korea, Jamaica
- Languages at home
- 74% English-only · Spanish 17% French/Haitian/Cajun 2% Other Indo-European 2%
Political lean MEDSL · Greater Bridgeport
- 2024 margin
- Strong D (+23.3) · D 60.9% · R 37.6% · Other 1.5%
- All cycles
- 2024: D+23.3
Not yet ingested
- Civics
- —
Market trends
- HPI YoY
- ▼ -359.68%
- Current HPI
- 230.0031
- Rent YoY
- —
- Metro
- Bridgeport-Stamford-Norwalk, CT
- State GDP YoY
- ▲ 1.06%
- F500 in state
- 38
Industry mix (Fortune 500 HQ in CT)
| Industry | F500 HQs | Revenue |
|---|---|---|
| Industrial Machinery | 4 | $38B |
|
||
| Insurance | 3 | $71B |
|
||
| Financial Services | 2 | $25B |
|
||
| Transportation / Logistics | 2 | $18B |
|
||
| Healthcare | 1 | $247B |
|
||
| Telecommunications | 1 | $55B |
|
||
Price history
+5.9% since first listed4 events — show timeline
- 2026-06-12 Sold (MLS) $582,000 Smart MLS
- 2026-06-08 Pending — Smart MLS
- 2026-05-05 Contingent — Smart MLS
- 2026-04-29 Listed $549,500 Smart MLS
Property tax history
+1.4%/yrLatest (2023): $7,910 · +1.9% YoY. Source: county tax records.
Cash-flow waterfall
monthlySold comps — $/sqft
last 12 mo · ≤1 miLoading sold comps…