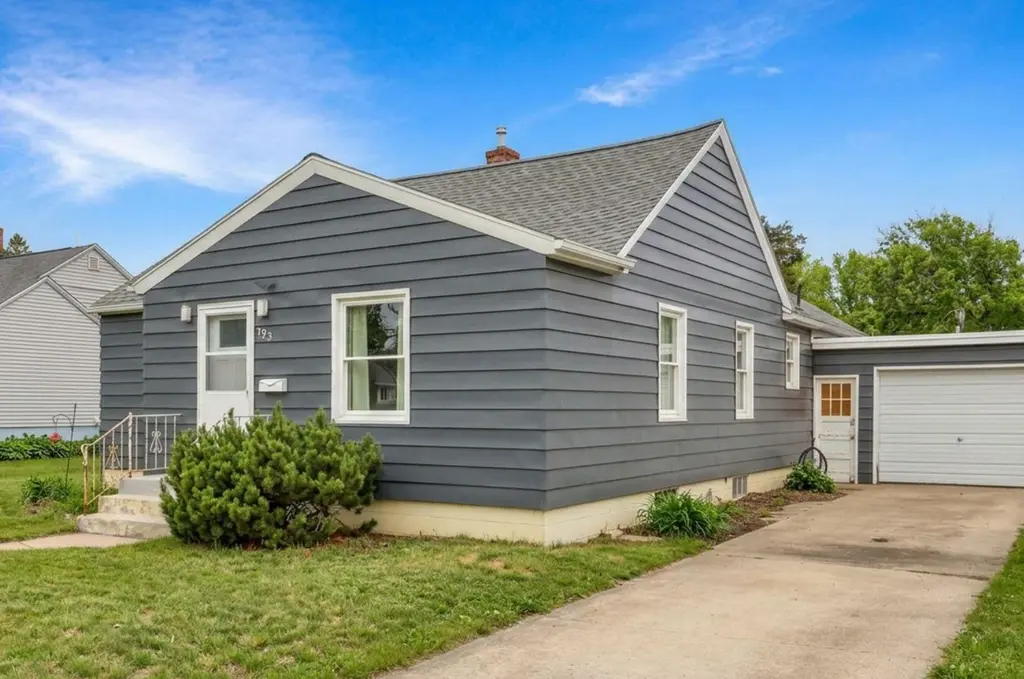
723 11th St S · Benson, MN
Flood risk 1/10 · Minimal
- FEMA flood zone
- X (unshaded)
- Chance of flooding over 30 yrs
- 0.0%
- Est. flood insurance / yr
- $473 – $860
Fire risk 3/10 · Minor
- Est. fire insurance / yr
- $888 – $1,650
Heat risk 2/10 · Minimal
- Hot days now (above 99°F)
- 7 days/yr
- Hot days in 30 yrs
- 13 days/yr
Wind risk 2/10 · Minimal
- Chance of severe wind over 30 yrs
- —
Air-quality risk 2/10 · Minimal
- Unhealthy air days now
- 2 days/yr
- Unhealthy air days in 30 yrs
- 2 days/yr
Risk factors via First Street. Map © Google.
Why this score? — see what drove the C+ grade
The composite is a weighted blend of 9 inputs, each scored 0–100. Each bar is that input's sub-score; the figure is the points it added to the 100-point composite (weight × sub-score).
- Cash flow +26.0/30.0
- DSCR +8.7/10.0
- ARV discount +7.5/15.0
- 1% rule +6.6/10.0
- Livability +3.8/5.0
- Schools +3.4/10.0
- Rent growth +2.5/5.0
- Condition / age +2.5/5.0
- Appreciation +0.0/10.0
$99,900
🖨 Deal sheet (PDF) 📄 Offer letter ✓ Due diligence
Listing remarks MLS
Cozy 2 BR/1 BA home on Benson's south side! Lots of space with a family room overlooking the backyard. Galley kitchen and separate dining area. Large living room in the front of the home and another living space at the rear of the house overlooking the backyard. Hardwood floors in both bedrooms and hallway. Dining room has carpet covering the hardwood floor. Main floor laundry. Roof was shingled in 2022. Windows are approximately 5 years old. Main floor laundry. Large backyard and single stall detached garage
Key facts
- New furnace
- Recent updates
- New exterior paint
Tags
Neighborhood map
What this means for you Summary
Snapshot
- This is a 2-bed/1.0-bath single-family listed at $100k.
Deal economics
- At list price, monthly cash flow is $248 ($3k/yr) — positive.
- The deal already cash-flows at list — no discount required.
- Meets the 1% rule at list price ($1k rent vs $100k).
- Cap rate 9.3% vs local median 5.8% in Benson — top-decile yield for the area; either an underpriced asset or a hidden risk that comps aren't pricing in. Stress-test before assuming the spread holds.
Location & tenants
- Location reads 75/100 on livability (#189 in MN, #4,068 nationally) — a middle-class / working-renter tenant base. Strengths: crime A+, cost of living A+, housing A+; Watch: employment C-, amenities F, commute F.
- Benson Public School District (town): math 37% / reading 41% proficiency, ranked #228 of 301 in MN (top 76%) — families likely to look elsewhere, expect single-tenant / working-renter base with shorter leases.
- Market conditions: 32 active listings in the ZIP; 3 comparable units currently listed for rent nearby; rentals lingering (median 44d on market — plan ~5-8 weeks vacancy on turnover, expect pricing pressure); 100% of comp listings sitting > 30 days — soft ceiling on asking rent; 15 units permitted in Swift County in 2024 (0 in 5+ unit buildings).
Forward outlook
- Local home prices are declining (-3.0%/yr); year-one equity from $691 of loan paydown is wiped out by about $3k of value loss. Plan a longer hold.
- Swift County population projected at -20% by 2050 — secular population decline; favor cash flow + early exit over multi-decade hold.
Negotiation context
- Only 7 days on market — expect competitive offers; lowballing is unlikely to land.
- 5 sale attempts since 8y ago; this cycle's ask has dropped $10k (9%) from the opening price — seller is motivated, your offer sets the floor, not the list.
Risks & watch-outs
- Watch-outs: built in 1940 — expect roof / HVAC / electrical / plumbing capex.
Questions for the listing agent
- Built in 1940 — when were the roof, HVAC, electrical panel, plumbing, and water heater last replaced?
- Is there a deadline driving the sale (1031 exchange, divorce, estate, relocation)? That informs how much negotiation room exists.
- What's the average days-on-market for RENTAL listings here right now (not sales)? A rising rental-DOM trend means longer vacancies and softer asking-rent achievability than the comps imply.
- What's the recent tenant-quality profile in this submarket — average credit score on applications, eviction rate, late-payment / NSF rate, and stable-employment percentage? A property-management company in the area should have these aggregated.
- How much new for-sale + rental construction is in the pipeline within 1–3 miles? Heavy new supply typically softens prices + rents 12–24 months out; constrained supply supports both.
Investment metrics
- 1% rule
- 1.16% ✓
- Cap rate
- 9.28%
- Cash-on-cash
- 10.65%
- DSCR
- 1.47
- GRM
- 7.2
CMA / ARV
No comps found within radius.
Projected returns pro-forma
-3.0% appreciation · 3.0% rent growth · sell at horizon
- IRR
- -0.3%
- Equity multiple
- 0.99×
- Total profit
- $-370
- Equity at exit
- $14,895
- IRR
- 9.3%
- Equity multiple
- 1.72×
- Total profit
- $20,051
- Equity at exit
- $8,638
Cash invested: $27,972 (down + closing). Projections, not guarantees.
Landlord ↔ Tenant lean methodology
- Overall (STATE)
- 46 Balanced
- State Minnesota
- 46 Balanced · D+2
- County
- — inherits STATE
- City
- — inherits STATE
ZIP-level market 56215
- Home prices YoY
- -18.0%
- Active inventory
- 32
- Price-to-rent
- 7.2×
Monthly cashflow live
- Estimated rent
- $1,156 medium interval (Pro) →
- Mortgage (P&I)
- −$524
- Tax from tax record
- −$100 /mo · $1,196/yr
- Insurance
- −$42
- HOA
- −$0
- Vacancy / Maint / Mgmt
- −$243
- Net cashflow
- $248
Break-even live
Sensitivity live
| Price | -10% $305 | -5% $277 | +0% $248 | +5% $220 | +10% $192 |
|---|---|---|---|---|---|
| Rent | -10% $157 | -5% $203 | +0% $248 | +5% $294 | +10% $340 |
| Rate | -1.0pp $299 | -0.5pp $274 | base $248 | +0.5pp $222 | +1.0pp $196 |
UW: 25.0% down · 7.5% · 30yr · 1.5% tax · 5.0% vac · 8.0% maint · 8.0% mgmt
Financing live
Cash to close
- Down payment
- $24,975
- Closing costs
- $2,997
- Reserves months
- —
- Total cash needed
- —
Loan-product check · same deal, 3 products live
Conventional
25% down · 7.5% · 30yr
- Down + closing
- —
- Monthly P&I
- —
- Monthly cashflow
- —
- DSCR
- —
- Eligible?
- —
Personal DTI + credit; lowest rate.
DSCR
20% down · 8.5% · 30yr
- Down + closing
- —
- Monthly P&I
- —
- Monthly cashflow
- —
- DSCR
- —
- Eligible?
- —
No personal income docs; deal must DSCR.
Hard money
10% down · 12.0% · 12mo
- Down + closing
- —
- Monthly P&I
- —
- Monthly cashflow
- —
- DSCR
- —
- Eligible?
- —
Short-term bridge; refi at stabilization.
Rent comps 3 comps
| Address | Beds | Baths | Sqft | Rent | $/sqft | DOM | Units | Dist |
|---|---|---|---|---|---|---|---|---|
| 1017 13th St N Benson, MN | 2.0 | 1.5 | 964 | $1,140 | $1.18 | 44d | 1 | 1.03mi |
| 1009 13th St N Benson, MN | 2.0 | 1.5 | 964 | $1,090 | $1.13 | 44d | 1 | 1.03mi |
| 1027 13th St N Benson, MN | 3.0 | 1.5 | 964 | $1,240 | $1.29 | 44d | 1 | 1.05mi |
Listing history 24 events
-
2026-06-21statusdays on market $99,900 Pending 7 DOM
-
2026-06-18days on market $99,900 Active 6 DOM
-
2026-06-17days on market $99,900 Active 5 DOM
-
2026-06-16days on market $99,900 Active 4 DOM
-
2026-06-15days on market $99,900 Active 3 DOM
-
2026-06-12statusdays on market $99,900 Active 1 DOM
-
2026-04-27status Pending
-
2026-02-25price $99,900
-
2025-12-31status Active
-
2025-12-31historical
-
2025-12-29$109,900
-
2023-01-09soldstatus $89,900
-
2023-01-05soldstatus $89,900 Sold 516-char remark
Show marketing remark (516 chars)
Cozy 2 BR/1 BA home on Benson's south side! Lots of space with a family room overlooking the backyard. Galley kitchen and separate dining area. Large living room in the front of the home and another living space at the rear of the house overlooking the backyard. Hardwood floors in both bedrooms and hallway. Dining room has carpet covering the hardwood floor. Main floor laundry. Roof was shingled in 2022. Windows are approximately 5 years old. Main floor laundry. Large backyard and single stall detached garage
-
2022-12-03status Pending 516-char remark
Show marketing remark (516 chars)
Cozy 2 BR/1 BA home on Benson's south side! Lots of space with a family room overlooking the backyard. Galley kitchen and separate dining area. Large living room in the front of the home and another living space at the rear of the house overlooking the backyard. Hardwood floors in both bedrooms and hallway. Dining room has carpet covering the hardwood floor. Main floor laundry. Roof was shingled in 2022. Windows are approximately 5 years old. Main floor laundry. Large backyard and single stall detached garage
-
2022-11-21$89,900 Active 516-char remark
Show marketing remark (516 chars)
Cozy 2 BR/1 BA home on Benson's south side! Lots of space with a family room overlooking the backyard. Galley kitchen and separate dining area. Large living room in the front of the home and another living space at the rear of the house overlooking the backyard. Hardwood floors in both bedrooms and hallway. Dining room has carpet covering the hardwood floor. Main floor laundry. Roof was shingled in 2022. Windows are approximately 5 years old. Main floor laundry. Large backyard and single stall detached garage
-
2021-07-01soldstatus $83,500 Sold 244-char remark
Show marketing remark (244 chars)
Two BR/1 BA home has more space than you think! Large living/dining room, galley kitchen, family room overlooking back yard. Main floor laundry and bedrooms. Majority of main floor windows replaced in 2018, newer water heater. One stall garage.
-
2021-07-01soldstatus $83,500
Show marketing remark (244 chars)
Two BR/1 BA home has more space than you think! Large living/dining room, galley kitchen, family room overlooking back yard. Main floor laundry and bedrooms. Majority of main floor windows replaced in 2018, newer water heater. One stall garage.
-
2021-05-28status Pending 244-char remark
Show marketing remark (244 chars)
Two BR/1 BA home has more space than you think! Large living/dining room, galley kitchen, family room overlooking back yard. Main floor laundry and bedrooms. Majority of main floor windows replaced in 2018, newer water heater. One stall garage.
-
2021-05-17historical Contingent - Inspection 244-char remark
Show marketing remark (244 chars)
Two BR/1 BA home has more space than you think! Large living/dining room, galley kitchen, family room overlooking back yard. Main floor laundry and bedrooms. Majority of main floor windows replaced in 2018, newer water heater. One stall garage.
-
2021-05-14$81,500 Active 244-char remark
Show marketing remark (244 chars)
Two BR/1 BA home has more space than you think! Large living/dining room, galley kitchen, family room overlooking back yard. Main floor laundry and bedrooms. Majority of main floor windows replaced in 2018, newer water heater. One stall garage.
-
2019-09-16soldstatus $71,900 Sold
-
2019-09-16soldstatus $71,900
-
2019-07-22status Pending
-
2018-10-03$71,500 Active
ⓘ Source: listings_history table (triggers on properties + properties_extension) + one-shot
backfill from property_details.listing_events for pre-trigger history.
Tax reassessment forecast MN · Partial reset (capped growth)
- Current annual tax
- $1,196 · $100/mo
- Projected year-2 tax
- $1,196 · $100/mo
- Expected delta
- $0/yr ($0/mo · 0.0%)
ⓘ Screening estimate from a state-policy table — verify with the county assessor before closing.
Climate risk First Street
- Flood 1/10 Low FEMA zone X (unshaded) · 0% chance over 30 yrs
- Wildfire 3/10 Moderate
- Heat 2/10 Low 7 d/yr ≥99°F today · 13 d/yr by 30 yrs out
- Wind 2/10 Low
- Air quality 2/10 Low 2 unhealthy d/yr today · 2 by 30 yrs out
Nearby sold comps map
Loading sold comps map…
Walkable amenities ~0.75 mi
Loading nearby amenities…
Taxation est. · year 1
- Rental income
- $13,876
- − Mortgage interest
- −$5,596
- − Property taxes
- −$1,196
- − Insurance
- −$500
- − Repairs & maintenance
- −$1,110
- − Management
- −$1,110
- − Depreciation
- −$2,906
- Taxable income
- $1,458
- Est. tax owed @ 24.0%
- −$350
- After-tax cash flow
- $2,630/yr
For passive investors: Depreciation is non-cash, so a rental often shows a tax loss while cash-flowing — sheltering income. Rental losses are passive: they offset passive income freely, and up to $25,000/yr can offset ordinary (W-2) income if you actively participate and your MAGI is under $100k (phasing out to $0 by $150k); unused losses carry forward. On sale, claimed depreciation is recaptured at up to 25%, and gains may owe capital-gains tax (a 1031 exchange can defer both). Figures are a year-1 estimate at your 24.0% rate — not tax advice; consult a CPA.
Schools (NCES district)
- District
- Benson Public School District
- NCES district ID
- 2704470
- Math proficiency
- 37% ▼ -13.00%
- Reading proficiency
- 41% ▼ -9.00%
- Median HH income
- $49,024
- Composite
- 33.56/100
- National rank
- #5423
- State rank
- #228 of 301 in MN
Livability — Benson
- Score
- 75/100
- State rank
- #189
- US rank
- #4068
Category grades
Schools grade is shown separately in the Schools card above.
Census & demographics
- Census place
- Benson, MN
- Population (ZIP)
- 4,701
Population outlook (Swift County) Hauer SSP2
- Today (2025)
- 8,635 people
- By 2030
- 8,257 · -4.4%
- By 2040
- 7,528 · -12.8%
- By 2050
- 6,891 · -20.2%
- By 2075
- 5,879 · -31.9%
- By 2100
- 5,045 · -41.6%
Race, ethnicity, and origin ACS 2023
- Neighborhood character
- Predominantly White (88%)
- Race & ethnicity
- White 88% Hispanic / Latino 6% Two or more races 6% Black 1%
- Hispanic origin (detail)
- Mexican 3%
- Common ancestry
- Portuguese 28% Italian 3% Romanian 3%
- Foreign-born
- 1% · Canada
- Languages at home
- 97% English-only · Spanish 2%
Political lean MEDSL · Swift
- 2024 margin
- Solid R (+34.2) · D 32.1% · R 66.3% · Other 1.6%
- 2008→2024 swing
- -47.9pp toward R · 2008: 13.8pp · 2024: -34.2pp
- All cycles
- 2024: R+34.2 2020: R+29.5 2016: R+25.8 2012: D+9.9 2008: D+13.8
Not yet ingested
- Civics
- —
Market trends
- HPI YoY
- ▼ -47.08%
- Current HPI
- 214.9157
- Rent YoY
- —
- Metro
- —
- State GDP YoY
- ▲ 2.41%
- F500 in state
- 34
Industry mix (Fortune 500 HQ in MN)
| Industry | F500 HQs | Revenue |
|---|---|---|
| Healthcare | 2 | $407B |
|
||
| Retail | 2 | $150B |
|
||
| Consumer Goods | 2 | $32B |
|
||
| Industrial Machinery | 2 | $6B |
|
||
| Agriculture | 1 | $40B |
|
||
| Healthcare / Medical Devices | 1 | $32B |
|
||
Price history
+39.7% since first listed18 events — show timeline
- 2026-04-27 Pending — NORTHSTARMLS as Distributed by MLS Grid
- 2026-02-25 Price Changed $99,900 NORTHSTARMLS as Distributed by MLS Grid
- 2025-12-31 Relisted — NORTHSTARMLS as Distributed by MLS Grid
- 2025-12-31 Listing Removed — NORTHSTARMLS as Distributed by MLS Grid
- 2025-12-29 Listed $109,900 NORTHSTARMLS as Distributed by MLS Grid
- 2023-01-09 Sold (Public Records) $89,900 Public Records
- 2023-01-05 Sold (MLS) $89,900 NORTHSTARMLS as Distributed by MLS Grid
- 2022-12-03 Pending — NORTHSTARMLS as Distributed by MLS Grid
- 2022-11-21 Listed $89,900 NORTHSTARMLS as Distributed by MLS Grid
- 2021-07-01 Sold (Public Records) $83,500 Public Records
- 2021-07-01 Sold (MLS) $83,500 NORTHSTARMLS as Distributed by MLS Grid
- 2021-05-28 Pending — NORTHSTARMLS as Distributed by MLS Grid
- 2021-05-17 Contingent — NORTHSTARMLS as Distributed by MLS Grid
- 2021-05-14 Listed $81,500 NORTHSTARMLS as Distributed by MLS Grid
- 2019-09-16 Sold (Public Records) $71,900 Public Records
- 2019-09-16 Sold (MLS) $71,900 NORTHSTARMLS as Distributed by MLS Grid
- 2019-07-22 Pending — NORTHSTARMLS as Distributed by MLS Grid
- 2018-10-03 Listed $71,500 NORTHSTARMLS as Distributed by MLS Grid
Property tax history
+5.1%/yrLatest (2025): $1,196 · -2.9% YoY. Source: county tax records.
Cash-flow waterfall
monthlySold comps — $/sqft
last 12 mo · ≤1 miLoading sold comps…