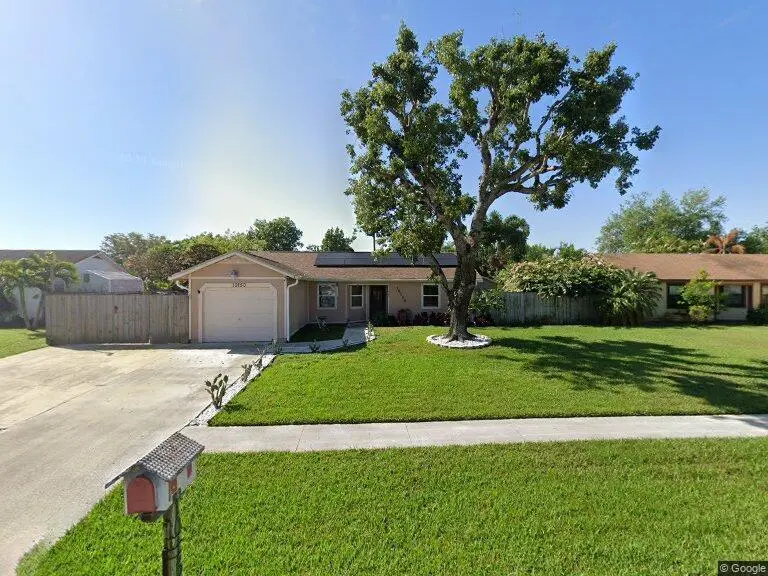
10150 Yeoman Ln · Royal Palm Beach, FL
Flood risk 1/10 · Minimal
- FEMA flood zone
- X (unshaded)
- Chance of flooding over 30 yrs
- 0.0%
- Est. flood insurance / yr
- $507 – $1,088
Fire risk 3/10 · Minor
- Est. fire insurance / yr
- $947 – $1,759
Heat risk 10/10 · Severe
- Hot days now (above 107°F)
- 7 days/yr
- Hot days in 30 yrs
- 27 days/yr
Wind risk 10/10 · Severe
- Chance of severe wind over 30 yrs
- 99.0%
Air-quality risk 2/10 · Minimal
- Unhealthy air days now
- 0 days/yr
- Unhealthy air days in 30 yrs
- 1 days/yr
Risk factors via First Street. Map © Google.
Why this score? — see what drove the D+ grade
The composite is a weighted blend of 9 inputs, each scored 0–100. Each bar is that input's sub-score; the figure is the points it added to the 100-point composite (weight × sub-score).
- ARV discount +15.0/15.0
- Appreciation +10.0/10.0
- Cash flow +8.0/30.0
- Schools +4.3/10.0
- Livability +4.0/5.0
- Rent growth +2.7/5.0
- Condition / age +2.5/5.0
- DSCR +2.0/10.0
- 1% rule +1.2/10.0
$400,000
🖨 Deal sheet (PDF) 📄 Offer letter ✓ Due diligence
Listing remarks
PRICED TO SELL! Welcome to this charming single-story home in Counterpoint Estates 5, located in the heart of Royal Palm Beach. Offering 1,020 square feet of living space, this three-bedroom residence features a functional floor plan with comfortable living areas and a convenient one-car garage. The spacious lot provides plenty of room to enjoy the outdoors, entertain guests, or create your own backyard oasis. Ideally situated near parks, schools, shopping, restaurants, and major roadways, this home offers both convenience and value. Whether you're a first-time homebuyer, investor, or looking to downsize, this property presents an excellent opportunity. Don't miss out- schedule your showing
Key facts
- Near schools
- Backyard oasis
- Spacious lot
Tags
Property features AI
Finance
- Other: Pets allowed with no restrictions
Exterior
- Parking: 3 total parking spaces; Attached 1-car garage; 1 covered space; 2 open parking spaces
- Utilities: Public water; Public sewer; Cable available; Electricity available
- Home design: Single-family residence; One story; Faces southeast; Resale property
- Construction: Concrete block with stucco construction
- Exterior features: Not waterfront; Shingle roof
Interior
- Kitchen: Disposal; Dishwasher; Refrigerator
- Bedrooms: 3 bedrooms on the main level
- Flooring: Tile
- Bathrooms: 2 full bathrooms (main level)
- Heating & cooling: Central heating; Central air conditioning
- Interior features: Accessible entrance; Shutters
- Laundry & utility: In-unit laundry
Neighborhood map
What this means for you Summary
Snapshot
- This is a 3-bed/2.0-bath single-family listed at $400k.
Deal economics
- At list price, monthly cash flow is $-410 ($-5k/yr) — negative.
- To cash-flow at today's rent, offer at most $328k (18.1% below list).
- To meet the 1% rule (rent ≥ 1% of price), the offer needs to be $249k (37.8% below list).
- Recommended offer: $249k (37.8% below list) — sets the bar for 1% rule.
Location & tenants
- Location reads 79/100 on livability (#135 in FL, #2,039 nationally) — a middle-class / working-renter tenant base. Strengths: employment A+, housing A+, health & safety A+; Watch: cost of living C-, amenities F, commute F.
- Palm Beach (suburban): math 46% / reading 53% proficiency, ranked #34 of 73 in FL (top 47%) — families likely to look elsewhere, expect single-tenant / working-renter base with shorter leases.
- Zoned schools: Royal Palm Beach Elementary School (math 58% / reading 62%, grade B-, #680 of 2,144 statewide, top 32%, 662 students, 40% FRL); Crestwood Community Middle (math 49% / reading 52%, grade C, #246 of 571 statewide, top 44%, 724 students, 50% FRL); Royal Palm Beach High School (math 22% / reading 38%, grade F, #441 of 667 statewide, top 67%, 2,343 students, 57% FRL) — zoned schools at 49% FRL track the district average.
- Market conditions: Rents flat; 583 active listings in the ZIP; 30 comparable units currently listed for rent nearby; rentals at typical pace (median 23d on market — plan ~3-4 weeks tenant-placement turnaround); solid renter incomes; 3,974 units permitted in Palm Beach County in 2024 (1,012 in 5+ unit buildings).
- This rent runs 32% of the median local income ($93k/yr) — at the standard rent-burdened threshold; future hikes will face affordability resistance.
Forward outlook
- In year one you build about $43k of equity ($3k loan paydown + $40k appreciation (10.0% local appreciation)).
- Palm Beach County population projected at +30% by 2050 — long-run rental-demand tailwind backs the buy-and-hold thesis.
- By year 2, paydown + projected appreciation supports a ~$69k cash-out refi (75% LTV) — recoverable capital for the next deal without selling this one.
Negotiation context
- Only 6 days on market — expect competitive offers; lowballing is unlikely to land.
Risks & watch-outs
- Climate carrying-cost: severe wind risk, 99% chance of damaging wind over 30y; extreme-heat days projected 7→27/yr by 2055 (HVAC capex compounding) — expect insurance premiums to compound above CPI over the hold.
Questions for the listing agent
- What do current leases actually rent for vs. the listed asking? Can we see a recent rent roll and the last 12 months of T-12 income?
- Is there a deadline driving the sale (1031 exchange, divorce, estate, relocation)? That informs how much negotiation room exists.
- Schools are B-rated — typically a magnet for longer-tenancy family renters. What's the average tenant stay here, and is there a school-zone premium baked into asking?
- The area grade is low — what's the realistic commute time and amenity access for the typical tenant pool here? Any planned neighborhood developments (good or bad) we should know about?
- What's the average days-on-market for RENTAL listings here right now (not sales)? A rising rental-DOM trend means longer vacancies and softer asking-rent achievability than the comps imply.
- What's the recent tenant-quality profile in this submarket — average credit score on applications, eviction rate, late-payment / NSF rate, and stable-employment percentage? A property-management company in the area should have these aggregated.
- How much new for-sale + rental construction is in the pipeline within 1–3 miles? Heavy new supply typically softens prices + rents 12–24 months out; constrained supply supports both.
Investment metrics
- 1% rule
- 0.62% ✗
- Cap rate
- 5.06%
- Cash-on-cash
- -4.39%
- DSCR
- 0.80
- GRM
- 13.4
CMA / ARV
- ARV (on-the-fly)
- $485,520
- Comps found
- 1
Show comp detail 1 sale within ~0.75 mi
| Address | Dist | Beds/Ba | Sqft | Sold | Price | $/sf | Match |
|---|---|---|---|---|---|---|---|
| 1413 Ryan Ln | 0.55mi | 3/2.0 | 924 (-9%) | 8mo | $440,000 | $476 | 51 |
Match score weights: distance 35% · size 25% · config 20% · recency 20%. Top-matched comps best support the ARV.
Projected returns pro-forma
10.0% appreciation · 0.85% rent growth · sell at horizon
- IRR
- 20.6%
- Equity multiple
- 2.66×
- Total profit
- $186,285
- Equity at exit
- $360,352
- IRR
- 18.4%
- Equity multiple
- 5.99×
- Total profit
- $558,914
- Equity at exit
- $777,112
Cash invested: $112,000 (down + closing). Projections, not guarantees.
Landlord ↔ Tenant lean methodology
- Overall (STATE)
- 87 Strongly Landlord-Friendly
- State Florida
- 87 Strongly Landlord-Friendly · R+3
- County
- — inherits STATE
- City
- — inherits STATE
ZIP-level market 33411
- Home prices YoY
- 1.9%
- Rents YoY
- 0.8%
- Active inventory
- 583
- Price-to-rent
- 13.4×
Monthly cashflow live
- Estimated rent
- $2,489 high interval (Pro) →
- Mortgage (P&I)
- −$2,098
- Tax from tax record
- −$112 /mo · $1,338/yr
- Insurance
- −$167
- HOA
- −$0
- Vacancy / Maint / Mgmt
- −$523
- Net cashflow
- $-410
Break-even live
Sensitivity live
| Price | -10% $-183 | -5% $-296 | +0% $-410 | +5% $-523 | +10% $-636 |
|---|---|---|---|---|---|
| Rent | -10% $-606 | -5% $-508 | +0% $-410 | +5% $-311 | +10% $-213 |
| Rate | -1.0pp $-208 | -0.5pp $-308 | base $-410 | +0.5pp $-513 | +1.0pp $-619 |
UW: 25.0% down · 7.5% · 30yr · 1.5% tax · 5.0% vac · 8.0% maint · 8.0% mgmt
Financing live
Cash to close
- Down payment
- $100,000
- Closing costs
- $12,000
- Reserves months
- —
- Total cash needed
- —
Loan-product check · same deal, 3 products live
Conventional
25% down · 7.5% · 30yr
- Down + closing
- —
- Monthly P&I
- —
- Monthly cashflow
- —
- DSCR
- —
- Eligible?
- —
Personal DTI + credit; lowest rate.
DSCR
20% down · 8.5% · 30yr
- Down + closing
- —
- Monthly P&I
- —
- Monthly cashflow
- —
- DSCR
- —
- Eligible?
- —
No personal income docs; deal must DSCR.
Hard money
10% down · 12.0% · 12mo
- Down + closing
- —
- Monthly P&I
- —
- Monthly cashflow
- —
- DSCR
- —
- Eligible?
- —
Short-term bridge; refi at stabilization.
Rent comps 30 comps
| Address | Beds | Baths | Sqft | Rent | $/sqft | DOM | Units | Dist |
|---|---|---|---|---|---|---|---|---|
| 10300 Fox Trail Rd S , FL | 2.0 | 2.0 | 1048 | $2,300 | $2.19 | 26d | 1 | 0.70mi |
| 10863 Dalmany Way Royal Palm Beach, FL | 3.0 | 2.0 | 1232 | $3,500 | $2.84 | 26d | 1 | 0.72mi |
| 118 Bobwhite Rd Royal Palm Beach, FL | 3.0 | 2.0 | 1444 | $3,200 | $2.22 | 19d | 1 | 0.73mi |
| 10324 Fox Trail Rd S Unit 324 Royal Palm Beach, FL | 2.0 | 2.0 | 1048 | $1,900 | $1.81 | 26d | 1 | 0.74mi |
| 10336 Fox Trail Rd S #1305 West Palm Beach, FL | 2.0 | 2.0 | 1048 | $2,100 | $2.00 | 26d | 1 | 0.77mi |
| 10336 Fox Trail Rd S Royal Palm Beach, FL | 2.0 | 2.0 | 1048 | $2,100 | $2.00 | 1d | 1 | 0.77mi |
| 10354 Fox Trail Rd S #1501 West Palm Beach, FL | 2.0 | 2.0 | 1048 | $2,000 | $1.91 | 18d | 1 | 0.80mi |
| 10276 Fox Trail Rd S West Palm Beach, FL | 2.0 | 2.0 | 1051 | $1,900 | $1.81 | 26d | 2 | 0.81mi |
| 10276 Fox Trail Rd S #110 West Palm Beach, FL | 2.0 | 2.0 | 1051 | $2,000 | $1.90 | 24d | 1 | 0.81mi |
| 1049 Grandview Cir Royal Palm Beach, FL | 3.0 | 2.0 | 792 | $3,100 | $3.91 | 19d | 1 | 0.82mi |
| 10360 Fox Trail Rd S #1602 West Palm Beach, FL | 2.0 | 2.0 | 1048 | $1,920 | $1.83 | 22d | 1 | 0.83mi |
| 9873 Baywinds Dr #5212 West Palm Beach, FL | 3.0 | 2.0 | 1310 | $2,450 | $1.87 | 26d | 1 | 1.05mi |
| 9901 Baywinds Dr #3202 West Palm Beach, FL | 3.0 | 2.0 | 1310 | $2,500 | $1.91 | 26d | 1 | 1.06mi |
| 9901 Baywinds Dr #3202 West Palm Beach, FL | 3.0 | 2.0 | 1310 | $1,200 | $0.92 | 16d | 1 | 1.06mi |
| 9905 Baywinds Dr West Palm Beach, FL | 2.0 | 2.0 | 1141 | $2,400 | $2.10 | 16d | 2 | 1.07mi |
| 9905 Baywinds Dr West Palm Beach, FL | 1.0–2.0 | 1.0–2.0 | 1036 | $2,250 | $2.17 | 6d | 2 | 1.07mi |
| 9825 Baywinds Dr #1302 West Palm Beach, FL | 2.0 | 2.0 | 1141 | $2,295 | $2.01 | 21d | 1 | 1.11mi |
| 9825 Baywinds Blvd Unit 1125 West Palm Beach, FL | 2.0 | 2.0 | 1258 | $1,925 | $1.53 | 21d | 1 | 1.12mi |
| 9825 Baywinds Dr West Palm Beach, FL | 2.0 | 2.0 | 1199 | $2,110 | $1.76 | 26d | 2 | 1.12mi |
| 9857 Baywinds Dr #9210 West Palm Beach, FL | 2.0 | 2.0 | 1141 | $2,395 | $2.10 | 9d | 1 | 1.16mi |
| 9857 Baywinds Dr #9210 West Palm Beach, FL | 2.0 | 2.0 | 1141 | $2,600 | $2.28 | 12d | 1 | 1.16mi |
| 202 Sparrow Dr #1 Royal Palm Beach, FL | 3.0 | 2.0 | 1020 | $2,400 | $2.35 | 26d | 1 | 1.17mi |
| 210 Sparrow Dr #4 Royal Palm Beach, FL | 2.0 | 2.0 | 930 | $1,900 | $2.04 | 22d | 1 | 1.17mi |
| 11260 Channing Way Unit 212 Royal Palm Beach, FL | 3.0 | 2.0 | 1417 | $3,174 | $2.24 | 26d | 1 | 1.29mi |
| 182 Sparrow Dr Unit A Royal Palm Beach, FL | 3.0 | 2.0 | 1485 | $3,000 | $2.02 | 26d | 1 | 1.30mi |
| 9766 Galleon Dr West Palm Beach, FL | 2.0 | 2.0 | 1259 | $2,240 | $1.78 | 4d | 1 | 1.30mi |
| 9363 Bridgeport Dr West Palm Beach, FL | 2.0 | 2.0 | 1368 | $2,750 | $2.01 | 6d | 1 | 1.31mi |
| 9315 Bridgeport Dr West Palm Beach, FL | 2.0 | 2.0 | 1368 | $2,600 | $1.90 | 26d | 1 | 1.33mi |
| 216 Cordoba Cir Royal Palm Beach, FL | 3.0 | 2.0 | 1461 | $3,440 | $2.35 | 1d | 1 | 1.46mi |
| 11020 Town Cir Wellington, FL | 1.0–3.0 | 1.0–2.0 | 1013 | $3,143 | $3.10 | 3d | 14 | 1.50mi |
Listing history 6 events
-
2026-06-10status $400,000 Pending 6 DOM
-
2026-06-09days on market $400,000 Active 6 DOM
-
2026-06-08days on market $400,000 Active 5 DOM
-
2026-06-07days on market $400,000 Active 4 DOM
-
2026-06-04remarks 699-char remark
-
2026-06-04$400,000 Active 1 DOM
ⓘ Source: listings_history table (triggers on properties + properties_extension) + one-shot
backfill from property_details.listing_events for pre-trigger history.
Tax reassessment forecast FL · Resets to sale price
- Current annual tax
- $1,338 · $112/mo
- Projected year-2 tax
- $3,320 · $277/mo
- Expected delta
- +$1,982/yr (+$165/mo · 148.0%)
ⓘ Screening estimate from a state-policy table — verify with the county assessor before closing.
Climate risk First Street
- Flood 1/10 Low FEMA zone X (unshaded) · 0% chance over 30 yrs
- Wildfire 3/10 Moderate
- Heat 10/10 Extreme 7 d/yr ≥107°F today · 27 d/yr by 30 yrs out
- Wind 10/10 Extreme 99% chance of damaging wind over 30 yrs
- Air quality 2/10 Low 0 unhealthy d/yr today · 1 by 30 yrs out
Nearby sold comps map
Loading sold comps map…
Walkable amenities ~0.75 mi
Loading nearby amenities…
Taxation est. · year 1
- Rental income
- $29,866
- − Mortgage interest
- −$22,406
- − Property taxes
- −$1,338
- − Insurance
- −$2,000
- − Repairs & maintenance
- −$2,389
- − Management
- −$2,389
- − Depreciation
- −$11,636
- Taxable loss
- −$12,294
- Est. tax savings @ 24.0%
- +$2,951
- After-tax cash flow
- $-1,966/yr
For passive investors: Depreciation is non-cash, so a rental often shows a tax loss while cash-flowing — sheltering income. Rental losses are passive: they offset passive income freely, and up to $25,000/yr can offset ordinary (W-2) income if you actively participate and your MAGI is under $100k (phasing out to $0 by $150k); unused losses carry forward. On sale, claimed depreciation is recaptured at up to 25%, and gains may owe capital-gains tax (a 1031 exchange can defer both). Figures are a year-1 estimate at your 24.0% rate — not tax advice; consult a CPA.
Schools (NCES district)
- District
- Palm Beach
- NCES district ID
- 1201500
- Math proficiency
- 46% ▼ -16.00%
- Reading proficiency
- 53% ▼ -4.00%
- Median HH income
- $53,943
- Composite
- 42.72/100
- National rank
- #3160
- State rank
- #34 of 73 in FL
Livability — Royal Palm Beach
- Score
- 79/100
- State rank
- #135
- US rank
- #2039
Category grades
Schools grade is shown separately in the Schools card above.
Census & demographics
- Census place
- Royal Palm Beach, FL
- County
- Palm Beach County · 1,438,312 people
- City population
- 75,299
- Metro
- Miami-Fort Lauderdale-Pompano Beach, FL
- Population (ZIP)
- 76,863
- Household income
- $92,591
- Rent vs Own
- Severe rent burden
- 1870.0
Population outlook (Palm Beach County) Hauer SSP2
- Today (2025)
- 1,637,487 people
- By 2030
- 1,743,255 · +6.5%
- By 2040
- 1,948,712 · +19.0%
- By 2050
- 2,132,979 · +30.3%
- By 2075
- 2,530,027 · +54.5%
- By 2100
- 2,706,979 · +65.3%
Race, ethnicity, and origin ACS 2023
- Neighborhood character
- Diverse neighborhood (Simpson 0.70)
- Race & ethnicity
- White 44% Hispanic / Latino 24% Black 23% Two or more races 16% Asian 5%
- Hispanic origin (detail)
- Mexican 2% Puerto Rican 5% Cuban 4% Dominican 2%
- Common ancestry
- Hispanic 6% Romanian 2% Italian 1%
- Foreign-born
- 26% · Canada, Jamaica, China
- Languages at home
- 73% English-only · Spanish 17% French/Haitian/Cajun 4% Other Indo-European 2%
Political lean MEDSL · Palm Beach
- 2024 margin
- Toss-up / Even · D 50.0% · R 49.2%
- 2008→2024 swing
- -22.1pp toward R · 2008: 22.9pp · 2024: 0.8pp
- All cycles
- 2024: D+0.8 2020: D+12.8 2016: D+15.3 2012: D+17.0 2008: D+22.9
Not yet ingested
- Civics
- —
Market trends
- HPI YoY
- ▲ 17.04%
- Current HPI
- 903.78
- Rent YoY
- ▲ 0.85%
- Metro
- Miami-Fort Lauderdale-Pompano Beach, FL
- State GDP YoY
- ▲ 3.28%
- F500 in state
- 36
Industry mix (Fortune 500 HQ in FL)
| Industry | F500 HQs | Revenue |
|---|---|---|
| Industrial Technology | 2 | $29B |
|
||
| Insurance | 2 | $17B |
|
||
| Retail | 1 | $60B |
|
||
| Technology Distribution | 1 | $58B |
|
||
| Homebuilding | 1 | $35B |
|
||
| Technology Manufacturing | 1 | $35B |
|
||
Price history
-40.4% since first listed2 events — show timeline
- 2026-06-03 Listed $400,000 Beaches MLS
- 1981-01-01 Sold (Public Records) $671,100 Public Records
Property tax history
+0.5%/yrLatest (2025): $1,338 · +4.3% YoY. Source: county tax records.
Cash-flow waterfall
monthlySold comps — $/sqft
last 12 mo · ≤1 miLoading sold comps…