7401 Sachem Rd · Myrtle Grove, FL
Flood risk 1/10 · Minimal
- FEMA flood zone
- X (unshaded)
- Chance of flooding over 30 yrs
- 0.0%
- Est. flood insurance / yr
- $507 – $1,088
Fire risk 4/10 · Minor
- Est. fire insurance / yr
- $947 – $1,759
Heat risk 10/10 · Severe
- Hot days now (above 105°F)
- 6 days/yr
- Hot days in 30 yrs
- 18 days/yr
Wind risk 9/10 · Severe
- Chance of severe wind over 30 yrs
- 99.0%
Air-quality risk 1/10 · Minimal
- Unhealthy air days now
- 0 days/yr
- Unhealthy air days in 30 yrs
- 0 days/yr
Risk factors via First Street. Map © Google.
Why this score? — see what drove the B grade
The composite is a weighted blend of 9 inputs, each scored 0–100. Each bar is that input's sub-score; the figure is the points it added to the 100-point composite (weight × sub-score).
- Cash flow +30.0/30.0
- 1% rule +10.0/10.0
- DSCR +10.0/10.0
- ARV discount +7.5/15.0
- Schools +3.6/10.0
- Rent growth +3.5/5.0
- Livability +3.2/5.0
- Condition / age +2.5/5.0
- Appreciation +0.0/10.0
$75,000
🖨 Deal sheet (PDF) 📄 Offer letter ✓ Due diligence
Listing remarks
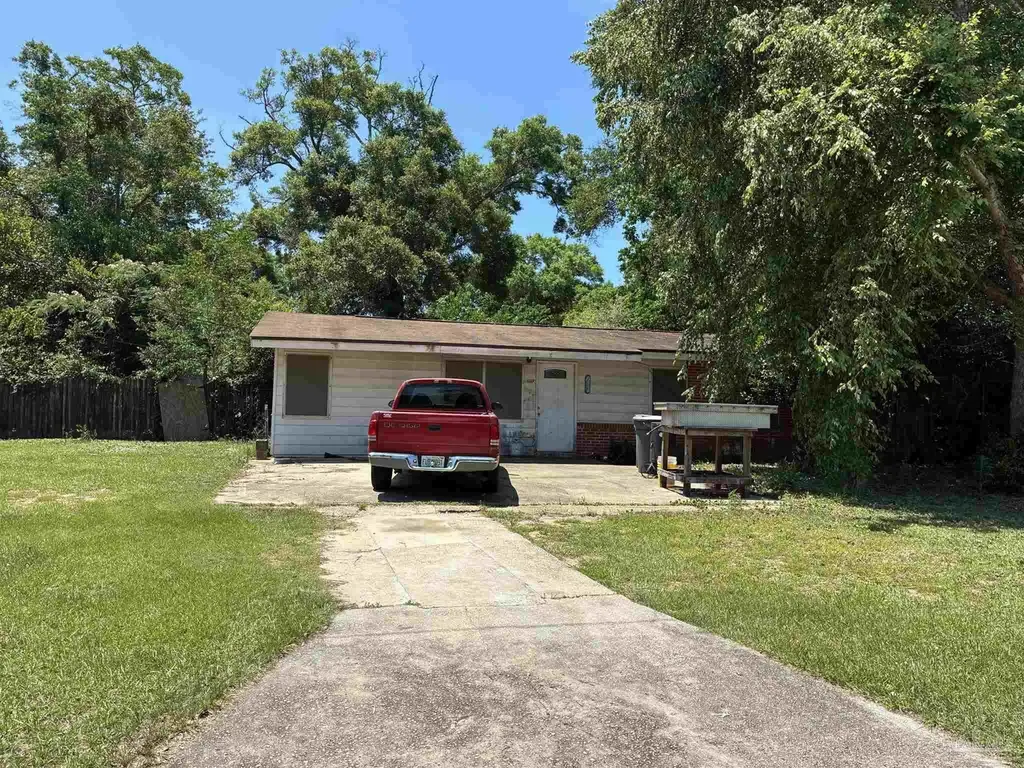
Nestled in the charming Myrtle Grove neighborhood, this 3-bedroom, 1-bath home offers 1,100 square feet of potential. Situated on a desirable corner lot, this fixer-upper is brimming with opportunity—perfect for investors or buyers ready to create their dream space. With a bit of vision and a personal touch, this home could be a true gem in a prime location.
Key facts
- Prime location
- Corner lot
- 9,700 sq ft lot
Tags
Property features AI
Finance
- HOA & community: No homeowners association
Exterior
- Parking: Driveway with open parking
- Utilities: Copper wiring; Septic tank; County-maintained road
- Home design: Single-story brick home; Resale property; Not attached to another unit; Homesteaded
- Construction: Brick construction; Slab foundation; Composition roof; One level
- Exterior features: Corner lot
Interior
- Kitchen: Electric water heater
- Bedrooms: Three bedrooms, all on the first level (two ~11' x 11', one ~13' x 12')
- Flooring: Tile
- Bathrooms: One full bathroom
- Interior features: Tile flooring; Eat-in kitchen
Neighborhood map
What this means for you Summary
Snapshot
- This is a 3-bed/1.0-bath single-family listed at $75k.
Deal economics
- At list price, monthly cash flow is $705 ($8k/yr) — positive.
- The deal already cash-flows at list — no discount required.
- Meets the 1% rule at list price ($1k rent vs $75k).
- Recommended offer: $74k (1.5% below list) — sets the bar for market timing.
- Cap rate 17.6% vs local median 5.1% in Myrtle Grove — top-decile yield for the area; either an underpriced asset or a hidden risk that comps aren't pricing in. Stress-test before assuming the spread holds.
Location & tenants
- Location reads 64/100 on livability (#701 in FL) — a middle-class / working-renter tenant base. Strengths: cost of living A+, housing A+, health & safety B+; Watch: schools D-, amenities F, commute F.
- Escambia (suburban): math 40% / reading 45% proficiency, ranked #56 of 73 in FL (top 77%) — families likely to look elsewhere, expect single-tenant / working-renter base with shorter leases.
- Market conditions: Rents rising (+3.9%/yr); 270 active listings in the ZIP; 9 comparable units currently listed for rent nearby; rentals at typical pace (median 24d on market — plan ~3-4 weeks tenant-placement turnaround); 1,479 units permitted in Escambia County in 2024 (0 in 5+ unit buildings).
Forward outlook
- Local home prices are declining (-3.0%/yr); year-one equity from $519 of loan paydown is wiped out by about $2k of value loss. Plan a longer hold.
- Escambia County population projected at +13% by 2050 — modest demand growth; plan on rents tracking national, not racing it.
- At projected returns (-3.0% appreciation + 3.9% rent growth), your $21k cash investment doubles in ~3 years — after that, you're playing with house money.
Negotiation context
- It's been on market 16 days — a 2% lower offer ($74k) is reasonable based on typical stale-listing flexibility.
- Current owner paid $9k; list at $75k implies a 724% gain — meaningful room to come down on a strong offer.
Risks & watch-outs
- Climate carrying-cost: severe wind risk, 99% chance of damaging wind over 30y; extreme-heat days projected 6→18/yr by 2055 (HVAC capex compounding) — expect insurance premiums to compound above CPI over the hold.
Questions for the listing agent
- Built in 1961 — when were the roof, HVAC, electrical panel, plumbing, and water heater last replaced?
- Is there a deadline driving the sale (1031 exchange, divorce, estate, relocation)? That informs how much negotiation room exists.
- Schools are D-rated, which usually means shorter tenancies and higher turnover. Who's the typical renter profile here, and what's been the actual vacancy rate?
- What's the average days-on-market for RENTAL listings here right now (not sales)? A rising rental-DOM trend means longer vacancies and softer asking-rent achievability than the comps imply.
- What's the recent tenant-quality profile in this submarket — average credit score on applications, eviction rate, late-payment / NSF rate, and stable-employment percentage? A property-management company in the area should have these aggregated.
- How much new for-sale + rental construction is in the pipeline within 1–3 miles? Heavy new supply typically softens prices + rents 12–24 months out; constrained supply supports both.
Investment metrics
- 1% rule
- 1.99% ✓
- Cap rate
- 17.58%
- Cash-on-cash
- 40.31%
- DSCR
- 2.79
- GRM
- 4.2
CMA / ARV
- ARV (on-the-fly)
- $174,900
- Comps found
- 12
Show comp detail 12 sales within ~0.75 mi
| Address | Dist | Beds/Ba | Sqft | Sold | Price | $/sf | Match |
|---|---|---|---|---|---|---|---|
| 720 N 79th Ave | 0.38mi | 3/1.0 | 1,104 (+0%) | 8mo | $105,000 | $95 | 75 |
| 7150 Heather Oaks Dr | 0.20mi | 3/2.0 | 1,152 (+5%) | 5mo | $182,680 | $159 | 74 |
| 7330 Sachem Rd | 0.06mi | 3/1.0 | 1,200 (+9%) | 10mo | $151,000 | $126 | 74 |
| 7051 Heather Oaks Dr | 0.25mi | 3/2.0 | 1,170 (+6%) | 4mo | $160,000 | $137 | 71 |
| 7704 W Gadsden St | 0.45mi | 3/1.0 | 1,152 (+5%) | 1mo | $149,000 | $129 | 70 |
| 6980 Weatherwood Dr | 0.31mi | 3/2.0 | 1,120 (+2%) | 11mo | $180,000 | $161 | 69 |
| 7032 Weatherwood Dr | 0.25mi | 2/2.0 (-1) | 1,044 (-5%) | 4mo | $199,000 | $191 | 67 |
| 7823 Montego Dr | 0.38mi | 3/2.0 | 1,062 (-4%) | 8mo | $180,000 | $169 | 66 |
| 7151 Heather Oaks Dr | 0.19mi | 3/2.0 | 1,191 (+8%) | 10mo | $177,000 | $149 | 65 |
| 7060 Heather Oaks Dr | 0.25mi | 3/2.0 | 1,248 (+14%) | 1mo | $200,000 | $160 | 61 |
| 7100 Heather Oaks Dr | 0.23mi | 3/2.0 | 1,230 (+12%) | 8mo | $170,000 | $138 | 58 |
| 718 N 75th Ave | 0.30mi | 3/2.0 | 1,192 (+8%) | 12mo | $216,000 | $181 | 58 |
Match score weights: distance 35% · size 25% · config 20% · recency 20%. Top-matched comps best support the ARV.
Projected returns pro-forma
-3.0% appreciation · 3.85% rent growth · sell at horizon
- IRR
- 37.6%
- Equity multiple
- 2.62×
- Total profit
- $34,054
- Equity at exit
- $11,183
- IRR
- 44.6%
- Equity multiple
- 5.42×
- Total profit
- $92,847
- Equity at exit
- $6,485
Cash invested: $21,000 (down + closing). Projections, not guarantees.
Landlord ↔ Tenant lean methodology
- Overall (STATE)
- 87 Strongly Landlord-Friendly
- State Florida
- 87 Strongly Landlord-Friendly · R+3
- County
- — inherits STATE
- City
- — inherits STATE
ZIP-level market 32506
- Home prices YoY
- -22.5%
- Rents YoY
- 3.9%
- Active inventory
- 270
- Price-to-rent
- 4.2×
Monthly cashflow live
- Estimated rent
- $1,490 high interval (Pro) →
- Mortgage (P&I)
- −$393
- Tax from tax record
- −$47 /mo · $569/yr
- Insurance
- −$31
- HOA
- −$0
- Vacancy / Maint / Mgmt
- −$313
- Net cashflow
- $705
Break-even live
Sensitivity live
| Price | -10% $748 | -5% $727 | +0% $705 | +5% $684 | +10% $663 |
|---|---|---|---|---|---|
| Rent | -10% $588 | -5% $647 | +0% $705 | +5% $764 | +10% $823 |
| Rate | -1.0pp $743 | -0.5pp $724 | base $705 | +0.5pp $686 | +1.0pp $666 |
UW: 25.0% down · 7.5% · 30yr · 1.5% tax · 5.0% vac · 8.0% maint · 8.0% mgmt
Financing live
Cash to close
- Down payment
- $18,750
- Closing costs
- $2,250
- Reserves months
- —
- Total cash needed
- —
Loan-product check · same deal, 3 products live
Conventional
25% down · 7.5% · 30yr
- Down + closing
- —
- Monthly P&I
- —
- Monthly cashflow
- —
- DSCR
- —
- Eligible?
- —
Personal DTI + credit; lowest rate.
DSCR
20% down · 8.5% · 30yr
- Down + closing
- —
- Monthly P&I
- —
- Monthly cashflow
- —
- DSCR
- —
- Eligible?
- —
No personal income docs; deal must DSCR.
Hard money
10% down · 12.0% · 12mo
- Down + closing
- —
- Monthly P&I
- —
- Monthly cashflow
- —
- DSCR
- —
- Eligible?
- —
Short-term bridge; refi at stabilization.
Rent comps 9 comps
| Address | Beds | Baths | Sqft | Rent | $/sqft | DOM | Units | Dist |
|---|---|---|---|---|---|---|---|---|
| 7200 Lillian Hwy Pensacola, FL | 2.0 | 1.0 | 675 | $1,200 | $1.78 | 14d | 11 | 0.28mi |
| 8240 Tempest Dr Pensacola, FL | 2.0 | 2.0 | 1300 | $1,600 | $1.23 | 21d | 1 | 0.63mi |
| 8121 Lillian Hwy #70 Pensacola, FL | 2.0 | 2.0 | 900 | $1,100 | $1.22 | 24d | 1 | 0.69mi |
| 7135 Pearson Rd Unit 7 Pensacola, FL | 2.0 | 2.0 | 902 | $1,125 | $1.25 | 24d | 1 | 1.06mi |
| 7318 Hayward Ave Unit P30 P30 Pensacola, FL | 2.0 | 2.0 | 1000 | $1,200 | $1.20 | 24d | 1 | 1.29mi |
| 3219 Fresno Ave Pensacola, FL | 3.0 | 2.0 | 1192 | $1,375 | $1.15 | 24d | 1 | 1.31mi |
| 150 S Crow Rd Pensacola, FL | 2.0 | 2.5 | 1088 | $1,450 | $1.33 | 24d | 1 | 1.37mi |
| 3230 Palmdale Ave Pensacola, FL | 3.0 | 2.0 | 1300 | $1,500 | $1.15 | 24d | 1 | 1.43mi |
| 8 Villa Dr Pensacola, FL | 2.0 | 2.0 | 1000 | $1,362 | $1.36 | 21d | 6 | 1.49mi |
Listing history 9 events
-
2026-06-07statusdays on market $75,000 Pending 16 DOM
-
2026-06-03days on market $75,000 Contingent 15 DOM
-
2026-06-02days on market $75,000 Contingent 14 DOM
-
2026-06-01days on market $75,000 Contingent 13 DOM
-
2026-05-31days on market $75,000 Contingent 12 DOM
-
2026-05-31days on market $75,000 Contingent 11 DOM
-
2026-05-20historical Contingent
-
2026-05-19$75,000 Active
-
1966-01-01soldstatus $9,100
ⓘ Source: listings_history table (triggers on properties + properties_extension) + one-shot
backfill from property_details.listing_events for pre-trigger history.
Tax reassessment forecast FL · Resets to sale price
- Current annual tax
- $569 · $47/mo
- Projected year-2 tax
- $622 · $52/mo
- Expected delta
- +$53/yr (+$4/mo · 9.3%)
ⓘ Screening estimate from a state-policy table — verify with the county assessor before closing.
Climate risk First Street
- Flood 1/10 Low FEMA zone X (unshaded) · 0% chance over 30 yrs
- Wildfire 4/10 Moderate
- Heat 10/10 Extreme 6 d/yr ≥105°F today · 18 d/yr by 30 yrs out
- Wind 9/10 Extreme 99% chance of damaging wind over 30 yrs
- Air quality 1/10 Low 0 unhealthy d/yr today · 0 by 30 yrs out
Nearby sold comps map
Loading sold comps map…
Walkable amenities ~0.75 mi
Loading nearby amenities…
Taxation est. · year 1
- Rental income
- $17,885
- − Mortgage interest
- −$4,201
- − Property taxes
- −$569
- − Insurance
- −$375
- − Repairs & maintenance
- −$1,431
- − Management
- −$1,431
- − Depreciation
- −$2,182
- Taxable income
- $7,696
- Est. tax owed @ 24.0%
- −$1,847
- After-tax cash flow
- $6,618/yr
For passive investors: Depreciation is non-cash, so a rental often shows a tax loss while cash-flowing — sheltering income. Rental losses are passive: they offset passive income freely, and up to $25,000/yr can offset ordinary (W-2) income if you actively participate and your MAGI is under $100k (phasing out to $0 by $150k); unused losses carry forward. On sale, claimed depreciation is recaptured at up to 25%, and gains may owe capital-gains tax (a 1031 exchange can defer both). Figures are a year-1 estimate at your 24.0% rate — not tax advice; consult a CPA.
Schools (NCES district)
- District
- Escambia
- NCES district ID
- 1200510
- Math proficiency
- 40% ▼ -9.00%
- Reading proficiency
- 45% ▼ -4.00%
- Median HH income
- $44,649
- Composite
- 36.04/100
- National rank
- #4773
- State rank
- #56 of 73 in FL
Livability — Myrtle Grove
- Score
- 64/100
- State rank
- #701
- US rank
- #14805
Category grades
Schools grade is shown separately in the Schools card above.
Census & demographics
- Census place
- Myrtle Grove, FL
- County
- Escambia County · 301,722 people
- City population
- 1,170
- Metro
- Pensacola-Ferry Pass-Brent, FL
- Population (ZIP)
- 34,549
- Household income
- $62,486
- Rent vs Own
- Severe rent burden
- 1359.0
Population outlook (Escambia County) Hauer SSP2
- Today (2025)
- 334,637 people
- By 2030
- 345,779 · +3.3%
- By 2040
- 364,828 · +9.0%
- By 2050
- 378,514 · +13.1%
- By 2075
- 403,220 · +20.5%
- By 2100
- 386,125 · +15.4%
Race, ethnicity, and origin ACS 2023
- Neighborhood character
- Diverse neighborhood (Simpson 0.60)
- Race & ethnicity
- White 60% Black 18% Two or more races 11% Hispanic / Latino 6% Asian 6%
- Hispanic origin (detail)
- Mexican 3%
- Common ancestry
- Lithuanian 4% Slovak 2% Italian 2%
- Foreign-born
- 9% · Canada, China, Vietnam
- Languages at home
- 89% English-only · Spanish 4% Tagalog/Filipino 2% Other Indo-European 1%
Political lean MEDSL · Escambia
- 2024 margin
- R (+19.5) · D 39.7% · R 59.2% · Other 1.1%
- 2008→2024 swing
- -0.2pp no change · 2008: -19.3pp · 2024: -19.5pp
- All cycles
- 2024: R+19.5 2020: R+15.1 2016: R+20.6 2012: R+20.6 2008: R+19.3
Not yet ingested
- Civics
- —
Market trends
- HPI YoY
- ▼ -71.86%
- Current HPI
- 247.6085
- Rent YoY
- ▲ 3.85%
- Metro
- Pensacola-Ferry Pass-Brent, FL
- State GDP YoY
- ▲ 3.28%
- F500 in state
- 36
Industry mix (Fortune 500 HQ in FL)
| Industry | F500 HQs | Revenue |
|---|---|---|
| Industrial Technology | 2 | $29B |
|
||
| Insurance | 2 | $17B |
|
||
| Retail | 1 | $60B |
|
||
| Technology Distribution | 1 | $58B |
|
||
| Homebuilding | 1 | $35B |
|
||
| Technology Manufacturing | 1 | $35B |
|
||
Price history
+724.2% since first listed3 events — show timeline
- 2026-05-20 Contingent — PARMLS
- 2026-05-19 Listed $75,000 PARMLS
- 1966-01-01 Sold (Public Records) $9,100 Public Records
Property tax history
+5.7%/yrLatest (2025): $569 · +27.1% YoY. Source: county tax records.
Cash-flow waterfall
monthlySold comps — $/sqft
last 12 mo · ≤1 miLoading sold comps…