23245 Coconut Shores Dr · Estero, FL
Flood risk 4/10 · Minor
- FEMA flood zone
- X (unshaded)
- Chance of flooding over 30 yrs
- 0.16%
- Est. flood insurance / yr
- $507 – $1,088
Fire risk 3/10 · Minor
- Est. fire insurance / yr
- $947 – $1,759
Heat risk 10/10 · Severe
- Hot days now (above 107°F)
- 7 days/yr
- Hot days in 30 yrs
- 30 days/yr
Wind risk 10/10 · Severe
- Chance of severe wind over 30 yrs
- 99.0%
Air-quality risk 3/10 · Minor
- Unhealthy air days now
- 2 days/yr
- Unhealthy air days in 30 yrs
- 2 days/yr
Risk factors via First Street. Map © Google.
Why this score? — see what drove the F grade
The composite is a weighted blend of 9 inputs, each scored 0–100. Each bar is that input's sub-score; the figure is the points it added to the 100-point composite (weight × sub-score).
- Cash flow +7.9/30.0
- ARV discount +7.5/15.0
- Schools +4.1/10.0
- Livability +4.0/5.0
- 1% rule +3.5/10.0
- Rent growth +3.2/5.0
- Condition / age +2.5/5.0
- DSCR +2.0/10.0
- Appreciation +0.0/10.0
$425,000
🖨 Deal sheet 📄 Offer letter ✓ Due diligence
Listing remarks
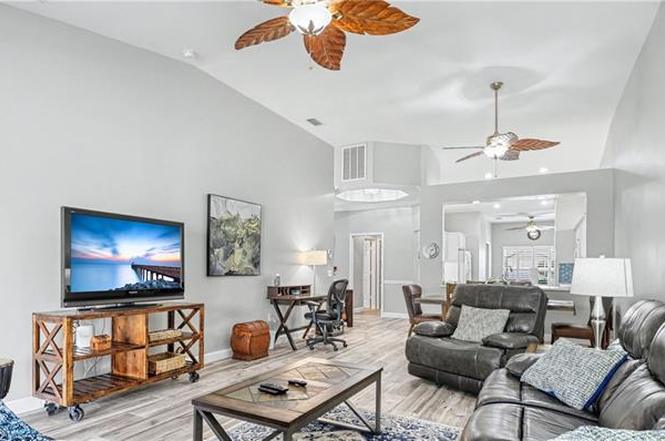
Ideally located west of US-41 in Estero, this beautifully maintained turnkey-furnished villa offers an unbeatable combination of location, lifestyle, and value. Nestled in the gated boutique community of Coconut Shores, the home is just minutes from Coconut Point Mall, the Hyatt Regency, and the exciting new Woodfield Estero development, with dining, shopping, and beaches all close by. This 3-bedroom, 2-bath residence with a 2-car garage offers 1,703 square feet of living area and is a short walk to the community’s amenities, including 2 pickleball courts and a tennis court, resort-style pool and spa, club room, fitness center, and fishing pier. Enjoy lower HOA fees, no CDD, and the a
Key facts
- Club room
- Fitness center
- 4,399 sq ft lot
Tags
Property features AI
Finance
- Other: Part of a complex with 165 units; single-unit building with 1 floor; Lot dimensions and restrictions recorded (architectural and deeded)
- HOA & community: Mandatory HOA; Quarterly HOA fee ($590); Master HOA fee quarterly ($763); Professional management; Maintenance covers cable, internet/WiFi, irrigation water, lawn/land maintenance, legal/accounting, manager, and recreation facilities; Community amenities include clubhouse, community pool, spa/hot tub, exercise room, tennis and pickleball courts, community room, sidewalks, streetlights, and underground utilities; Gated community; One-time fees and total recurring fees applicable
Exterior
- Parking: Attached 2-car garage
- Security: Gated community; Electric and manual shutters
- Utilities: Central water (assessment paid); Central sewer (assessment paid); Central electric heat; Central electric cooling; Cable available
- Home design: Attached villa (1 story / ranch); Rear exposure to the east; Residential property in Coconut Shores
- Construction: Concrete block construction; Stucco exterior; Tile roof; Built in 2002
- Exterior features: Patio; Zero lot line; Landscaped area view; Private road access
Interior
- Kitchen: Dishwasher; Range; Microwave; Refrigerator/ice maker; Pantry
- Bedrooms: 3 bedrooms
- Bathrooms: 2 full bathrooms; Master bath with dual sinks and shower (no tub)
- Interior features: Bar; Cable prewire; Foyer; High-speed internet available; Pantry; Smoke detectors; Tray ceiling; Walk-in closet; Window coverings; Dining area is combined with living; Great room / split bedroom floor plan; Screened lanai/porch; Turnkey furnished; 7 ceiling fans
- Laundry & utility: Washer; Dryer; Laundry in residence; Automatic garage door opener
Neighborhood map
What this means for you Summary
Snapshot
- This is a 2-bed/2.0-bath condo listed at $425k.
Deal economics
- At list price, monthly cash flow is $-451 ($-5k/yr) — negative.
- To cash-flow at today's rent, offer at most $345k (18.7% below list).
- To meet the 1% rule (rent ≥ 1% of price), the offer needs to be $361k (15.2% below list).
- Recommended offer: $345k (18.7% below list) — sets the bar for cash-flow.
- Cap rate 5.0% vs local median 3.4% in Estero — top-decile yield for the area; either an underpriced asset or a hidden risk that comps aren't pricing in. Stress-test before assuming the spread holds.
Location & tenants
- Location reads 79/100 on livability (#149 in FL, #2,242 nationally) — a middle-class / working-renter tenant base. Strengths: crime A+, employment A+, housing A+; Watch: amenities F, commute F, cost of living D-.
- Lee (suburban): math 47% / reading 50% proficiency, ranked #42 of 73 in FL (top 58%) — families likely to look elsewhere, expect single-tenant / working-renter base with shorter leases.
- Market conditions: Rents rising (+2.9%/yr); 699 active listings in the ZIP; 40 comparable units currently listed for rent nearby; rentals at typical pace (median 24d on market — plan ~3-4 weeks tenant-placement turnaround); high-income renter base; 15,411 units permitted in Lee County in 2024 (4,686 in 5+ unit buildings).
- This rent runs 33% of the median local income ($131k/yr) — at the standard rent-burdened threshold; future hikes will face affordability resistance.
Forward outlook
- Local home prices are declining (-3.0%/yr); year-one equity from $3k of loan paydown is wiped out by about $13k of value loss. Plan a longer hold.
- Lee County population projected at +44% by 2050 — long-run rental-demand tailwind backs the buy-and-hold thesis.
Negotiation context
- It's been on market 123 days — a 12% lower offer ($374k) is reasonable based on typical stale-listing flexibility.
- Current owner paid $224k; list at $425k implies a 90% gain — meaningful room to come down on a strong offer.
Risks & watch-outs
- Climate carrying-cost: severe wind risk, 99% chance of damaging wind over 30y; extreme-heat days projected 7→30/yr by 2055 (HVAC capex compounding) — expect insurance premiums to compound above CPI over the hold.
Questions for the listing agent
- What do current leases actually rent for vs. the listed asking? Can we see a recent rent roll and the last 12 months of T-12 income?
- It's been on market 123 days. Have you received any prior offers? Is the seller open to a 19% concession, seller financing, or rate buy-down credit?
- What does the HOA fee cover, when was the last increase, and are there any pending special assessments or reserve-fund shortfalls?
- Any open or pending special assessments — roof, HVAC, plumbing, elevator, façade? What's the per-unit balance and payoff schedule, and is the seller paying it off at close or rolling it to the buyer?
- Why hasn't it sold? Are there any deal-killer items the seller is aware of (foundation, flood, title, zoning, code violations)?
- Is there a deadline driving the sale (1031 exchange, divorce, estate, relocation)? That informs how much negotiation room exists.
- Schools are A-rated — typically a magnet for longer-tenancy family renters. What's the average tenant stay here, and is there a school-zone premium baked into asking?
- The area grade is low — what's the realistic commute time and amenity access for the typical tenant pool here? Any planned neighborhood developments (good or bad) we should know about?
- What's the average days-on-market for RENTAL listings here right now (not sales)? A rising rental-DOM trend means longer vacancies and softer asking-rent achievability than the comps imply.
- What's the recent tenant-quality profile in this submarket — average credit score on applications, eviction rate, late-payment / NSF rate, and stable-employment percentage? A property-management company in the area should have these aggregated.
- How much new apartment / multifamily construction is in the pipeline within 1–3 miles? Heavy new supply (>2% of stock underway) typically softens rents 12–24 months out; light construction supports rent growth.
Investment metrics
- 1% rule
- 0.85% ✗
- Cap rate
- 5.02%
- Cash-on-cash
- -4.55%
- DSCR
- 0.80
- GRM
- 9.8
CMA / ARV
No comps found within radius.
Projected returns pro-forma
-3.0% appreciation · 2.85% rent growth · sell at horizon
- IRR
- -24.1%
- Equity multiple
- 0.18×
- Total profit
- $-97,850
- Equity at exit
- $63,369
- IRR
- -19.6%
- Equity multiple
- -0.04×
- Total profit
- $-123,280
- Equity at exit
- $36,746
Cash invested: $119,000 (down + closing). Projections, not guarantees.
Landlord ↔ Tenant lean methodology
- Overall (STATE)
- 87 Strongly Landlord-Friendly
- State Florida
- 87 Strongly Landlord-Friendly · R+3
- County
- — inherits STATE
- City
- — inherits STATE
ZIP-level market 34134
- Rents YoY
- 2.9%
- Active inventory
- 699
- Price-to-rent
- 9.8×
Monthly cashflow live
- Estimated rent
- $3,606 high interval (Pro) →
- Mortgage (P&I)
- −$2,229
- Tax from tax record
- −$443 /mo · $5,314/yr
- Insurance
- −$177
- HOA
- −$451
- Vacancy / Maint / Mgmt
- −$757
- Net cashflow
- $-451
Break-even live
UW: 25.0% down · 7.5% · 30yr · 1.5% tax · 5.0% vac · 8.0% maint · 8.0% mgmt
Financing live
Cash to close
- Down payment
- $106,250
- Closing costs
- $12,750
- Reserves months
- —
- Total cash needed
- —
Loan-product check · same deal, 3 products live
Conventional
25% down · 7.5% · 30yr
- Down + closing
- —
- Monthly P&I
- —
- Monthly cashflow
- —
- DSCR
- —
- Eligible?
- —
Personal DTI + credit; lowest rate.
DSCR
20% down · 8.5% · 30yr
- Down + closing
- —
- Monthly P&I
- —
- Monthly cashflow
- —
- DSCR
- —
- Eligible?
- —
No personal income docs; deal must DSCR.
Hard money
10% down · 12.0% · 12mo
- Down + closing
- —
- Monthly P&I
- —
- Monthly cashflow
- —
- DSCR
- —
- Eligible?
- —
Short-term bridge; refi at stabilization.
Rent comps 40 comps
| Address | Beds | Baths | Sqft | Rent | $/sqft | DOM | Units | Dist |
|---|---|---|---|---|---|---|---|---|
| 23176 Grassy Pine Dr Estero, FL | 2.0 | 2.0 | 1954 | $5,000 | $2.56 | 24d | 1 | 0.21mi |
| 3441 Morning Lake Dr #202 Estero, FL | 3.0 | 2.5 | 2045 | $6,000 | $2.93 | 10d | 1 | 0.23mi |
| 23036 Lone Oak Dr Estero, FL | 3.0 | 2.0 | 1524 | $4,500 | $2.95 | 24d | 1 | 0.31mi |
| 23007 Lone Oak Dr Estero, FL | 2.0 | 2.0 | 1524 | $3,950 | $2.59 | 24d | 1 | 0.37mi |
| 23520 Walden Center Dr #308 Estero, FL | 2.0 | 2.0 | 1239 | $2,000 | $1.61 | 3d | 1 | 0.37mi |
| 23520 Walden Center Dr #308 Estero, FL | 2.0 | 2.0 | 1239 | $2,000 | $1.61 | 24d | 1 | 0.37mi |
| 23640 Walden Center Dr #106 Estero, FL | 2.0 | 2.0 | 1052 | $1,850 | $1.76 | 2d | 1 | 0.40mi |
| 23500 Walden Center Dr Estero, FL | 1.0–2.0 | 1.0–2.0 | 803 | $2,800 | $3.48 | 16d | 3 | 0.42mi |
| 23680 Walden Center Dr #107 Estero, FL | 2.0 | 2.0 | 1052 | $1,900 | $1.81 | 3d | 1 | 0.46mi |
| 23710 Walden Center Dr #308 Estero, FL | 3.0 | 2.0 | 1355 | $3,000 | $2.21 | 24d | 1 | 0.48mi |
| 3578 Heron Cove Ct Bonita Springs, FL | 3.0 | 3.0 | 2185 | $9,000 | $4.12 | 24d | 1 | 0.55mi |
| 8010 Via Sardinia St #202 Estero, FL | 2.0 | 2.0 | 1480 | $2,200 | $1.49 | 16d | 1 | 0.57mi |
| 8010 Via Sardinia Way #4208 Estero, FL | 3.0 | 2.0 | 1351 | $3,800 | $2.81 | 24d | 1 | 0.57mi |
| 8010 Via Sardinia Way Estero, FL | 1.0–2.0 | 1.5–2.0 | 1202 | $2,300 | $1.91 | 24d | 2 | 0.57mi |
| 23161 Fashion Dr #7109 Estero, FL | 2.0 | 2.0 | 1444 | $4,000 | $2.77 | 24d | 1 | 0.59mi |
| 8000 Via Sardinia Way #5207 Estero, FL | 2.0 | 2.0 | 1380 | $5,500 | $3.99 | 24d | 1 | 0.60mi |
| 8000 Via Sardinia Way #5301 Estero, FL | 3.0 | 2.0 | 1351 | $2,500 | $1.85 | 3d | 1 | 0.60mi |
| 23159 Amgci Way #3314 Estero, FL | 2.0 | 2.0 | 1226 | $2,400 | $1.96 | 24d | 1 | 0.62mi |
| 23159 Amgci Way Estero, FL | 1.0–2.0 | 1.5–2.0 | 1164 | $4,500 | $3.87 | 21d | 2 | 0.62mi |
| 8011 Via Monte Carlo Way #2209 Estero, FL | 2.0 | 2.5 | 1857 | $2,800 | $1.51 | 19d | 1 | 0.64mi |
| 8011 Via Monte Carlo Way #2213 Estero, FL | 2.0 | 2.0 | 1226 | $2,450 | $2.00 | 12d | 1 | 0.64mi |
| 21715 Bridgegate Ct Estero, FL | 3.0 | 2.0 | 1407 | $2,750 | $1.95 | 24d | 1 | 0.64mi |
| 8001 Via Monte Carlo Way Unit 103 Estero, FL | 3.0 | 2.0 | 1351 | $2,800 | $2.07 | 19d | 1 | 0.67mi |
| 8560 Evernia Ct #204 Estero, FL | 3.0 | 2.0 | 1440 | $2,100 | $1.46 | 21d | 1 | 0.70mi |
| 8561 Evernia Ct #101 Estero, FL | 2.0 | 2.0 | 1068 | $2,000 | $1.87 | 24d | 1 | 0.72mi |
| 8540 Violeta St #202 Estero, FL | 3.0 | 2.0 | 1440 | $2,495 | $1.73 | 24d | 1 | 0.72mi |
| 22201 Fountain Lakes Blvd Estero, FL | 1.0–3.0 | 1.0–2.0 | 1000 | $1,600 | $1.60 | 24d | 1 | 0.73mi |
| 8560 Violeta St #101 Estero, FL | 2.0 | 3.0 | 1261 | $2,200 | $1.74 | 24d | 1 | 0.73mi |
| 8561 Violeta St #202 Bonita Springs, FL | 3.0 | 2.0 | 1440 | $2,950 | $2.05 | 24d | 1 | 0.75mi |
| 3685 Stone Way Estero, FL | 2.0 | 2.0 | 1115 | $1,500 | $1.35 | 24d | 1 | 0.75mi |
| 23520 Alamanda Dr #202 Estero, FL | 3.0 | 2.0 | 1452 | $5,500 | $3.79 | 24d | 1 | 0.79mi |
| 23520 Alamanda Dr #203 Estero, FL | 2.0 | 2.0 | 1244 | $2,200 | $1.77 | 3d | 1 | 0.79mi |
| 8510 Violeta St #201 Estero, FL | 2.0 | 2.0 | 1152 | $2,400 | $2.08 | 24d | 1 | 0.79mi |
| 8500 Violeta St #102 Estero, FL | 2.0 | 2.0 | 1468 | $5,200 | $3.54 | 2d | 1 | 0.82mi |
| 23550 Alamanda Dr #102 Estero, FL | 3.0 | 2.5 | 1616 | $5,200 | $3.22 | 24d | 1 | 0.83mi |
| 23550 Alamanda Dr #203 Estero, FL | 2.0 | 2.0 | 1152 | $5,000 | $4.34 | 24d | 1 | 0.83mi |
| 3728 Stone Way Estero, FL | 2.0 | 2.0 | 1275 | $2,000 | $1.57 | 24d | 1 | 0.84mi |
| 24361 Sandpiper Isle Way #401 Bonita Springs, FL | 2.0 | 2.0 | 1807 | $8,000 | $4.43 | 24d | 1 | 0.88mi |
| 24300 Sandpiper Isle Way #201 Bonita Springs, FL | 3.0 | 2.5 | 1887 | $7,500 | $3.97 | 24d | 1 | 0.90mi |
| 24360 Sandpiper Isle Way #101 Bonita Springs, FL | 2.0 | 2.0 | 1666 | $6,500 | $3.90 | 24d | 1 | 0.91mi |
HOA detail condo
- Monthly dues
- $451 · $5,412/yr
- Likely covers
- poolgymsecurity
- Assessments
- None detected in remarks — confirm with the listing agent.
Listing history 12 events
-
2026-06-17days on market $425,000 Active 123 DOM
-
2026-06-16days on market $425,000 Active 122 DOM
-
2026-06-15days on market $425,000 Active 121 DOM
-
2026-06-13days on market $425,000 Active 119 DOM
-
2026-06-10days on market $425,000 Active 116 DOM
-
2026-06-09days on market $425,000 Active 115 DOM
-
2026-06-07days on market $425,000 Active 113 DOM
-
2026-06-02days on market $425,000 Active 108 DOM
-
2026-06-01days on market $425,000 Active 107 DOM
-
2026-06-01days on market $425,000 Active 106 DOM
-
2026-02-14$425,000 Active
-
2013-06-20soldstatus $224,000
ⓘ Source: listings_history table (triggers on properties + properties_extension) + one-shot
backfill from property_details.listing_events for pre-trigger history.
Tax reassessment forecast FL · Resets to sale price
- Current annual tax
- $5,314 · $443/mo
- Projected year-2 tax
- $5,314 · $443/mo
- Expected delta
- $0/yr ($0/mo · 0.0%)
ⓘ Screening estimate from a state-policy table — verify with the county assessor before closing.
Climate risk First Street
- Flood 4/10 Moderate FEMA zone X (unshaded) · 16% chance over 30 yrs
- Wildfire 3/10 Moderate
- Heat 10/10 Extreme 7 d/yr ≥107°F today · 30 d/yr by 30 yrs out
- Wind 10/10 Extreme 99% chance of damaging wind over 30 yrs
- Air quality 3/10 Moderate 2 unhealthy d/yr today · 2 by 30 yrs out
Nearby sold comps map
Loading sold comps map…
Walkable amenities ~0.75 mi
Loading nearby amenities…
Taxation est. · year 1
- Rental income
- $43,273
- − Mortgage interest
- −$23,807
- − Property taxes
- −$5,314
- − Insurance
- −$2,125
- − Repairs & maintenance
- −$3,462
- − Management
- −$3,462
- − HOA
- −$5,412
- − Depreciation
- −$12,364
- Taxable loss
- −$12,672
- Est. tax savings @ 24.0%
- +$3,041
- After-tax cash flow
- $-2,369/yr
For passive investors: Depreciation is non-cash, so a rental often shows a tax loss while cash-flowing — sheltering income. Rental losses are passive: they offset passive income freely, and up to $25,000/yr can offset ordinary (W-2) income if you actively participate and your MAGI is under $100k (phasing out to $0 by $150k); unused losses carry forward. On sale, claimed depreciation is recaptured at up to 25%, and gains may owe capital-gains tax (a 1031 exchange can defer both). Figures are a year-1 estimate at your 24.0% rate — not tax advice; consult a CPA.
Schools (NCES district)
- District
- Lee
- NCES district ID
- 1201080
- Math proficiency
- 47% ▼ -11.00%
- Reading proficiency
- 50% ▼ -4.00%
- Median HH income
- $49,518
- Composite
- 41.49/100
- National rank
- #3458
- State rank
- #42 of 73 in FL
Livability — Estero
- Score
- 79/100
- State rank
- #149
- US rank
- #2242
Category grades
Schools grade is shown separately in the Schools card above.
Census & demographics
- Census place
- Estero, FL
- County
- Lee County · 788,662 people
- City population
- 31,926
- Metro
- Cape Coral-Fort Myers, FL
- Population (ZIP)
- 16,475
- Household income
- $130,719
- Rent vs Own
- Severe rent burden
- 554.0
Population outlook (Lee County) Hauer SSP2
- Today (2025)
- 871,946 people
- By 2030
- 955,468 · +9.6%
- By 2040
- 1,113,587 · +27.7%
- By 2050
- 1,256,891 · +44.1%
- By 2075
- 1,560,270 · +78.9%
- By 2100
- 1,726,848 · +98.0%
Race, ethnicity, and origin ACS 2023
- Neighborhood character
- Predominantly White (91%)
- Race & ethnicity
- White 91% Hispanic / Latino 5% Two or more races 3% Asian 1%
- Common ancestry
- Slovak 5% Romanian 4% Serbian 2%
- Foreign-born
- 10% · Canada, Jamaica
- Languages at home
- 91% English-only · Spanish 4% German/W. Germanic 1% Other Indo-European 1%
Political lean MEDSL · Lee
- 2024 margin
- Strong R (+28.4) · D 35.5% · R 63.9%
- 2008→2024 swing
- -18.0pp toward R · 2008: -10.4pp · 2024: -28.4pp
- All cycles
- 2024: R+28.4 2020: R+19.2 2016: R+20.4 2012: R+16.6 2008: R+10.4
Not yet ingested
- Civics
- —
Market trends
- HPI YoY
- ▼ -236.48%
- Current HPI
- 237.4416
- Rent YoY
- ▲ 2.85%
- Metro
- Cape Coral-Fort Myers, FL
- State GDP YoY
- ▲ 3.28%
- F500 in state
- 36
Industry mix (Fortune 500 HQ in FL)
| Industry | F500 HQs | Revenue |
|---|---|---|
| Industrial Technology | 2 | $29B |
|
||
| Insurance | 2 | $17B |
|
||
| Retail | 1 | $60B |
|
||
| Technology Distribution | 1 | $58B |
|
||
| Homebuilding | 1 | $35B |
|
||
| Technology Manufacturing | 1 | $35B |
|
||
Price history
+89.7% since first listed2 events — show timeline
- 2026-02-14 Listed $425,000 NAPLESMLS
- 2013-06-20 Sold (Public Records) $224,000 Public Records
Property tax history
+5.7%/yrLatest (2025): $5,314 · +17.5% YoY. Source: county tax records.
Cash-flow waterfall
monthlySold comps — $/sqft
last 12 mo · ≤1 miLoading sold comps…