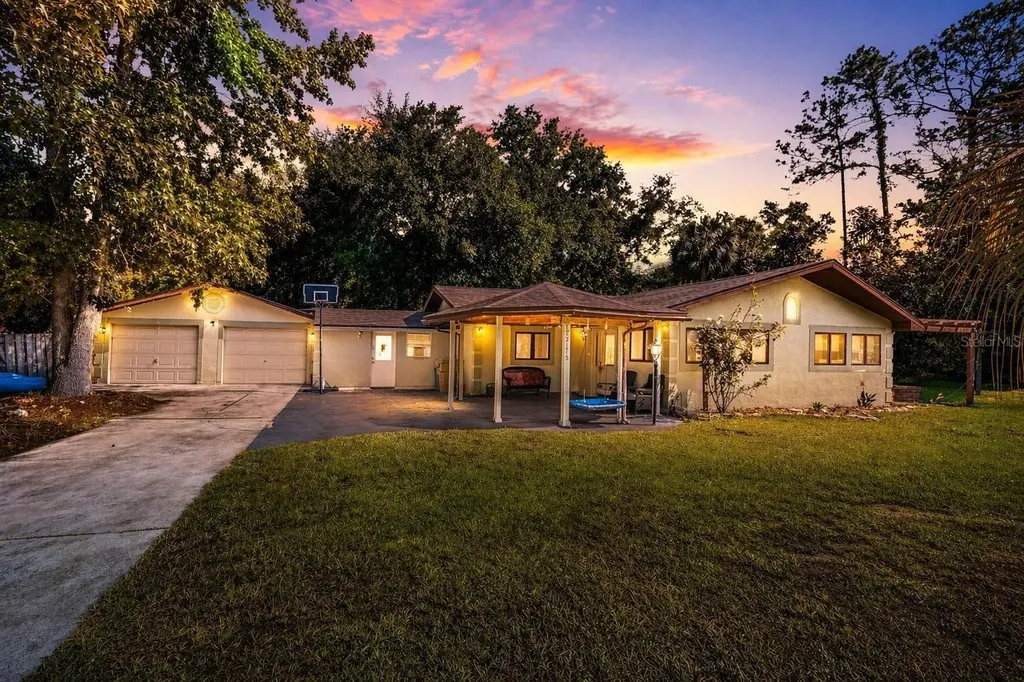
55715 Jack Moore Rd · Astor, FL
Flood risk 1/10 · Minimal
- FEMA flood zone
- X (unshaded)
- Chance of flooding over 30 yrs
- 0.0%
- Est. flood insurance / yr
- $507 – $1,088
Fire risk 5/10 · Moderate
- Est. fire insurance / yr
- $947 – $1,759
Heat risk 8/10 · Major
- Hot days now (above 107°F)
- 7 days/yr
- Hot days in 30 yrs
- 21 days/yr
Wind risk 9/10 · Severe
- Chance of severe wind over 30 yrs
- 99.0%
Air-quality risk 3/10 · Minor
- Unhealthy air days now
- 2 days/yr
- Unhealthy air days in 30 yrs
- 3 days/yr
Risk factors via First Street. Map © Google.
Why this score? — see what drove the D+ grade
The composite is a weighted blend of 9 inputs, each scored 0–100. Each bar is that input's sub-score; the figure is the points it added to the 100-point composite (weight × sub-score).
- Cash flow +14.9/30.0
- ARV discount +7.5/15.0
- Appreciation +6.0/10.0
- DSCR +4.6/10.0
- Schools +4.2/10.0
- 1% rule +3.9/10.0
- Livability +3.3/5.0
- Rent growth +2.5/5.0
- Condition / age +2.5/5.0
$249,000
🖨 Deal sheet 📄 Offer letter ✓ Due diligence
Listing remarks
SELLER MOTIVATED!! Welcome to 55715 Jack Moore Road in Astor, Florida, a quiet retreat tucked into one of Central Florida’s most scenic riverfront communities. This property offers the kind of laid-back lifestyle buyers seek when they want to step away from the pace of the city while still remaining within reach of everyday conveniences. Surrounded by natural beauty and Old Florida charm, Astor is known for its proximity to the St. Johns River, abundant wildlife, and endless opportunities for boating, fishing, and outdoor recreation. The home sits on a generously sized lot, providing ample space for parking, storage, or even future enhancements. Whether you are looking for a primary r
Key facts
- Generously sized lot
- Abundant wildlife
- Natural light
Tags
Property features AI
Finance
- Other: Homestead exemption indicated; Zoned R-7; Living area approximately 2,006 square feet
- Financial info: No lease restrictions indicated
- HOA & community: No homeowners association indicated
Exterior
- Parking: Attached garage with 2 garage spaces
- Utilities: Public water; Public sewer; Electricity connected; Phone available
- Home design: Single family residence; Residential property; One-story; South-facing; Completed condition
- Construction: Block construction; Shingle roof; Slab foundation; Built on a 0.27-acre lot (approx. 109 x 110 x 108 x 110)
- Exterior features: Corner lot; Other exterior features
Interior
- Kitchen: Dishwasher; Range; Range hood; Refrigerator
- Bedrooms: 3 bedrooms
- Flooring: Ceramic tile
- Bathrooms: 1 full bathroom; 1 half bathroom
- Heating & cooling: Central heating; Central air conditioning; Wall/window AC unit(s)
- Interior features: Ceiling fans; Wet bar; 9 total rooms
- Laundry & utility: Laundry area located outside
Neighborhood map
What this means for you Summary
Snapshot
- This is a 3-bed/1.5-bath single-family listed at $249k.
Deal economics
- At list price, monthly cash flow is $75 ($896/yr) — positive.
- The deal already cash-flows at list — no discount required.
- To meet the 1% rule (rent ≥ 1% of price), the offer needs to be $222k (10.6% below list).
- Recommended offer: $222k (10.6% below list) — sets the bar for 1% rule.
Location & tenants
- Location reads 66/100 on livability (#613 in FL) — a middle-class / working-renter tenant base. Strengths: crime A+, cost of living A+, housing A+; Watch: amenities F, commute F, health & safety D-.
- Lake (suburban): math 49% / reading 50% proficiency, ranked #37 of 73 in FL (top 51%) — families likely to look elsewhere, expect single-tenant / working-renter base with shorter leases.
- Zoned schools: Umatilla Elementary School (math 59% / reading 56%, grade C+, #764 of 2,144 statewide, top 36%, 660 students, 55% FRL); Umatilla High School (math 24% / reading 29%, grade F, #489 of 667 statewide, top 74%, 861 students, 51% FRL) — zoned schools at 53% FRL track the district average.
- Market conditions: 77 active listings in the ZIP; 1 comparable units currently listed for rent nearby; 4,799 units permitted in Lake County in 2024 (814 in 5+ unit buildings).
Forward outlook
- In year one you build about $7k of equity ($2k loan paydown + $5k appreciation (1.9% local appreciation)).
- Lake County population projected at +37% by 2050 — long-run rental-demand tailwind backs the buy-and-hold thesis.
- At projected returns (1.9% appreciation + 3.0% rent growth), your $70k cash investment doubles in ~8 years — after that, you're playing with house money.
- By year 6, paydown + projected appreciation supports a ~$36k cash-out refi (75% LTV) — recoverable capital for the next deal without selling this one.
Negotiation context
- It's been on market 59 days — a 3% lower offer ($242k) is reasonable based on typical stale-listing flexibility.
- 7 sale attempts since 5y ago with the ask held roughly flat each time — persistent listings suggest the price (not the market) is what's stuck; bring a comps-based counter.
- Current owner paid $165k; list at $249k implies a 51% gain — meaningful room to come down on a strong offer.
Risks & watch-outs
- Climate carrying-cost: severe wind risk, 99% chance of damaging wind over 30y; moderate wildfire risk; extreme-heat days projected 7→21/yr by 2055 (HVAC capex compounding) — expect insurance premiums to compound above CPI over the hold.
Questions for the listing agent
- It's been on market 59 days. Have you received any prior offers? Is the seller open to a 11% concession, seller financing, or rate buy-down credit?
- Is there a deadline driving the sale (1031 exchange, divorce, estate, relocation)? That informs how much negotiation room exists.
- Schools are F-rated, which usually means shorter tenancies and higher turnover. Who's the typical renter profile here, and what's been the actual vacancy rate?
- The area grade is low — what's the realistic commute time and amenity access for the typical tenant pool here? Any planned neighborhood developments (good or bad) we should know about?
- What's the average days-on-market for RENTAL listings here right now (not sales)? A rising rental-DOM trend means longer vacancies and softer asking-rent achievability than the comps imply.
- What's the recent tenant-quality profile in this submarket — average credit score on applications, eviction rate, late-payment / NSF rate, and stable-employment percentage? A property-management company in the area should have these aggregated.
- How much new for-sale + rental construction is in the pipeline within 1–3 miles? Heavy new supply typically softens prices + rents 12–24 months out; constrained supply supports both.
Investment metrics
- 1% rule
- 0.89% ✗
- Cap rate
- 6.65%
- Cash-on-cash
- 1.29%
- DSCR
- 1.06
- GRM
- 9.3
CMA / ARV
No comps found within radius.
Projected returns pro-forma
1.95% appreciation · 3.0% rent growth · sell at horizon
- IRR
- 5.7%
- Equity multiple
- 1.30×
- Total profit
- $21,220
- Equity at exit
- $97,553
- IRR
- 9.2%
- Equity multiple
- 2.24×
- Total profit
- $86,523
- Equity at exit
- $139,973
Cash invested: $69,720 (down + closing). Projections, not guarantees.
Landlord ↔ Tenant lean methodology
- Overall (STATE)
- 87 Strongly Landlord-Friendly
- State Florida
- 87 Strongly Landlord-Friendly · R+3
- County
- — inherits STATE
- City
- — inherits STATE
ZIP-level market 32102
- Home prices YoY
- 0.8%
- Active inventory
- 77
- Price-to-rent
- 9.3×
Monthly cashflow live
- Estimated rent
- $2,225 medium interval (Pro) →
- Mortgage (P&I)
- −$1,306
- Tax from tax record
- −$274 /mo · $3,282/yr
- Insurance
- −$104
- HOA
- −$0
- Vacancy / Maint / Mgmt
- −$467
- Net cashflow
- $75
Break-even live
UW: 25.0% down · 7.5% · 30yr · 1.5% tax · 5.0% vac · 8.0% maint · 8.0% mgmt
Financing live
Cash to close
- Down payment
- $62,250
- Closing costs
- $7,470
- Reserves months
- —
- Total cash needed
- —
Loan-product check · same deal, 3 products live
Conventional
25% down · 7.5% · 30yr
- Down + closing
- —
- Monthly P&I
- —
- Monthly cashflow
- —
- DSCR
- —
- Eligible?
- —
Personal DTI + credit; lowest rate.
DSCR
20% down · 8.5% · 30yr
- Down + closing
- —
- Monthly P&I
- —
- Monthly cashflow
- —
- DSCR
- —
- Eligible?
- —
No personal income docs; deal must DSCR.
Hard money
10% down · 12.0% · 12mo
- Down + closing
- —
- Monthly P&I
- —
- Monthly cashflow
- —
- DSCR
- —
- Eligible?
- —
Short-term bridge; refi at stabilization.
Rent comps 1 comps
| Address | Beds | Baths | Sqft | Rent | $/sqft | DOM | Units | Dist |
|---|---|---|---|---|---|---|---|---|
| 55624 Sam St Astor, FL | 2.0 | 2.0 | 1792 | $2,225 | $1.24 | 10d | 1 | 0.80mi |
Listing history 31 events
-
2026-06-18days on market $249,000 Active 59 DOM
-
2026-06-17days on market $249,000 Active 58 DOM
-
2026-06-16days on market $249,000 Active 57 DOM
-
2026-06-15days on market $249,000 Active 56 DOM
-
2026-06-13days on market $249,000 Active 54 DOM
-
2026-06-09days on market $249,000 Active 50 DOM
-
2026-06-08days on market $249,000 Active 49 DOM
-
2026-06-07days on market $249,000 Active 48 DOM
-
2026-06-04days on market $249,000 Active 45 DOM
-
2026-06-03days on market $249,000 Active 44 DOM
-
2026-06-02days on market $249,000 Active 43 DOM
-
2026-06-01days on market $249,000 Active 42 DOM
-
2026-05-31days on market $249,000 Active 41 DOM
-
2026-04-20$249,000 Active
-
2024-05-08historical
-
2024-05-07status Active
-
2024-05-04status Pending
-
2024-05-01price $229,900
-
2024-04-17$239,900 Active
-
2022-09-01historical
-
2022-08-19price $224,900
-
2022-08-12$229,900 Active
-
2021-06-23soldstatus $165,000
-
2021-06-01soldstatus $165,000 Closed
-
2021-04-03status Pending
-
2021-02-17status Active
-
2021-02-08status Pending
-
2021-02-08status Active
-
2021-02-08status Pending
-
2021-01-27$165,000 Active
-
1997-07-03soldstatus $67,000
ⓘ Source: listings_history table (triggers on properties + properties_extension) + one-shot
backfill from property_details.listing_events for pre-trigger history.
Tax reassessment forecast FL · Resets to sale price
- Current annual tax
- $3,282 · $274/mo
- Projected year-2 tax
- $3,282 · $274/mo
- Expected delta
- $0/yr ($0/mo · 0.0%)
ⓘ Screening estimate from a state-policy table — verify with the county assessor before closing.
Climate risk First Street
- Flood 1/10 Low FEMA zone X (unshaded) · 0% chance over 30 yrs
- Wildfire 5/10 Major
- Heat 8/10 Severe 7 d/yr ≥107°F today · 21 d/yr by 30 yrs out
- Wind 9/10 Extreme 99% chance of damaging wind over 30 yrs
- Air quality 3/10 Moderate 2 unhealthy d/yr today · 3 by 30 yrs out
Nearby sold comps map
Loading sold comps map…
Walkable amenities ~0.75 mi
Loading nearby amenities…
Taxation est. · year 1
- Rental income
- $26,700
- − Mortgage interest
- −$13,948
- − Property taxes
- −$3,282
- − Insurance
- −$1,245
- − Repairs & maintenance
- −$2,136
- − Management
- −$2,136
- − Depreciation
- −$7,244
- Taxable loss
- −$3,291
- Est. tax savings @ 24.0%
- +$790
- After-tax cash flow
- $1,686/yr
For passive investors: Depreciation is non-cash, so a rental often shows a tax loss while cash-flowing — sheltering income. Rental losses are passive: they offset passive income freely, and up to $25,000/yr can offset ordinary (W-2) income if you actively participate and your MAGI is under $100k (phasing out to $0 by $150k); unused losses carry forward. On sale, claimed depreciation is recaptured at up to 25%, and gains may owe capital-gains tax (a 1031 exchange can defer both). Figures are a year-1 estimate at your 24.0% rate — not tax advice; consult a CPA.
Schools (NCES district)
- District
- Lake
- NCES district ID
- 1201050
- Math proficiency
- 49% ▼ -7.00%
- Reading proficiency
- 50% ▼ -4.00%
- Median HH income
- $46,632
- Composite
- 42.05/100
- National rank
- #3327
- State rank
- #37 of 73 in FL
Livability — Astor
- Score
- 66/100
- State rank
- #613
- US rank
- #11822
Category grades
Schools grade is shown separately in the Schools card above.
Census & demographics
- Census place
- Astor, FL
- Population (ZIP)
- 2,401
Population outlook (Lake County) Hauer SSP2
- Today (2025)
- 386,640 people
- By 2030
- 417,107 · +7.9%
- By 2040
- 476,676 · +23.3%
- By 2050
- 531,296 · +37.4%
- By 2075
- 648,303 · +67.7%
- By 2100
- 698,530 · +80.7%
Race, ethnicity, and origin ACS 2023
- Neighborhood character
- Predominantly White (89%)
- Race & ethnicity
- White 89% Two or more races 7% Hispanic / Latino 3%
- Common ancestry
- Lithuanian 9% Portuguese 8% Slovak 2%
- Foreign-born
- 2% · Canada
- Languages at home
- 95% English-only · Spanish 3% German/W. Germanic 1% Russian/Polish/Slavic 1%
Political lean MEDSL · Lake
- 2024 margin
- Strong R (+24.7) · D 37.3% · R 62.0%
- 2008→2024 swing
- -11.2pp toward R · 2008: -13.5pp · 2024: -24.7pp
- All cycles
- 2024: R+24.7 2020: R+20.0 2016: R+23.1 2012: R+17.1 2008: R+13.5
Not yet ingested
- Civics
- —
Market trends
- HPI YoY
- ▲ 1.95%
- Current HPI
- 232.7974
- Rent YoY
- —
- Metro
- —
- State GDP YoY
- ▲ 3.28%
- F500 in state
- 36
Industry mix (Fortune 500 HQ in FL)
| Industry | F500 HQs | Revenue |
|---|---|---|
| Industrial Technology | 2 | $29B |
|
||
| Insurance | 2 | $17B |
|
||
| Retail | 1 | $60B |
|
||
| Technology Distribution | 1 | $58B |
|
||
| Homebuilding | 1 | $35B |
|
||
| Technology Manufacturing | 1 | $35B |
|
||
Price history
+271.6% since first listed18 events — show timeline
- 2026-04-20 Listed $249,000 Stellar MLS as Distributed by MLS Grid
- 2024-05-08 Listing Removed — Stellar MLS as Distributed by MLS Grid
- 2024-05-07 Relisted — Stellar MLS as Distributed by MLS Grid
- 2024-05-04 Pending — Stellar MLS as Distributed by MLS Grid
- 2024-05-01 Price Changed $229,900 Stellar MLS as Distributed by MLS Grid
- 2024-04-17 Listed $239,900 Stellar MLS as Distributed by MLS Grid
- 2022-09-01 Listing Removed — Stellar MLS as Distributed by MLS Grid
- 2022-08-19 Price Changed $224,900 Stellar MLS as Distributed by MLS Grid
- 2022-08-12 Listed $229,900 Stellar MLS as Distributed by MLS Grid
- 2021-06-23 Sold (Public Records) $165,000 Public Records
- 2021-06-01 Sold (MLS) $165,000 Stellar MLS as Distributed by MLS Grid
- 2021-04-03 Pending — Stellar MLS as Distributed by MLS Grid
- 2021-02-17 Relisted — Stellar MLS as Distributed by MLS Grid
- 2021-02-08 Pending — Stellar MLS as Distributed by MLS Grid
- 2021-02-08 Relisted — Stellar MLS as Distributed by MLS Grid
- 2021-02-08 Pending — Stellar MLS as Distributed by MLS Grid
- 2021-01-27 Listed $165,000 Stellar MLS as Distributed by MLS Grid
- 1997-07-03 Sold (Public Records) $67,000 Public Records
Property tax history
+16.9%/yrLatest (2025): $3,282 · +1.5% YoY. Source: county tax records.
Cash-flow waterfall
monthlySold comps — $/sqft
last 12 mo · ≤1 miLoading sold comps…